


More on Leadership

Looi Qin En
3 years ago
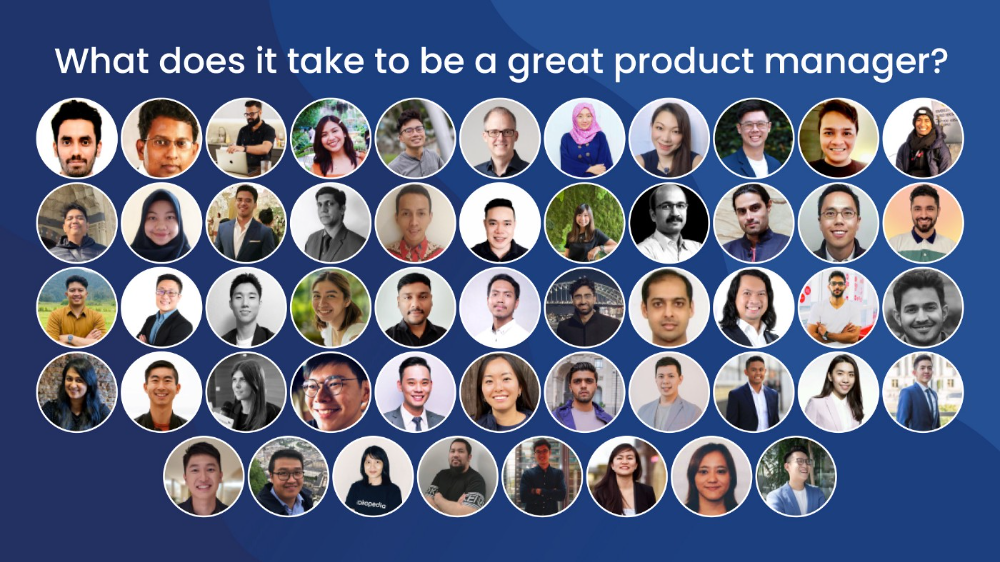
I polled 52 product managers to find out what qualities make a great Product Manager
Great technology opens up an universe of possibilities.
Need a friend? WhatsApp, Telegram, Slack, etc.
Traveling? AirBnB, Expedia, Google Flights, etc.
Money transfer? Use digital banking, e-wallet, or crypto applications
Products inspire us. How do we become great?
I asked product managers in my network:
What does it take to be a great product manager?
52 product managers from 40+ prominent IT businesses in Southeast Asia responded passionately. Many of the PMs I've worked with have built fantastic products, from unicorns (Lazada, Tokopedia, Ovo) to incumbents (Google, PayPal, Experian, WarnerMedia) to growing (etaily, Nium, Shipper).
TL;DR:
Soft talents are more important than hard skills. Technical expertise was hardly ever stressed by product managers, and empathy was mentioned more than ten times. Janani from Xendit expertly recorded the moment. A superb PM must comprehend that their empathy for the feelings of their users must surpass all logic and data.
Constant attention to the needs of the user. Many people concur that the closer a PM gets to their customer/user, the more likely it is that the conclusion will be better. There were almost 30 references to customers and users. Focusing on customers has the advantage because it is hard to overshoot, as Rajesh from Lazada puts it best.
Setting priorities is invaluable. Prioritization is essential because there are so many problems that a PM must deal with every day. My favorite quotation on this is from Rakuten user Yee Jie. Viki, A competent product manager extinguishes fires. A good product manager lets things burn and then prioritizes.
This summary isn't enough to capture what excellent PMs claim it requires. Read below!
What qualities make a successful product manager?
Themed quotes are alphabetized by author.
Embrace your user/customer
Aeriel Dela Paz, Rainmaking Venture Architect, ex-GCash Product Head
Great PMs know what customers need even when they don’t say it directly. It’s about reading between the lines and going through the numbers to address that need.
Anders Nordahl, OrkestraSCS's Product Manager
Understanding the vision of your customer is as important as to get the customer to buy your vision
Angel Mendoza, MetaverseGo's Product Head
Most people think that to be a great product manager, you must have technical know-how. It’s textbook and I do think it is helpful to some extent, but for me the secret sauce is EMPATHY — the ability to see and feel things from someone else’s perspective. You can’t create a solution without deeply understanding the problem.
Senior Product Manager, Tokopedia
Focus on delivering value and helping people (consumer as well as colleague) and everything else will follow
Darren Lau, Deloitte Digital's Head of Customer Experience
Start with the users, and work backwards. Don’t have a solution looking for a problem
Darryl Tan, Grab Product Manager
I would say that a great product manager is able to identify the crucial problems to solve through strong user empathy and synthesis of insights
Diego Perdana, Kitalulus Senior Product Manager
I think to be a great product manager you need to be obsessed with customer problems and most important is solve the right problem with the right solution
Senior Product Manager, AirAsia
Lot of common sense + Customer Obsession. The most important role of a Product manager is to bring clarity of a solution. Your product is good if it solves customer problems. Your product is great if it solves an eco-system problem and disrupts the business in a positive way.
Edward Xie, Mastercard Managing Consultant, ex-Shopee Product Manager
Perfect your product, but be prepared to compromise for right users
AVP Product, Shipper
For me, a great product manager need to be rational enough to find the business opportunities while obsessing the customers.
Janani Gopalakrishnan is a senior product manager of a stealth firm.
While as a good PM it’s important to be data-driven, to be a great PM one needs to understand that their empathy for their users’ emotions must exceed all logic and data. Great PMs also make these product discussions thrive within the team by intently listening to all the members thoughts and influence the team’s skin in the game positively.
Director, Product Management, Indeed
Great product managers put their users first. They discover problems that matter most to their users and inspire their team to find creative solutions.
Grab's Senior Product Manager Lakshay Kalra
Product management is all about finding and solving most important user problems
Quipper's Mega Puji Saraswati
First of all, always remember the value of “user first” to solve what user really needs (the main problem) for guidance to arrange the task priority and develop new ideas. Second, ownership. Treat the product as your “2nd baby”, and the team as your “2nd family”. Third, maintain a good communication, both horizontally and vertically. But on top of those, always remember to have a work — life balance, and know exactly the priority in life :)
Senior Product Manager, Prosa.AI Miswanto Miswanto
A great Product Manager is someone who can be the link between customer needs with the readiness and flexibility of the team. So that it can provide, build, and produce a product that is useful and helps the community to carry out their daily activities. And He/She can improve product quality ongoing basis or continuous to help provide solutions for users or our customer.
Lead Product Manager, Tokopedia, Oriza Wahyu Utami
Be a great listener, be curious and be determined. every great product manager have the ability to listen the pain points and understand the problems, they are always curious on the users feedback, and they also very determined to look for the solutions that benefited users and the business.
99 Group CPO Rajesh Sangati
The advantage of focusing on customers: it’s impossible to overshoot
Ray Jang, founder of Scenius, formerly of ByteDance
The difference between good and great product managers is that great product managers are willing to go the unsexy and unglamorous extra mile by rolling up their sleeves and ironing out all minutiae details of the product such that when the user uses the product, they can’t help but say “This was made for me.”
BCG Digital Ventures' Sid Narayanan
Great product managers ensure that what gets built and shipped is at the intersection of what creates value for the customer and for the business that’s building the product…often times, especially in today’s highly liquid funding environment, the unit economics, aka ensuring that what gets shipped creates value for the business and is sustainable, gets overlooked
Stephanie Brownlee, BCG Digital Ventures Product Manager
There is software in the world that does more harm than good to people and society. Great Product Managers build products that solve problems not create problems
Experiment constantly
Delivery Hero's Abhishek Muralidharan
Embracing your failure is the key to become a great Product Manager
DeliveryHero's Anuraag Burman
Product Managers should be thick skinned to deal with criticism and the stomach to take risk and face failures.
DataSpark Product Head Apurva Lawale
Great product managers enjoy the creative process with their team to deliver intuitive user experiences to benefit users.
Dexter Zhuang, Xendit Product Manager
The key to creating winning products is building what customers want as quickly as you can — testing and learning along the way.
PayPal's Jay Ko
To me, great product managers always remain relentlessly curious. They are empathetic leaders and problem solvers that glean customer insights into building impactful products
Home Credit Philippines' Jedd Flores
Great Product Managers are the best dreamers; they think of what can be possible for the customers, for the company and the positive impact that it will have in the industry that they’re part of
Set priorities first, foremost, foremost.
HBO Go Product Manager Akshay Ishwar
Good product managers strive to balance the signal to noise ratio, Great product managers know when to turn the dials for each up exactly
Zuellig Pharma's Guojie Su
Have the courage to say no. Managing egos and request is never easy and rejecting them makes it harder but necessary to deliver the best value for the customers.
Ninja Van's John Prawira
(1) PMs should be able to ruthlessly prioritize. In order to be effective, PMs should anchor their product development process with their north stars (success metrics) and always communicate with a purpose. (2) User-first when validating assumptions. PMs should validate assumptions early and often to manage risk when leading initiatives with a focus on generating the highest impact to solving a particular user pain-point. We can’t expect a product/feature launch to be perfect (there might be bugs or we might not achieve our success metric — which is where iteration comes in), but we should try our best to optimize on user-experience earlier on.
Nium Product Manager Keika Sugiyama
I’d say a great PM holds the ability to balance ruthlessness and empathy at the same time. It’s easier said than done for sure!
ShopBack product manager Li Cai
Great product managers are like great Directors of movies. They do not create great products/movies by themselves. They deliver it by Defining, Prioritising, Energising the team to deliver what customers love.
Quincus' Michael Lim
A great product manager, keeps a pulse on the company’s big picture, identifies key problems, and discerns its rightful prioritization, is able to switch between the macro perspective to micro specifics, and communicates concisely with humility that influences naturally for execution
Mathieu François-Barseghian, SVP, Citi Ventures
“You ship your org chart”. This is Conway’s Law short version (1967!): the fundamental socio-technical driver behind innovation successes (Netflix) and failures (your typical bank). The hype behind micro-services is just another reflection of Conway’s Law
Mastercard's Regional Product Manager Nikhil Moorthy
A great PM should always look to build products which are scalable & viable , always keep the end consumer journey in mind. Keeping things simple & having a MVP based approach helps roll out products faster. One has to test & learn & then accordingly enhance / adapt, these are key to success
Rendy Andi, Tokopedia Product Manager
Articulate a clear vision and the path to get there, Create a process that delivers the best results and Be serious about customers.
Senior Product Manager, DANA Indonesia
Own the problem, not the solution — Great PMs are outstanding problem preventers. Great PMs are discerning about which problems to prevent, which problems to solve, and which problems not to solve
Tat Leong Seah, LionsBot International Senior UX Engineer, ex-ViSenze Product Manager
Prioritize outcomes for your users, not outputs of your system” or more succinctly “be agile in delivering value; not features”
Senior Product Manager, Rakuten Viki
A good product manager puts out fires. A great product manager lets fires burn and prioritize from there
acquire fundamental soft skills
Oracle NetSuite's Astrid April Dominguez
Personally, i believe that it takes grit, empathy, and optimistic mindset to become a great PM
Ovo Lead Product Manager Boy Al Idrus
Contrary to popular beliefs, being a great product manager doesn’t have anything to do with technicals, it sure plays a part but most important weapons are: understanding pain points of users, project management, sympathy in leadership and business critical skills; these 4 aspects would definitely help you to become a great product manager.
PwC Product Manager Eric Koh
Product managers need to be courageous to be successful. Courage is required to dive deep, solving big problems at its root and also to think far and dream big to achieve bold visions for your product
Ninja Van's Product Director
In my opinion the two most important ingredients to become a successful product manager is: 1. Strong critical thinking 2. Strong passion for the work. As product managers, we typically need to solve very complex problems where the answers are often very ambiguous. The work is tough and at times can be really frustrating. The 2 ingredients I mentioned earlier will be critical towards helping you to slowly discover the solution that may become a game changer.
PayPal's Lead Product Manager
A great PM has an eye of a designer, the brain of an engineer and the tongue of a diplomat
Product Manager Irene Chan
A great Product Manager is able to think like a CEO of the company. Visionary with Agile Execution in mind
Isabella Yamin, Rakuten Viki Product Manager
There is no one model of being a great product person but what I’ve observed from people I’ve had the privilege working with is an overflowing passion for the user problem, sprinkled with a knack for data and negotiation
Google product manager Jachin Cheng
Great product managers start with abundant intellectual curiosity and grow into a classic T-shape. Horizontally: generalists who range widely, communicate fluidly and collaborate easily cross-functionally, connect unexpected dots, and have the pulse both internally and externally across users, stakeholders, and ecosystem players. Vertically: deep product craftsmanship comes from connecting relentless user obsession with storytelling, business strategy with detailed features and execution, inspiring leadership with risk mitigation, and applying the most relevant tools to solving the right problems.
Jene Lim, Experian's Product Manager
3 Cs and 3 Rs. Critical thinking , Customer empathy, Creativity. Resourcefulness, Resilience, Results orientation.
Nirenj George, Envision Digital's Security Product Manager
A great product manager is someone who can lead, collaborate and influence different stakeholders around the product vision, and should be able to execute the product strategy based on customer insights, as well as take ownership of the product roadmap to create a greater impact on customers.
Grab's Lead Product Manager
Product Management is a multi-dimensional role that looks very different across each product team so each product manager has different challenges to deal with but what I have found common among great product managers is ability to create leverage through their efforts to drive outsized impacts for their products. This leverage is built using data with intuition, building consensus with stakeholders, empowering their teams and focussed efforts on needle moving work.
NCS Product Manager Umar Masagos
To be a great product manager, one must master both the science and art of Product Management. On one hand, you need have a strong understanding of the tools, metrics and data you need to drive your product. On the other hand, you need an in-depth understanding of your organization, your target market and target users, which is often the more challenging aspect to master.
M1 product manager Wei Jiao Keong
A great product manager is multi-faceted. First, you need to have the ability to see the bigger picture, yet have a keen eye for detail. Secondly, you are empathetic and is able to deliver products with exceptional user experience while being analytical enough to achieve business outcomes. Lastly, you are highly resourceful and independent yet comfortable working cross-functionally.
Yudha Utomo, ex-Senior Product Manager, Tokopedia
A great Product Manager is essentially an effective note-taker. In order to achieve the product goals, It is PM’s job to ensure objective has been clearly conveyed, efforts are assessed, and tasks are properly tracked and managed. PM can do this by having top-notch documentation skills.

Joe Procopio
3 years ago
Provide a product roadmap that can withstand startup velocities
This is how to build a car while driving.
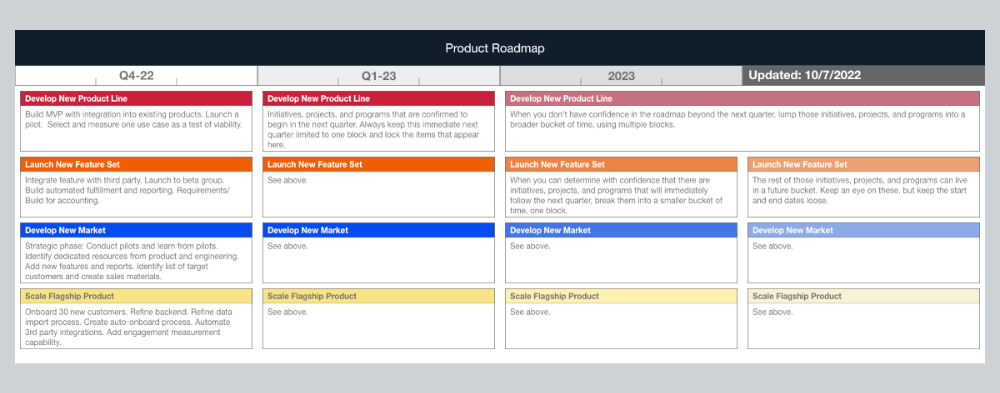
Building a high-growth startup is compared to building a car while it's speeding down the highway.
How to plan without going crazy? Or, without losing team, board, and investor buy-in?
I just delivered our company's product roadmap for the rest of the year. Complete. Thorough. Page-long. I'm optimistic about its chances of surviving as everything around us changes, from internal priorities to the global economy.
It's tricky. This isn't the first time I've created a startup roadmap. I didn't invent a document. It took time to deliver a document that will be relevant for months.
Goals matter.
Although they never change, goals are rarely understood.
This is the third in a series about a startup's unique roadmapping needs. Velocity is the intensity at which a startup must produce to survive.
A high-growth startup moves at breakneck speed, which I alluded to when I said priorities and economic factors can change daily or weekly.
At that speed, a startup's roadmap must be flexible, bend but not break, and be brief and to the point. I can't tell you how many startups and large companies develop a product roadmap every quarter and then tuck it away.
Big, wealthy companies can do this. It's suicide for a startup.
The drawer thing happens because startup product roadmaps are often valid for a short time. The roadmap is a random list of features prioritized by different company factions and unrelated to company goals.
It's not because the goals changed that a roadmap is shelved or ignored. Because the company's goals were never communicated or documented in the context of its product.
In the previous post, I discussed how to turn company goals into a product roadmap. In this post, I'll show you how to make a one-page startup roadmap.
In a future post, I'll show you how to follow this roadmap. This roadmap helps you track company goals, something a roadmap must do.
Be vague for growth, but direct for execution.
Here's my plan. The real one has more entries and more content in each.
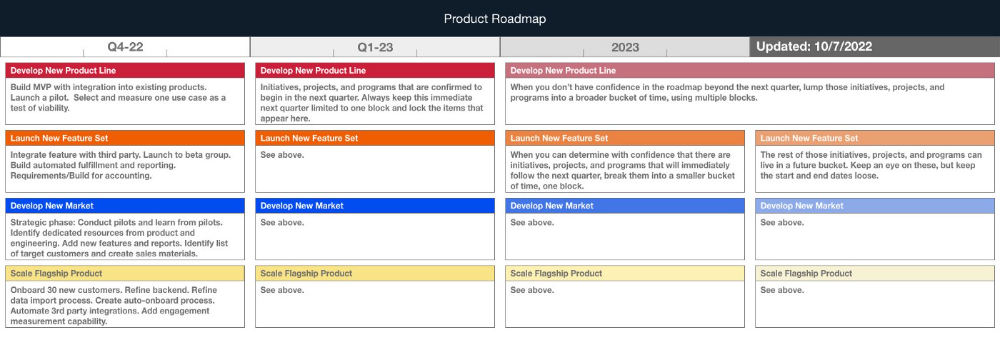
Let's discuss smaller boxes.
Product developers and engineers know that the further out they predict, the more wrong they'll be. When developing the product roadmap, this rule is ignored. Then it bites us three, six, or nine months later when we haven't even started.
Why do we put everything in a product roadmap like a project plan?
Yes, I know. We use it when the product roadmap isn't goal-based.
A goal-based roadmap begins with a document that outlines each goal's idea, execution, growth, and refinement.
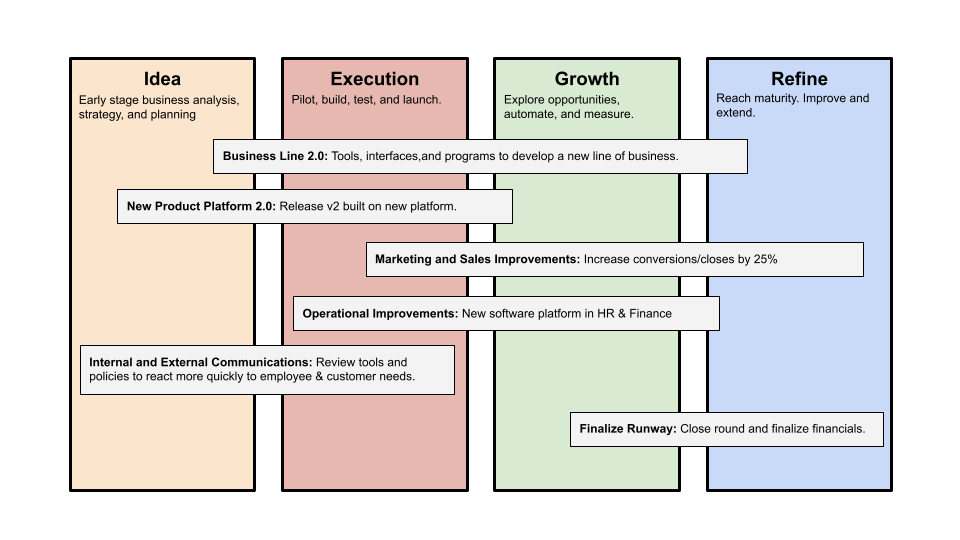
Once the goals are broken down into epics, initiatives, projects, and programs, only the idea and execution phases should be modeled. Any goal growth or refinement items should be vague and loosely mapped.
Why? First, any idea or execution-phase goal will result in growth initiatives that are unimaginable today. Second, internal priorities and external factors will change, but the goals won't. Locking items into calendar slots reduces flexibility and forces deviation from the single source of truth.
No soothsayers. Predicting the future is pointless; just prepare.
A map is useless if you don't know where you're going.
As we speed down the road, the car and the road will change. Goals define the destination.
This quarter and next quarter's roadmap should be set. After that, you should track destination milestones, not how to get there.
When you do that, even the most critical investors will understand the roadmap and buy in. When you track progress at the end of the quarter and revise your roadmap, the destination won't change.

William Anderson
3 years ago
When My Remote Leadership Skills Took Off
4 Ways To Manage Remote Teams & Employees
The wheels hit the ground as I landed in Rochester.
Our six-person satellite office was now part of my team.
Their manager only reported to me the day before, but I had my ticket booked ahead of time.
I had managed remote employees before but this was different. Engineers dialed into headquarters for every meeting.
So when I learned about the org chart change, I knew a strong first impression would set the tone for everything else.
I was either their boss, or their boss's boss, and I needed them to know I was committed.
Managing a fleet of satellite freelancers or multiple offices requires treating others as more than just a face behind a screen.
You must comprehend each remote team member's perspective and daily interactions.
The good news is that you can start using these techniques right now to better understand and elevate virtual team members.
1. Make Visits To Other Offices
If budgeted, visit and work from offices where teams and employees report to you. Only by living alongside them can one truly comprehend their problems with communication and other aspects of modern life.
2. Have Others Come to You
• Having remote, distributed, or satellite employees and teams visit headquarters every quarter or semi-quarterly allows the main office culture to rub off on them.
When remote team members visit, more people get to meet them, which builds empathy.
If you can't afford to fly everyone, at least bring remote managers or leaders. Hopefully they can resurrect some culture.
3. Weekly Work From Home
No home office policy?
Make one.
WFH is a team-building, problem-solving, and office-viewing opportunity.
For dial-in meetings, I started working from home on occasion.
It also taught me which teams “forget” or “skip” calls.
As a remote team member, you experience all the issues first hand.
This isn't as accurate for understanding teams in other offices, but it can be done at any time.
4. Increase Contact Even If It’s Just To Chat
Don't underestimate office banter.
Sometimes it's about bonding and trust, other times it's about business.
If you get all this information in real-time, please forward it.
Even if nothing critical is happening, call remote team members to check in and chat.
I guarantee that building relationships and rapport will increase both their job satisfaction and yours.
You might also like

DC Palter
3 years ago
Is Venture Capital a Good Fit for Your Startup?
5 VC investment criteria
I reviewed 200 startup business concepts last week. Brainache.
The enterprises sold various goods and services. The concepts were achingly similar: give us money, we'll produce a product, then get more to expand. No different from daily plans and pitches.
Most of those 200 plans sounded plausible. But 10% looked venture-worthy. 90% of startups need alternatives to venture finance.
With the success of VC-backed businesses and the growth of venture funds, a common misperception is that investors would fund any decent company idea. Finding investors that believe in the firm and founders is the key to funding.
Incorrect. Venture capital needs investing in certain enterprises. If your startup doesn't match the model, as most early-stage startups don't, you can revise your business plan or locate another source of capital.
Before spending six months pitching angels and VCs, make sure your startup fits these criteria.
Likely to generate $100 million in sales
First, I check the income predictions in a pitch deck. If it doesn't display $100M, don't bother.
The math doesn't work for venture financing in smaller businesses.
Say a fund invests $1 million in a startup valued at $5 million that is later acquired for $20 million. That's a win everyone should celebrate. Most VCs don't care.
Consider a $100M fund. The fund must reach $360M in 7 years with a 20% return. Only 20-30 investments are possible. 90% of the investments will fail, hence the 23 winners must return $100M-$200M apiece. $15M isn't worth the work.
Angel investors and tiny funds use the same ideas as venture funds, but their smaller scale affects the calculations. If a company can support its growth through exit on less than $2M in angel financing, it must have $25M in revenues before large companies will consider acquiring it.
Aiming for Hypergrowth
A startup's size isn't enough. It must expand fast.
Developing a great business takes time. Complex technology must be constructed and tested, a nationwide expansion must be built, or production procedures must go from lab to pilot to factories. These can be enormous, world-changing corporations, but venture investment is difficult.
The normal 10-year venture fund life. Investments are made during first 3–4 years.. 610 years pass between investment and fund dissolution. Funds need their investments to exit within 5 years, 7 at the most, therefore add a safety margin.
Longer exit times reduce ROI. A 2-fold return in a year is excellent. Loss at 2x in 7 years.
Lastly, VCs must prove success to raise their next capital. The 2nd fund is raised from 1st fund portfolio increases. Third fund is raised using 1st fund's cash return. Fund managers must raise new money quickly to keep their jobs.
Branding or technology that is protected
No big firm will buy a startup at a high price if they can produce a competing product for less. Their development teams, consumer base, and sales and marketing channels are large. Who needs you?
Patents, specialist knowledge, or brand name are the only answers. The acquirer buys this, not the thing.
I've heard of several promising startups. It's not a decent investment if there's no exit strategy.
A company that installs EV charging stations in apartments and shopping areas is an example. It's profitable, repeatable, and big. A terrific company. Not a startup.
This building company's operations aren't secret. No technology to protect, no special information competitors can't figure out, no go-to brand name. Despite the immense possibilities, a large construction company would be better off starting their own.
Most venture businesses build products, not services. Services can be profitable but hard to safeguard.
Probable purchase at high multiple
Once a software business proves its value, acquiring it is easy. Pharma and medtech firms have given up on their own research and instead acquire startups after regulatory permission. Many startups, especially in specialized areas, have this weakness.
That doesn't mean any lucrative $25M-plus business won't be acquired. In many businesses, the venture model requires a high exit premium.
A startup invents a new glue. 3M, BASF, Henkel, and others may buy them. Adding more adhesive to their catalogs won't boost commerce. They won't compete to buy the business. They'll only buy a startup at a profitable price. The acquisition price represents a moderate EBITDA multiple.
The company's $100M revenue presumably yields $10m in profits (assuming they’ve reached profitability at all). A $30M-$50M transaction is likely. Not terrible, but not what venture investors want after investing $25M to create a plant and develop the business.
Private equity buys profitable companies for a moderate profit multiple. It's a good exit for entrepreneurs, but not for investors seeking 10x or more what PE firms pay. If a startup offers private equity as an exit, the conversation is over.
Constructed for purchase
The startup wants a high-multiple exit. Unless the company targets $1B in revenue and does an IPO, exit means acquisition.
If they're constructing the business for acquisition or themselves, founders must decide.
If you want an indefinitely-running business, I applaud you. We need more long-term founders. Most successful organizations are founded around consumer demands, not venture capital's urge to grow fast and exit. Not venture funding.
if you don't match the venture model, what to do
VC funds moonshots. The 10% that succeed are extraordinary. Not every firm is a rocketship, and launching the wrong startup into space, even with money, will explode.
But just because your startup won't make $100M in 5 years doesn't mean it's a bad business. Most successful companies don't follow this model. It's not venture capital-friendly.
Although venture capital gets the most attention due to a few spectacular triumphs (and disasters), it's not the only or even most typical option to fund a firm.
Other ways to support your startup:
Personal and family resources, such as credit cards, second mortgages, and lines of credit
bootstrapping off of sales
government funding and honors
Private equity & project financing
collaborating with a big business
Including a business partner
Before pitching angels and VCs, be sure your startup qualifies. If so, include them in your pitch.

Ryan Weeks
3 years ago
Terra fiasco raises TRON's stablecoin backstop
After Terra's algorithmic stablecoin collapsed in May, TRON announced a plan to increase the capital backing its own stablecoin.
USDD, a near-carbon copy of Terra's UST, arrived on the TRON blockchain on May 5. TRON founder Justin Sun says USDD will be overcollateralized after initially being pegged algorithmically to the US dollar.
A reserve of cryptocurrencies and stablecoins will be kept at 130 percent of total USDD issuance, he said. TRON described the collateral ratio as "guaranteed" and said it would begin publishing real-time updates on June 5.
Currently, the reserve contains 14,040 bitcoin (around $418 million), 140 million USDT, 1.9 billion TRX, and 8.29 billion TRX in a burning contract.
Sun: "We want to hybridize USDD." We have an algorithmic stablecoin and TRON DAO Reserve.
algorithmic failure
USDD was designed to incentivize arbitrageurs to keep its price pegged to the US dollar by trading TRX, TRON's token, and USDD. Like Terra, TRON signaled its intent to establish a bitcoin and cryptocurrency reserve to support USDD in extreme market conditions.
Still, Terra's UST failed despite these safeguards. The stablecoin veered sharply away from its dollar peg in mid-May, bringing down Terra's LUNA and wiping out $40 billion in value in days. In a frantic attempt to restore the peg, billions of dollars in bitcoin were sold and unprecedented volumes of LUNA were issued.
Sun believes USDD, which has a total circulating supply of $667 million, can be backed up.
"Our reserve backing is diversified." Bitcoin and stablecoins are included. USDC will be a small part of Circle's reserve, he said.
TRON's news release lists the reserve's assets as bitcoin, TRX, USDC, USDT, TUSD, and USDJ.
All Bitcoin addresses will be signed so everyone knows they belong to us, Sun said.
Not giving in
Sun told that the crypto industry needs "decentralized" stablecoins that regulators can't touch.
Sun said the Luna Foundation Guard, a Singapore-based non-profit that raised billions in cryptocurrency to buttress UST, mismanaged the situation by trying to sell to panicked investors.
He said, "We must be ahead of the market." We want to stabilize the market and reduce volatility.
Currently, TRON finances most of its reserve directly, but Sun says the company hopes to add external capital soon.
Before its demise, UST holders could park the stablecoin in Terra's lending platform Anchor Protocol to earn 20% interest, which many deemed unsustainable. TRON's JustLend is similar. Sun hopes to raise annual interest rates from 17.67% to "around 30%."
This post is a summary. Read full article here

Ellane W
3 years ago
The Last To-Do List Template I'll Ever Need, Years in the Making
The holy grail of plain text task management is finally within reach

Plain text task management? Are you serious?? Dedicated task managers exist for a reason, you know. Sheesh.
—Oh, I know. Believe me, I know! But hear me out.
I've managed projects and tasks in plain text for more than four years. Since reorganizing my to-do list, plain text task management is within reach.
Data completely yours? One billion percent. Beef it up with coding? Be my guest.
Enter: The List
The answer? A list. That’s it!
Write down tasks. Obsidian, Notenik, Drafts, or iA Writer are good plain text note-taking apps.
List too long? Of course, it is! A large list tells you what to do. Feel the itch and friction. Then fix it.
But I want to be able to distinguish between work and personal life! List two things.
However, I need to know what should be completed first. Put those items at the top.
However, some things keep coming up, and I need to be reminded of them! Put those in your calendar and make an alarm for them.
But since individual X hasn't completed task Y, I can't proceed with this. Create a Waiting section on your list by dividing it.
But I must know what I'm supposed to be doing right now! Read your list(s). Check your calendar. Think critically.
Before I begin a new one, I remind myself that "Listory Never Repeats."
There’s no such thing as too many lists if all are needed. There is such a thing as too many lists if you make them before they’re needed. Before they complain that their previous room was small or too crowded or needed a new light.
A list that feels too long has a voice; it’s telling you what to do next.
I use one Master List. It's a control panel that tells me what to focus on short-term. If something doesn't need semi-immediate attention, it goes on my Backlog list.
Todd Lewandowski's DWTS (Done, Waiting, Top 3, Soon) performance deserves praise. His DWTS to-do list structure has transformed my plain-text task management. I didn't realize it was upside down.
This is my take on it:
D = Done
Move finished items here. If they pile up, clear them out every week or month. I have a Done Archive folder.
W = Waiting
Things seething in the background, awaiting action. Stir them occasionally so they don't burn.
T = Top 3
Three priorities. Personal comes first, then work. There will always be a top 3 (no more than 5) in every category. Projects, not chores, usually.
S = Soon
This part is action-oriented. It's for anything you can accomplish to finish one of the Top 3. This collection includes thoughts and project lists. The sole requirement is that they should be short-term goals.
Some of you have probably concluded this isn't for you. Please read Todd's piece before throwing out the baby. Often. You shouldn't miss a newborn.
As much as Dancing With The Stars helps me recall this method, I may try switching their order. TSWD; Drilling Tunnel Seismic? Serenity After Task?
Master List Showcase
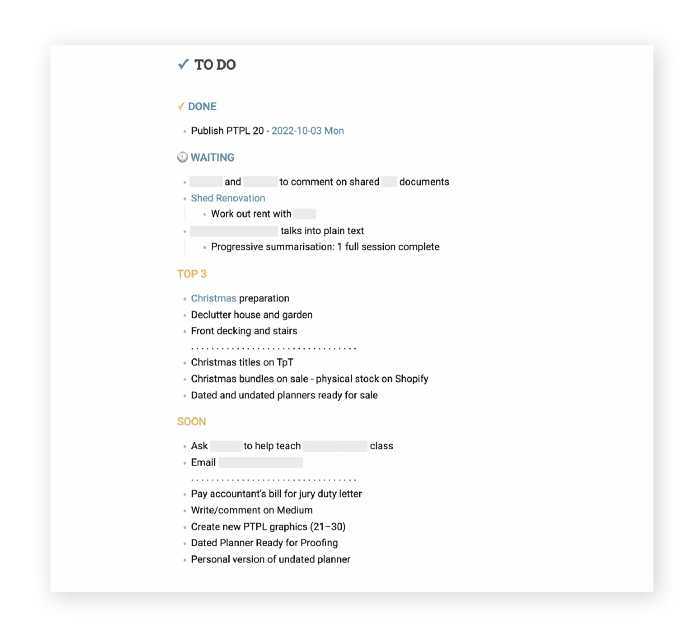
My Master List lives alone in its own file, but sometimes appears in other places. It's included in my Weekly List template. Here's a (soon-to-be-updated) demo vault of my Obsidian planning setup to download for free.
Here's the code behind my weekly screenshot:
## [[Master List - 2022|✓]]  TO DO

![[Master List - 2022]]
FYI, I use the Minimal Theme in Obsidian, with a few tweaks.
You may note I'm utilizing a checkmark as a link. For me, that's easier than locating the proper spot to click on the embed.
Blue headings for Done and Waiting are links. Done links to the Done Archive page and Waiting to a general waiting page.