


More on Productivity

Asher Umerie
3 years ago
What is Bionic Reading?
Senses help us navigate a complicated world. They shape our worldview - how we hear, smell, feel, and taste. People claim a sixth sense, an intuitive capacity that extends perception.
Our brain is a half-pool of grey and white matter that stores data from our senses. Brains provide us context, so zombies' obsession makes sense.
Bionic reading uses the brain's visual information and context to simplify text comprehension.
Stay with me.
What is Bionic Reading?
Bionic reading is a software application established by Swiss typographic designer Renato Casutt. The term honors the brain (bio) and technology's collaboration to better text comprehension.
The image above shows two similar paragraphs with bionic reading.
Notice anything yet?
This Twitter user did.
I did too...
Image text describes bionic reading-
New method to aid reading by using artificial fixation points. The reader focuses on the highlighted starting letters, and the brain completes the word.
How is Bionic Reading possible?
Do you remember seeing social media posts asking you to stare at a black dot for 30 seconds (or more)? You blink and see an after-image on your wall.
Our brains are skilled at identifying patterns and'seeing' familiar objects, therefore optical illusions are conceivable.
Brain and sight collaborate well. Text comprehension proves it.
Considering evolutionary patterns, humans' understanding skills may be cosmic luck.
Scientists don't know why people can read and write, but they do know what reading does to the brain.
One portion of your brain recognizes words, while another analyzes their meaning. Fixation, saccade, and linguistic transparency/opacity aid.
Let's explain some terms.
-
Fixation is how the eyes move when reading. It's where you look. If the eyes fixate less, a reader can read quicker. [Eye fixation is a physiological process](Eye fixation is a naturally occurring physiological process) impacted by the reader's vocabulary, vision span, and text familiarity.
-
Saccade - Pause and look around. That's a saccade. Rapid eye movements that alter the place of fixation, as reading text or looking around a room. They can happen willingly (when you choose) or instinctively, even when your eyes are fixed.
-
Linguistic transparency and opacity analyze how well a composite word or phrase may be deduced from its constituents.
The Bionic reading website compares these tools.
Text highlights lead the eye. Fixation, saccade, and opacity can transfer visual stimuli to text, changing typeface.
## Final Thoughts on Bionic Reading
I'm excited about how this could influence my long-term assimilation and productivity.
This technology is still in development, with prototypes working on only a few apps. Like any new tech, it will be criticized.
I'll be watching Bionic Reading closely. Comment on it!

Jari Roomer
3 years ago
Three Simple Daily Practices That Will Immediately Double Your Output
Most productive people are habitual.
Early in the day, do important tasks.
In his best-selling book Eat That Frog, Brian Tracy advised starting the day with your hardest, most important activity.
Most individuals work best in the morning. Energy and willpower peak then.
Mornings are also ideal for memory, focus, and problem-solving.
Thus, the morning is ideal for your hardest chores.
It makes sense to do these things during your peak performance hours.
Additionally, your morning sets the tone for the day. According to Brian Tracy, the first hour of the workday steers the remainder.
After doing your most critical chores, you may feel accomplished, confident, and motivated for the remainder of the day, which boosts productivity.
Develop Your Essentialism
In Essentialism, Greg McKeown claims that trying to be everything to everyone leads to mediocrity and tiredness.
You'll either burn out, be spread too thin, or compromise your ideals.
Greg McKeown advises Essentialism:
Clarify what’s truly important in your life and eliminate the rest.
Eliminating non-essential duties, activities, and commitments frees up time and energy for what matters most.
According to Greg McKeown, Essentialists live by design, not default.
You'll be happier and more productive if you follow your essentials.
Follow these three steps to live more essentialist.
Prioritize Your Tasks First
What matters most clarifies what matters less. List your most significant aims and values.
The clearer your priorities, the more you can focus on them.
On Essentialism, McKeown wrote, The ultimate form of effectiveness is the ability to deliberately invest our time and energy in the few things that matter most.
#2: Set Your Priorities in Order
Prioritize your priorities, not simply know them.
“If you don’t prioritize your life, someone else will.” — Greg McKeown
Planning each day and allocating enough time for your priorities is the best method to become more purposeful.
#3: Practice saying "no"
If a request or demand conflicts with your aims or principles, you must learn to say no.
Saying no frees up space for our priorities.
Place Sleep Above All Else
Many believe they must forego sleep to be more productive. This is false.
A productive day starts with a good night's sleep.
Matthew Walker (Why We Sleep) says:
“Getting a good night’s sleep can improve cognitive performance, creativity, and overall productivity.”
Sleep helps us learn, remember, and repair.
Unfortunately, 35% of people don't receive the recommended 79 hours of sleep per night.
Sleep deprivation can cause:
increased risk of diabetes, heart disease, stroke, and obesity
Depression, stress, and anxiety risk are all on the rise.
decrease in general contentment
decline in cognitive function
To live an ideal, productive, and healthy life, you must prioritize sleep.
Follow these six sleep optimization strategies to obtain enough sleep:
Establish a nightly ritual to relax and prepare for sleep.
Avoid using screens an hour before bed because the blue light they emit disrupts the generation of melatonin, a necessary hormone for sleep.
Maintain a regular sleep schedule to control your body's biological clock (and optimizes melatonin production)
Create a peaceful, dark, and cool sleeping environment.
Limit your intake of sweets and caffeine (especially in the hours leading up to bedtime)
Regular exercise (but not right before you go to bed, because your body temperature will be too high)
Sleep is one of the best ways to boost productivity.
Sleep is crucial, says Matthew Walker. It's the key to good health and longevity.

Niharikaa Kaur Sodhi
3 years ago
The Only Paid Resources I Turn to as a Solopreneur
4 Pricey Tools That Are Valuable
I pay based on ROI (return on investment).
If a $20/month tool or $500 online course doubles my return, I'm in.
Investing helps me build wealth.
Canva Pro
I initially refused to pay.
My course content needed updating a few months ago. My Google Docs text looked cleaner and more professional in Canva.
I've used it to:
product cover pages
eBook covers
Product page infographics
See my Google Sheets vs. Canva product page graph.
Google Sheets vs Canva
Yesterday, I used it to make a LinkedIn video thumbnail. It took less than 5 minutes and improved my video.
In 30 hours, the video had 39,000 views.
Here's more.
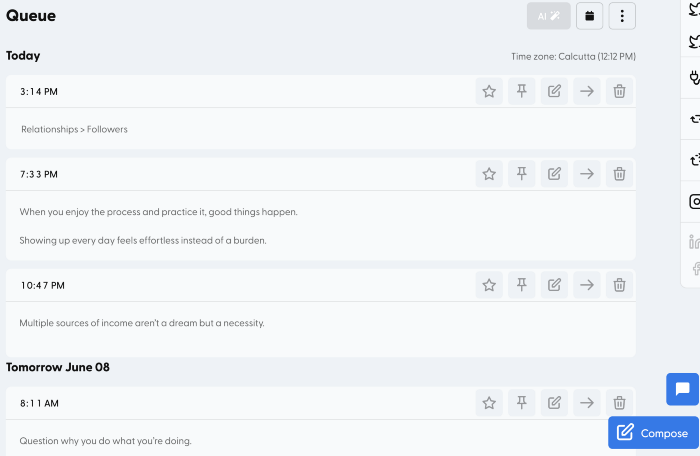
HypeFury
Hypefury rocks!
It builds my brand as I sleep. What else?
Because I'm traveling this weekend, I planned tweets for 10 days. It took me 80 minutes.
So while I travel or am absent, my content mill keeps producing.
Also I like:
I can reach hundreds of people thanks to auto-DMs. I utilize it to advertise freebies; for instance, leave an emoji remark to receive my checklist. And they automatically receive a message in their DM.
Scheduled Retweets: By appearing in a different time zone, they give my tweet a second chance.
It helps me save time and expand my following, so that's my favorite part.
It’s also super neat:
Zoom Pro
My course involves weekly and monthly calls for alumni.
Google Meet isn't great for group calls. The interface isn't great.
Zoom Pro is expensive, and the monthly payments suck, but it's necessary.
It gives my students a smooth experience.
Previously, we'd do 40-minute meetings and then reconvene.
Zoom's free edition limits group calls to 40 minutes.
This wouldn't be a good online course if I paid hundreds of dollars.
So I felt obligated to help.
YouTube Premium
My laptop has an ad blocker.
I bought an iPad recently.
When you're self-employed and work from home, the line between the two blurs. My bed is only 5 steps away!
When I read or watched videos on my laptop, I'd slide into work mode. Only option was to view on phone, which is awkward.
YouTube premium handles it. No more advertisements and I can listen on the move.
3 Expensive Tools That Aren't Valuable
Marketing strategies are sometimes aimed to make you feel you need 38474 cool features when you don’t.
Certain tools are useless.
I found it useless.
Depending on your needs. As a writer and creator, I get no return.
They could for other jobs.
Shield Analytics
It tracks LinkedIn stats, like:
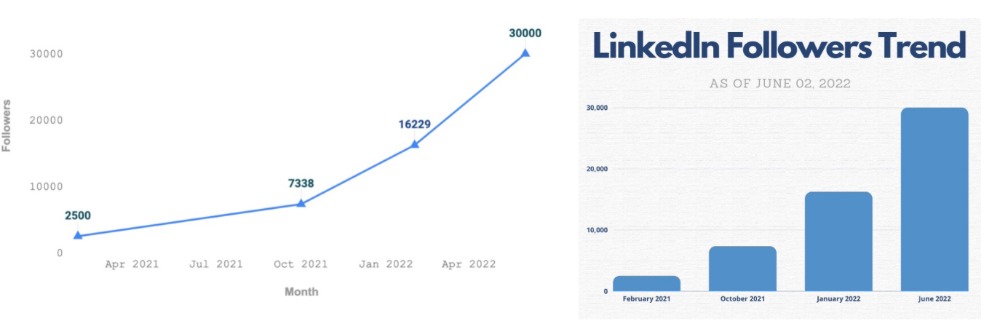
follower growth
trend chart for impressions
Engagement, views, and comment stats for posts
and much more.
Middle-tier creator costs $12/month.
I got a 25% off coupon but canceled my free trial before writing this. It's not worth the discount.
Why?
LinkedIn provides free analytics. See:
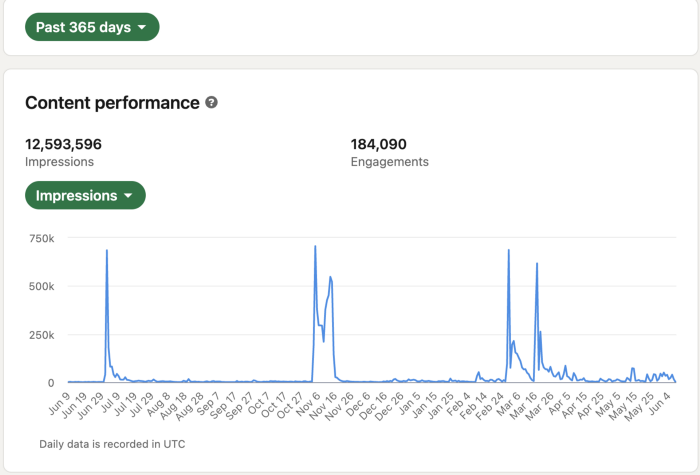
Not thorough and won't show top posts.
I don't need to see my top posts because I love experimenting with writing.
Slack Premium
Slack was my classroom. Slack provided me a premium trial during the prior cohort.
I skipped it.
Sure, voice notes are better than a big paragraph. I didn't require pro features.
Marketing methods sometimes make you think you need 38474 amazing features. Don’t fall for it.
Calendly Pro
This may be worth it if you get many calls.
I avoid calls. During my 9-5, I had too many pointless calls.
I don't need:
ability to schedule calls for 15, 30, or 60 minutes: I just distribute each link separately.
I have a Gumroad consultation page with a payment option.
follow-up emails: I hardly ever make calls, so
I just use one calendar, therefore I link to various calendars.
I'll admit, the integrations are cool. Not for me.
If you're a coach or consultant, the features may be helpful. Or book meetings.
Conclusion
Investing is spending to make money.
Use my technique — put money in tools that help you make money. This separates it from being an investment instead of an expense.
Try free versions of these tools before buying them since everyone else is.
You might also like

Yusuf Ibrahim
4 years ago
How to sell 10,000 NFTs on OpenSea for FREE (Puppeteer/NodeJS)
So you've finished your NFT collection and are ready to sell it. Except you can't figure out how to mint them! Not sure about smart contracts or want to avoid rising gas prices. You've tried and failed with apps like Mini mouse macro, and you're not familiar with Selenium/Python. Worry no more, NodeJS and Puppeteer have arrived!
Learn how to automatically post and sell all 1000 of my AI-generated word NFTs (Nakahana) on OpenSea for FREE!
My NFT project — Nakahana |
NOTE: Only NFTs on the Polygon blockchain can be sold for free; Ethereum requires an initiation charge. NFTs can still be bought with (wrapped) ETH.
If you want to go right into the code, here's the GitHub link: https://github.com/Yusu-f/nftuploader
Let's start with the knowledge and tools you'll need.
What you should know
You must be able to write and run simple NodeJS programs. You must also know how to utilize a Metamask wallet.
Tools needed
- NodeJS. You'll need NodeJs to run the script and NPM to install the dependencies.
- Puppeteer – Use Puppeteer to automate your browser and go to sleep while your computer works.
- Metamask – Create a crypto wallet and sign transactions using Metamask (free). You may learn how to utilize Metamask here.
- Chrome – Puppeteer supports Chrome.
Let's get started now!
Starting Out
Clone Github Repo to your local machine. Make sure that NodeJS, Chrome, and Metamask are all installed and working. Navigate to the project folder and execute npm install. This installs all requirements.
Replace the “extension path” variable with the Metamask chrome extension path. Read this tutorial to find the path.
Substitute an array containing your NFT names and metadata for the “arr” variable and the “collection_name” variable with your collection’s name.
Run the script.
After that, run node nftuploader.js.
Open a new chrome instance (not chromium) and Metamask in it. Import your Opensea wallet using your Secret Recovery Phrase or create a new one and link it. The script will be unable to continue after this but don’t worry, it’s all part of the plan.
Next steps
Open your terminal again and copy the route that starts with “ws”, e.g. “ws:/localhost:53634/devtools/browser/c07cb303-c84d-430d-af06-dd599cf2a94f”. Replace the path in the connect function of the nftuploader.js script.
const browser = await puppeteer.connect({ browserWSEndpoint: "ws://localhost:58533/devtools/browser/d09307b4-7a75-40f6-8dff-07a71bfff9b3", defaultViewport: null });
Rerun node nftuploader.js. A second tab should open in THE SAME chrome instance, navigating to your Opensea collection. Your NFTs should now start uploading one after the other! If any errors occur, the NFTs and errors are logged in an errors.log file.
Error Handling
The errors.log file should show the name of the NFTs and the error type. The script has been changed to allow you to simply check if an NFT has already been posted. Simply set the “searchBeforeUpload” setting to true.
We're done!
If you liked it, you can buy one of my NFTs! If you have any concerns or would need a feature added, please let me know.
Thank you to everyone who has read and liked. I never expected it to be so popular.

Scott Galloway
3 years ago
Don't underestimate the foolish
ZERO GRACE/ZERO MALICE
Big companies and wealthy people make stupid mistakes too.
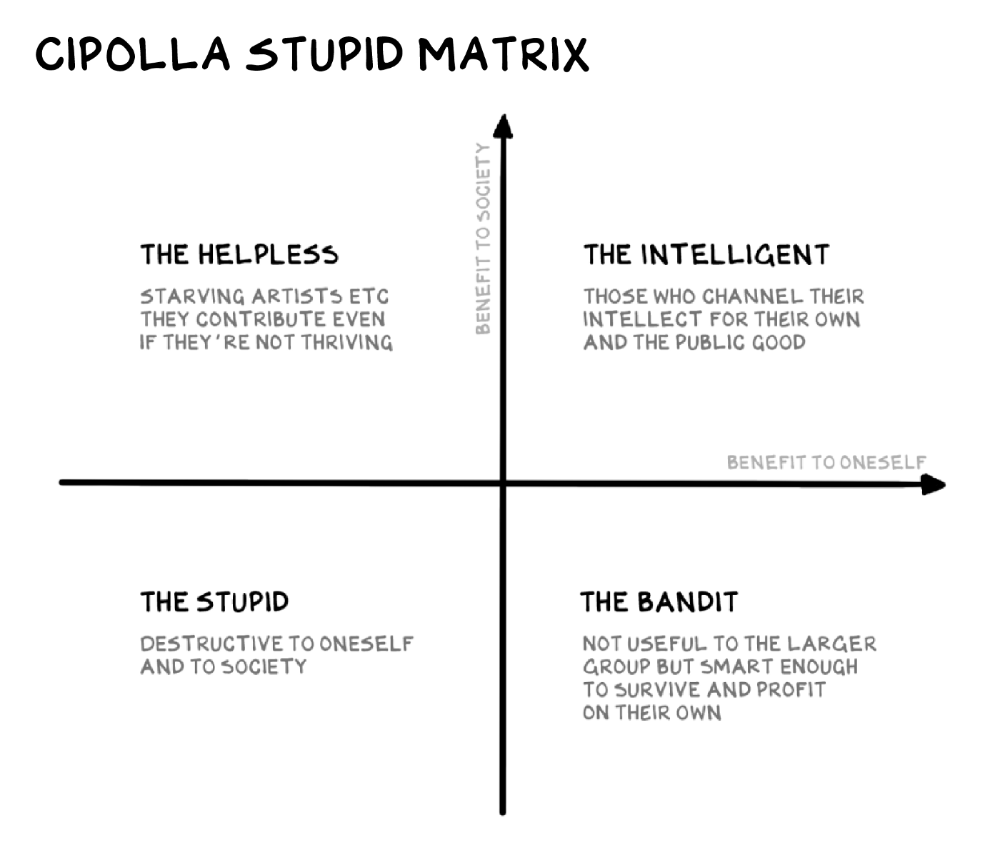
Your ancestors kept snakes and drank bad water. You (probably) don't because you've learnt from their failures via instinct+, the ultimate life-lessons streaming network in your head. Instincts foretell the future. If you approach a lion, it'll eat you. Our society's nuanced/complex decisions have surpassed instinct. Human growth depends on how we handle these issues. 80% of people believe they are above-average drivers, yet few believe they make many incorrect mistakes that make them risky. Stupidity hurts others like death. Basic Laws of Human Stupidity by Carlo Cipollas:
Everyone underestimates the prevalence of idiots in our society.
Any other trait a person may have has no bearing on how likely they are to be stupid.
A dumb individual is one who harms someone without benefiting themselves and may even lose money in the process.
Non-dumb people frequently underestimate how destructively powerful stupid people can be.
The most dangerous kind of person is a moron.
Professor Cippola defines stupid as bad for you and others. We underestimate the corporate world's and seemingly successful people's ability to make bad judgments that harm themselves and others. Success is an intoxication that makes you risk-aggressive and blurs your peripheral vision.
Stupid companies and decisions:
Big Dumber
Big-company bad ideas have more bulk and inertia. The world's most valuable company recently showed its board a VR headset. Jony Ive couldn't destroy Apple's terrible idea in 2015. Mr. Ive said that VR cut users off from the outer world, made them seem outdated, and lacked practical uses. Ives' design team doubted users would wear headsets for lengthy periods.
VR has cost tens of billions of dollars over a decade to prove nobody wants it. The next great SaaS startup will likely come from Florence, not Redmond or San Jose.
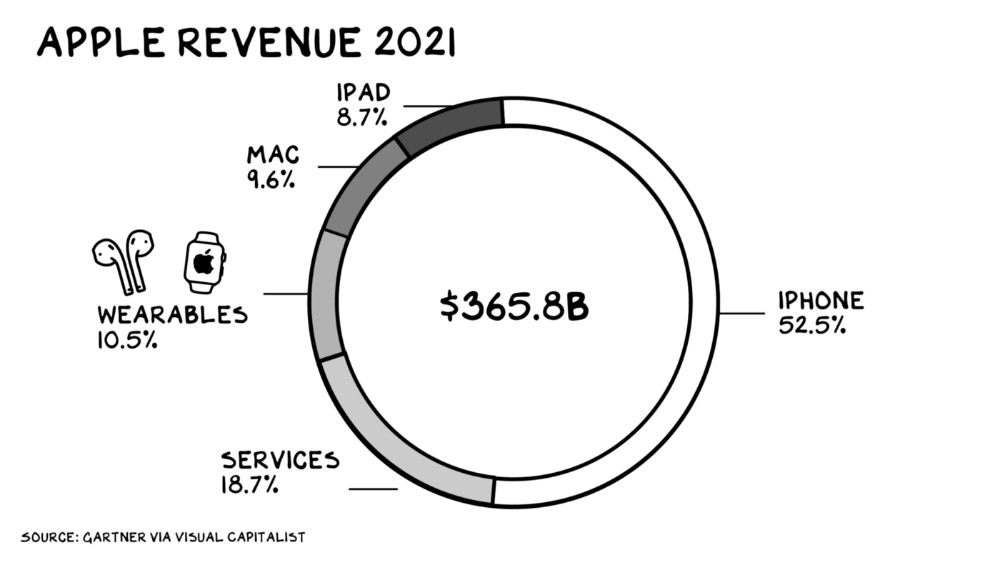
Apple Watch and Airpods have made the Cupertino company the world's largest jewelry maker. 10.5% of Apple's income, or $38 billion, comes from wearables in 2021. (seven times the revenue of Tiffany & Co.). Jewelry makes you more appealing and useful. Airpods and Apple Watch do both.
Headsets make you less beautiful and useful and promote isolation, loneliness, and unhappiness among American teenagers. My sons pretend they can't hear or see me when on their phones. VR headsets lack charisma.
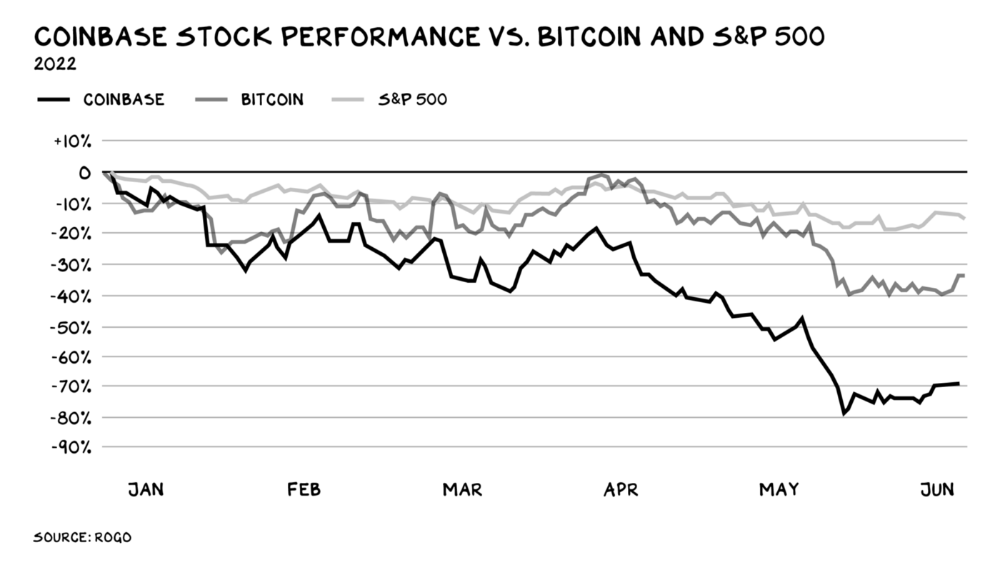
Coinbase disclosed a plan to generate division and tension within its workplace weeks after Apple was pitched $2,000 smokes. The crypto-trading platform is piloting a program that rates staff after every interaction. If a coworker says anything you don't like, you should tell them how to improve. Everyone gets a 110-point scorecard. Coworkers should evaluate a person's rating while deciding whether to listen to them. It's ridiculous.
Organizations leverage our superpower of cooperation. This encourages non-cooperation, period. Bridgewater's founder Ray Dalio designed the approach to promote extreme transparency. Dalio has 223 billion reasons his managerial style works. There's reason to suppose only a small group of people, largely traders, will endure a granular scorecard. Bridgewater has 20% first-year turnover. Employees cry in bathrooms, and sex scandals are settled by ignoring individuals with poor believability levels. Coinbase might take solace that the stock is 80% below its initial offering price.
Poor Stupid
Fools' ledgers are valuable. More valuable are lists of foolish rich individuals.
Robinhood built a $8 billion corporation on financial ignorance. The firm's median account value is $240, and its stock has dropped 75% since last summer. Investors, customers, and society lose. Stupid. Luna published a comparable list on the blockchain, grew to $41 billion in market cap, then plummeted.
A podcast presenter is recruiting dentists and small-business owners to invest in Elon Musk's Twitter takeover. Investors pay a 7% fee and 10% of the upside for the chance to buy Twitter at a 35% premium to the current price. The proposal legitimizes CNBC's Trade Like Chuck advertising (Chuck made $4,600 into $460,000 in two years). This is stupid because it adds to the Twitter deal's desperation. Mr. Musk made an impression when he urged his lawyers to develop a legal rip-cord (There are bots on the platform!) to abandon the share purchase arrangement (for less than they are being marketed by the podcaster). Rolls-Royce may pay for this list of the dumb affluent because it includes potential Cullinan buyers.
Worst company? Flowcarbon, founded by WeWork founder Adam Neumann, operates at the convergence of carbon and crypto to democratize access to offsets and safeguard the earth's natural carbon sinks. Can I get an ayahuasca Big Gulp?
Neumann raised $70 million with their yogababble drink. More than half of the consideration came from selling GNT. Goddess Nature Token. I hope the company gets an S-1. Or I'll start a decentralized AI Meta Renewable NFTs company. My Community Based Ebitda coin will fund the company. Possible.
Stupidity inside oneself
This weekend, I was in NYC with my boys. My 14-year-old disappeared. He's realized I'm not cool and is mad I let the charade continue. When out with his dad, he likes to stroll home alone and depart before me. Friends told me hell would return, but I was surprised by how fast the eye roll came.
Not so with my 11-year-old. We went to The Edge, a Hudson Yards observation platform where you can see the city from 100 storeys up for $38. This is hell's seventh ring. Leaning into your boys' interests is key to engaging them (dad tip). Neither loves Crossfit, WW2 history, or antitrust law.
We take selfies on the Thrilling Glass Floor he spots. Dad, there's a bar! Coke? I nod, he rushes to the bar, stops, runs back for money, and sprints back. Sitting on stone seats, drinking Atlanta Champagne, he turns at me and asks, Isn't this amazing? I'll never reach paradise.
Later that night, the lads are asleep and I've had two Zacapas and Cokes. I SMS some friends about my day and how I feel about sons/fatherhood/etc. How I did. They responded and approached. The next morning, I'm sober, have distance from my son, and feel ashamed by my texts. Less likely to impulsively share my emotions with others. Stupid again.

Glorin Santhosh
3 years ago
In his final days, Steve Jobs sent an email to himself. What It Said Was This
An email capturing Steve Jobs's philosophy.
Steve Jobs may have been the most inspired and driven entrepreneur.
He worked on projects because he wanted to leave a legacy.
Steve Jobs' final email to himself encapsulated his philosophy.
After his death from pancreatic cancer in October 2011, Laurene Powell Jobs released the email. He was 56.
Read: Steve Jobs by Walter Isaacson (#BestSeller)
The Email:
September 2010 Steve Jobs email:
“I grow little of the food I eat, and of the little I do grow, I do not breed or perfect the seeds.” “I do not make my own clothing. I speak a language I did not invent or refine,” he continued. “I did not discover the mathematics I use… I am moved by music I did not create myself.”
Jobs ended his email by reflecting on how others created everything he uses.
He wrote:
“When I needed medical attention, I was helpless to help myself survive.”
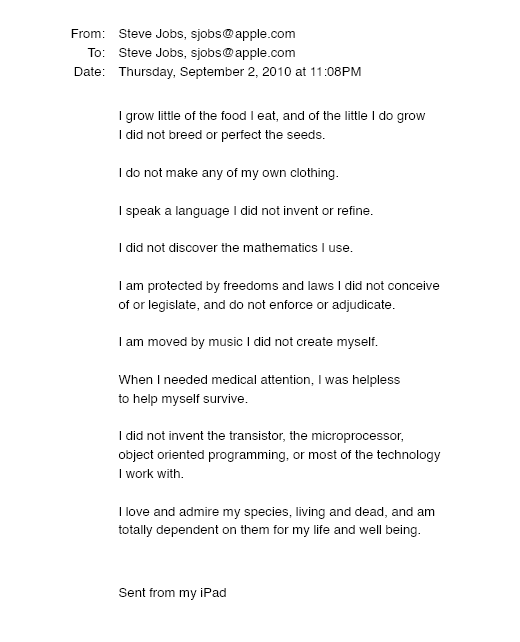
The Apple co-founder concluded by praising humanity.
“I did not invent the transistor, the microprocessor, object-oriented programming, or most of the technology I work with. I love and admire my species, living and dead, and am totally dependent on them for my life and well-being,” he concluded.
The email was made public as a part of the Steve Jobs Archive, a website that was launched in tribute to his legacy.
Steve Jobs' widow founded the internet archive. Apple CEO Tim Cook and former design leader Jony Ive were prominent guests.
Steve Jobs has always inspired because he shows how even the best can be improved.
High expectations were always there, and they were consistently met.
We miss him because he was one of the few with lifelong enthusiasm and persona.