


More on Web3 & Crypto

Vitalik
4 years ago
An approximate introduction to how zk-SNARKs are possible (part 1)
You can make a proof for the statement "I know a secret number such that if you take the word ‘cow', add the number to the end, and SHA256 hash it 100 million times, the output starts with 0x57d00485aa". The verifier can verify the proof far more quickly than it would take for them to run 100 million hashes themselves, and the proof would also not reveal what the secret number is.
In the context of blockchains, this has 2 very powerful applications: Perhaps the most powerful cryptographic technology to come out of the last decade is general-purpose succinct zero knowledge proofs, usually called zk-SNARKs ("zero knowledge succinct arguments of knowledge"). A zk-SNARK allows you to generate a proof that some computation has some particular output, in such a way that the proof can be verified extremely quickly even if the underlying computation takes a very long time to run. The "ZK" part adds an additional feature: the proof can keep some of the inputs to the computation hidden.
You can make a proof for the statement "I know a secret number such that if you take the word ‘cow', add the number to the end, and SHA256 hash it 100 million times, the output starts with 0x57d00485aa". The verifier can verify the proof far more quickly than it would take for them to run 100 million hashes themselves, and the proof would also not reveal what the secret number is.
In the context of blockchains, this has two very powerful applications:
- Scalability: if a block takes a long time to verify, one person can verify it and generate a proof, and everyone else can just quickly verify the proof instead
- Privacy: you can prove that you have the right to transfer some asset (you received it, and you didn't already transfer it) without revealing the link to which asset you received. This ensures security without unduly leaking information about who is transacting with whom to the public.
But zk-SNARKs are quite complex; indeed, as recently as in 2014-17 they were still frequently called "moon math". The good news is that since then, the protocols have become simpler and our understanding of them has become much better. This post will try to explain how ZK-SNARKs work, in a way that should be understandable to someone with a medium level of understanding of mathematics.
Why ZK-SNARKs "should" be hard
Let us take the example that we started with: we have a number (we can encode "cow" followed by the secret input as an integer), we take the SHA256 hash of that number, then we do that again another 99,999,999 times, we get the output, and we check what its starting digits are. This is a huge computation.
A "succinct" proof is one where both the size of the proof and the time required to verify it grow much more slowly than the computation to be verified. If we want a "succinct" proof, we cannot require the verifier to do some work per round of hashing (because then the verification time would be proportional to the computation). Instead, the verifier must somehow check the whole computation without peeking into each individual piece of the computation.
One natural technique is random sampling: how about we just have the verifier peek into the computation in 500 different places, check that those parts are correct, and if all 500 checks pass then assume that the rest of the computation must with high probability be fine, too?
Such a procedure could even be turned into a non-interactive proof using the Fiat-Shamir heuristic: the prover computes a Merkle root of the computation, uses the Merkle root to pseudorandomly choose 500 indices, and provides the 500 corresponding Merkle branches of the data. The key idea is that the prover does not know which branches they will need to reveal until they have already "committed to" the data. If a malicious prover tries to fudge the data after learning which indices are going to be checked, that would change the Merkle root, which would result in a new set of random indices, which would require fudging the data again... trapping the malicious prover in an endless cycle.
But unfortunately there is a fatal flaw in naively applying random sampling to spot-check a computation in this way: computation is inherently fragile. If a malicious prover flips one bit somewhere in the middle of a computation, they can make it give a completely different result, and a random sampling verifier would almost never find out.
It only takes one deliberately inserted error, that a random check would almost never catch, to make a computation give a completely incorrect result.
If tasked with the problem of coming up with a zk-SNARK protocol, many people would make their way to this point and then get stuck and give up. How can a verifier possibly check every single piece of the computation, without looking at each piece of the computation individually? There is a clever solution.
see part 2
David Z. Morris
3 years ago
FTX's crash was no accident, it was a crime

Sam Bankman Fried (SDBF) is a legendary con man. But the NYT might not tell you that...
Since SBF's empire was revealed to be a lie, mainstream news organizations and commentators have failed to give readers a straightforward assessment. The New York Times and Wall Street Journal have uncovered many key facts about the scandal, but they have also soft-peddled Bankman-Fried's intent and culpability.
It's clear that the FTX crypto exchange and Alameda Research committed fraud to steal money from users and investors. That’s why a recent New York Times interview was widely derided for seeming to frame FTX’s collapse as the result of mismanagement rather than malfeasance. A Wall Street Journal article lamented FTX's loss of charitable donations, bolstering Bankman's philanthropic pose. Matthew Yglesias, court chronicler of the neoliberal status quo, seemed to whitewash his own entanglements by crediting SBF's money with helping Democrats in 2020 – sidestepping the likelihood that the money was embezzled.
Many outlets have called what happened to FTX a "bank run" or a "run on deposits," but Bankman-Fried insists the company was overleveraged and disorganized. Both attempts to frame the fallout obscure the core issue: customer funds misused.
Because banks lend customer funds to generate returns, they can experience "bank runs." If everyone withdraws at once, they can experience a short-term cash crunch but there won't be a long-term problem.
Crypto exchanges like FTX aren't banks. They don't do bank-style lending, so a withdrawal surge shouldn't strain liquidity. FTX promised customers it wouldn't lend or use their crypto.
Alameda's balance sheet blurs SBF's crypto empire.
The funds were sent to Alameda Research, where they were apparently gambled away. This is massive theft. According to a bankruptcy document, up to 1 million customers could be affected.
In less than a month, reporting and the bankruptcy process have uncovered a laundry list of decisions and practices that would constitute financial fraud if FTX had been a U.S.-regulated entity, even without crypto-specific rules. These ploys may be litigated in U.S. courts if they enabled the theft of American property.
The list is very, very long.
The many crimes of Sam Bankman-Fried and FTX
At the heart of SBF's fraud are the deep and (literally) intimate ties between FTX and Alameda Research, a hedge fund he co-founded. An exchange makes money from transaction fees on user assets, but Alameda trades and invests its own funds.
Bankman-Fried called FTX and Alameda "wholly separate" and resigned as Alameda's CEO in 2019. The two operations were closely linked. Bankman-Fried and Alameda CEO Caroline Ellison were romantically linked.
These circumstances enabled SBF's sin. Within days of FTX's first signs of weakness, it was clear the exchange was funneling customer assets to Alameda for trading, lending, and investing. Reuters reported on Nov. 12 that FTX sent $10 billion to Alameda. As much as $2 billion was believed to have disappeared after being sent to Alameda. Now the losses look worse.
It's unclear why those funds were sent to Alameda or when Bankman-Fried betrayed his depositors. On-chain analysis shows most FTX to Alameda transfers occurred in late 2021, and bankruptcy filings show both lost $3.7 billion in 2021.
SBF's companies lost millions before the 2022 crypto bear market. They may have stolen funds before Terra and Three Arrows Capital, which killed many leveraged crypto players.
FTT loans and prints
CoinDesk's report on Alameda's FTT holdings ignited FTX and Alameda Research. FTX created this instrument, but only a small portion was traded publicly; FTX and Alameda held the rest. These holdings were illiquid, meaning they couldn't be sold at market price. Bankman-Fried valued its stock at the fictitious price.
FTT tokens were reportedly used as collateral for loans, including FTX loans to Alameda. Close ties between FTX and Alameda made the FTT token harder or more expensive to use as collateral, reducing the risk to customer funds.
This use of an internal asset as collateral for loans between clandestinely related entities is similar to Enron's 1990s accounting fraud. These executives served 12 years in prison.
Alameda's margin liquidation exemption
Alameda Research had a "secret exemption" from FTX's liquidation and margin trading rules, according to legal filings by FTX's new CEO.
FTX, like other crypto platforms and some equity or commodity services, offered "margin" or loans for trades. These loans are usually collateralized, meaning borrowers put up other funds or assets. If a margin trade loses enough money, the exchange will sell the user's collateral to pay off the initial loan.
Keeping asset markets solvent requires liquidating bad margin positions. Exempting Alameda would give it huge advantages while exposing other FTX users to hidden risks. Alameda could have kept losing positions open while closing out competitors. Alameda could lose more on FTX than it could pay back, leaving a hole in customer funds.
The exemption is criminal in multiple ways. FTX was fraudulently marketed overall. Instead of a level playing field, there were many customers.
Above them all, with shotgun poised, was Alameda Research.
Alameda front-running FTX listings
Argus says there's circumstantial evidence that Alameda Research had insider knowledge of FTX's token listing plans. Alameda was able to buy large amounts of tokens before the listing and sell them after the price bump.
If true, these claims would be the most brazenly illegal of Alameda and FTX's alleged shenanigans. Even if the tokens aren't formally classified as securities, insider trading laws may apply.
In a similar case this year, an OpenSea employee was charged with wire fraud for allegedly insider trading. This employee faces 20 years in prison for front-running monkey JPEGs.
Huge loans to executives
Alameda Research reportedly lent FTX executives $4.1 billion, including massive personal loans. Bankman-Fried received $1 billion in personal loans and $2.3 billion for an entity he controlled, Paper Bird. Nishad Singh, director of engineering, was given $543 million, and FTX Digital Markets co-CEO Ryan Salame received $55 million.
FTX has more smoking guns than a Texas shooting range, but this one is the smoking bazooka – a sign of criminal intent. It's unclear how most of the personal loans were used, but liquidators will have to recoup the money.
The loans to Paper Bird were even more worrisome because they created another related third party to shuffle assets. Forbes speculates that some Paper Bird funds went to buy Binance's FTX stake, and Paper Bird committed hundreds of millions to outside investments.
FTX Inner Circle: Who's Who
That included many FTX-backed VC funds. Time will tell if this financial incest was criminal fraud. It fits Bankman-pattern Fried's of using secret flows, leverage, and funny money to inflate asset prices.
FTT or loan 'bailouts'
Also. As the crypto bear market continued in 2022, Bankman-Fried proposed bailouts for bankrupt crypto lenders BlockFi and Voyager Digital. CoinDesk was among those deceived, welcoming SBF as a J.P. Morgan-style sector backstop.
In a now-infamous interview with CNBC's "Squawk Box," Bankman-Fried referred to these decisions as bets that may or may not pay off.
But maybe not. Bloomberg's Matt Levine speculated that FTX backed BlockFi with FTT money. This Monopoly bailout may have been intended to hide FTX and Alameda liabilities that would have been exposed if BlockFi went bankrupt sooner. This ploy has no name, but it echoes other corporate frauds.
Secret bank purchase
Alameda Research invested $11.5 million in the tiny Farmington State Bank, doubling its net worth. As a non-U.S. entity and an investment firm, Alameda should have cleared regulatory hurdles before acquiring a U.S. bank.
In the context of FTX, the bank's stake becomes "ominous." Alameda and FTX could have done more shenanigans with bank control. Compare this to the Bank for Credit and Commerce International's failed attempts to buy U.S. banks. BCCI was even nefarious than FTX and wanted to buy U.S. banks to expand its money-laundering empire.
The mainstream's mistakes
These are complex and nuanced forms of fraud that echo traditional finance models. This obscurity helped Bankman-Fried masquerade as an honest player and likely kept coverage soft after the collapse.
Bankman-Fried had a scruffy, nerdy image, like Mark Zuckerberg and Adam Neumann. In interviews, he spoke nonsense about an industry full of jargon and complicated tech. Strategic donations and insincere ideological statements helped him gain political and social influence.
SBF' s'Effective' Altruism Blew Up FTX
Bankman-Fried has continued to muddy the waters with disingenuous letters, statements, interviews, and tweets since his con collapsed. He's tried to portray himself as a well-intentioned but naive kid who made some mistakes. This is a softer, more pernicious version of what Trump learned from mob lawyer Roy Cohn. Bankman-Fried doesn't "deny, deny, deny" but "confuse, evade, distort."
It's mostly worked. Kevin O'Leary, who plays an investor on "Shark Tank," repeats Bankman-SBF's counterfactuals. O'Leary called Bankman-Fried a "savant" and "probably one of the most accomplished crypto traders in the world" in a Nov. 27 interview with Business Insider, despite recent data indicating immense trading losses even when times were good.
O'Leary's status as an FTX investor and former paid spokesperson explains his continued affection for Bankman-Fried despite contradictory evidence. He's not the only one promoting Bankman-Fried. The disgraced son of two Stanford law professors will defend himself at Wednesday's DealBook Summit.
SBF's fraud and theft rival those of Bernie Madoff and Jho Low. Whether intentionally or through malign ineptitude, the fraud echoes Worldcom and Enron.
The Perverse Impacts of Anti-Money-Laundering
The principals in all of those scandals wound up either sentenced to prison or on the run from the law. Sam Bankman-Fried clearly deserves to share their fate.
Read the full article here.

Dylan Smyth
4 years ago
10 Ways to Make Money Online in 2022
As a tech-savvy person (and software engineer) or just a casual technology user, I'm sure you've had this same question countless times: How do I make money online? and how do I make money with my PC/Mac?
You're in luck! Today, I will list the top 5 easiest ways to make money online. Maybe a top ten in the future? Top 5 tips for 2022.
1. Using the gig economy
There are many websites on the internet that allow you to earn extra money using skills and equipment that you already own.
I'm referring to the gig economy. It's a great way to earn a steady passive income from the comfort of your own home. For some sites, premium subscriptions are available to increase sales and access features like bidding on more proposals.
Some of these are:
- Freelancer
- Upwork
- Fiverr (⭐ my personal favorite)
- TaskRabbit
2. Mineprize
MINEPRIZE is a great way to make money online. What's more, You need not do anything! You earn money by lending your idle CPU power to MINEPRIZE.
To register with MINEPRIZE, all you need is an email address and a password. Let MINEPRIZE use your resources, and watch the money roll in! You can earn up to $100 per month by letting your computer calculate. That's insane.
3. Writing
“O Romeo, Romeo, why art thou Romeo?” Okay, I admit that not all writing is Shakespearean. To be a copywriter, you'll need to be fluent in English. Thankfully, we don't have to use typewriters anymore.
Writing is a skill that can earn you a lot of money (claps for the rhyme).
Here are a few ways you can make money typing on your fancy keyboard:
Self-publish a book
Write scripts for video creators
Write for social media
Book-checking
Content marketing help
What a list within a list!
4. Coding
Yes, kids. You've probably coded before if you understand
You've probably coded before if you understand
print("hello world");
Computational thinking (or coding) is one of the most lucrative ways to earn extra money, or even as a main source of income.
Of course, there are hardcode coders (like me) who write everything line by line, binary di — okay, that last part is a bit exaggerated.
But you can also make money by writing websites or apps or creating low code or no code platforms.
But you can also make money by writing websites or apps or creating low code or no code platforms.
Some low-code platforms
Sheet : spreadsheets to apps :
Loading... We'll install your new app... No-Code Your team can create apps and automate tasks. Agile…
www.appsheet.com
Low-code platform | Business app creator - Zoho Creator
Work is going digital, and businesses of all sizes must adapt quickly. Zoho Creator is a...
www.zoho.com
Sell your data with TrueSource. NO CODE NEEDED
Upload data, configure your product, and earn in minutes.
www.truesource.io
Cool, huh?
5. Created Content
If we use the internet correctly, we can gain unfathomable wealth and extra money. But this one is a bit more difficult. Unlike some of the other items on this list, it takes a lot of time up front.
I'm referring to sites like YouTube and Medium. It's a great way to earn money both passively and actively. With the likes of Jake- and Logan Paul, PewDiePie (a.k.a. Felix Kjellberg) and others, it's never too late to become a millionaire on YouTube. YouTubers are always rising to the top with great content.
6. NFTs and Cryptocurrency
It is now possible to amass large sums of money by buying and selling digital assets on NFTs and cryptocurrency exchanges. Binance's Initial Game Offer rewards early investors who produce the best results.
One awesome game sold a piece of its plot for US$7.2 million! It's Axie Infinity. It's free and available on Google Play and Apple Store.
7. Affiliate Marketing
Affiliate marketing is a form of advertising where businesses pay others (like bloggers) to promote their goods and services. Here's an example. I write a blog (like this one) and post an affiliate link to an item I recommend buying — say, a camera — and if you buy the camera, I get a commission!
These programs pay well:
- Elementor
- AWeber
- Sendinblue
- ConvertKit\sLeadpages
- GetResponse
- SEMRush\sFiverr
- Pabbly
8. Start a blog
Now, if you're a writer or just really passionate about something or a niche, blogging could potentially monetize that passion!
Create a blog about anything you can think of. It's okay to start right here on Medium, as I did.
9. Dropshipping
And I mean that in the best possible way — drop shopping is ridiculously easy to set up, but difficult to maintain for some.
Luckily, Shopify has made setting up an online store a breeze. Drop-shipping from Alibaba and DHGate is quite common. You've got a winner if you can find a local distributor willing to let you drop ship their product!
10. Set up an Online Course
If you have a skill and can articulate it, online education is for you.
Skillshare, Pluralsight, and Coursera have all made inroads in recent years, upskilling people with courses that YOU can create and earn from.
That's it for today! Please share if you liked this post. If not, well —
You might also like

Alana Rister, Ph.D.
3 years ago
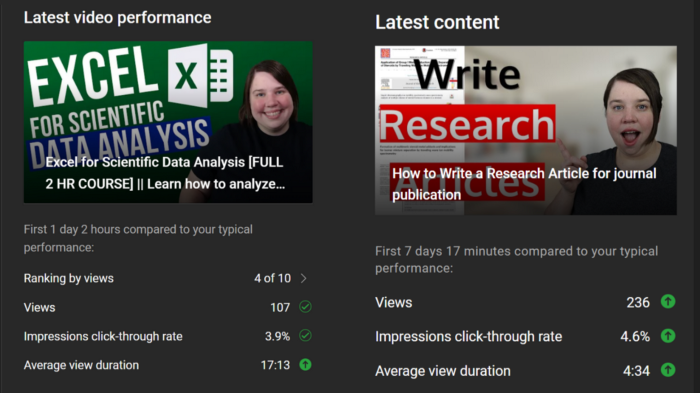
Don't rely on lessons you learned with a small audience.
My growth-killing mistake

When you initially start developing your audience, you need guidance.
What does my audience like? What do they not like? How can I grow more?
When I started writing two years ago, I inquired daily. Taking cues from your audience to develop more valuable content is a good concept, but it's simple to let them destroy your growth.
A small audience doesn't represent the full picture.
When I had fewer than 100 YouTube subscribers, I tried several video styles and topics. I looked to my audience for what to preserve and what to change.
If my views, click-through rate, or average view % dropped, that topic or style was awful. Avoiding that style helped me grow.
Vlogs, talking head videos on writing, and long-form tutorials didn't fare well.
Since I was small, I've limited the types of films I make. I have decided to make my own videos.
Surprisingly, the videos I avoided making meet or exceed my views, CTR, and audience retention.
A limited audience can't tell you what your tribe wants. Therefore, limiting your innovation will prohibit you from reaching the right audience. Finding them may take longer.
Large Creators Experience The Same Issue
In the last two years, I've heard Vanessa Lau and Cathrin Manning say they felt pigeonholed into generating videos they didn't want to do.
Why does this happen over and over again?
Once you have a popular piece of content, your audience will grow. So when you publish inconsistent material, fewer of your new audience will view it. You interpret the drop in views as a sign that your audience doesn't want the content, so you stop making it.
Repeat this procedure a few times, and you'll create stuff you're not passionate about because you're frightened to publish it.
How to Manage Your Creativity and Audience Development
I'm not recommending you generate random content.
Instead of feeling trapped by your audience, you can cultivate a diverse audience.
Create quality material on a range of topics and styles as you improve. Be creative until you get 100 followers. Look for comments on how to improve your article.
If you observe trends in the types of content that expand your audience, focus 50-75% of your material on those trends. Allow yourself to develop 25% non-performing material.
This method can help you expand your audience faster with your primary trends and like all your stuff. Slowly, people will find 25% of your material, which will boost its performance.
How to Expand Your Audience Without Having More Limited Content
Follow these techniques to build your audience without feeling confined.
Don't think that you need restrict yourself to what your limited audience prefers.
Don't let the poor performance of your desired material demotivate you.
You shouldn't restrict the type of content you publish or the themes you cover when you have less than 100 followers.
When your audience expands, save 25% of your content for your personal interests, regardless of how well it does.

Alex Mathers
3 years ago
400 articles later, nobody bothered to read them.
Writing for readers:
14 years of daily writing.
I post practically everything on social media. I authored hundreds of articles, thousands of tweets, and numerous volumes to almost no one.
Tens of thousands of readers regularly praise me.
I despised writing. I'm stuck now.
I've learned what readers like and what doesn't.
Here are some essential guidelines for writing with impact:
Readers won't understand your work if you can't.
Though obvious, this slipped me up. Share your truths.
Stories engage human brains.
Showing the journey of a person from worm to butterfly inspires the human spirit.
Overthinking hinders powerful writing.
The best ideas come from inner understanding in between thoughts.
Avoid writing to find it. Write.
Writing a masterpiece isn't motivating.
Write for five minutes to simplify. Step-by-step, entertaining, easy steps.
Good writing requires a willingness to make mistakes.
So write loads of garbage that you can edit into a good piece.
Courageous writing.
A courageous story will move readers. Personal experience is best.
Go where few dare.
Templates, outlines, and boundaries help.
Limitations enhance writing.
Excellent writing is straightforward and readable, removing all the unnecessary fat.
Use five words instead of nine.
Use ordinary words instead of uncommon ones.
Readers desire relatability.
Too much perfection will turn it off.
Write to solve an issue if you can't think of anything to write.
Instead, read to inspire. Best authors read.
Every tweet, thread, and novel must have a central idea.
What's its point?
This can make writing confusing.
️ Don't direct your reader.
Readers quit reading. Demonstrate, describe, and relate.
Even if no one responds, have fun. If you hate writing it, the reader will too.

Tomas Pueyo
2 years ago
Soon, a Starship Will Transform Humanity
SpaceX's Starship.
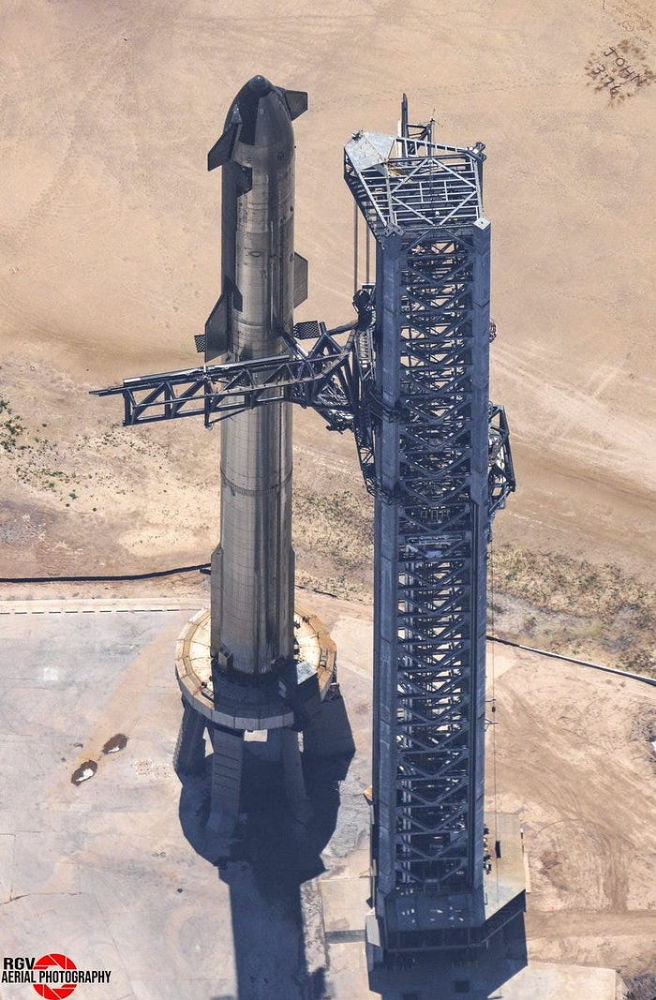
Launched last week.
Four minutes in:
SpaceX will succeed. When it does, its massiveness will matter.
Its payload will revolutionize space economics.
Civilization will shift.
We don't yet understand how this will affect space and Earth culture. Grab it.
The Cost of Space Transportation Has Decreased Exponentially
Space launches have increased dramatically in recent years.
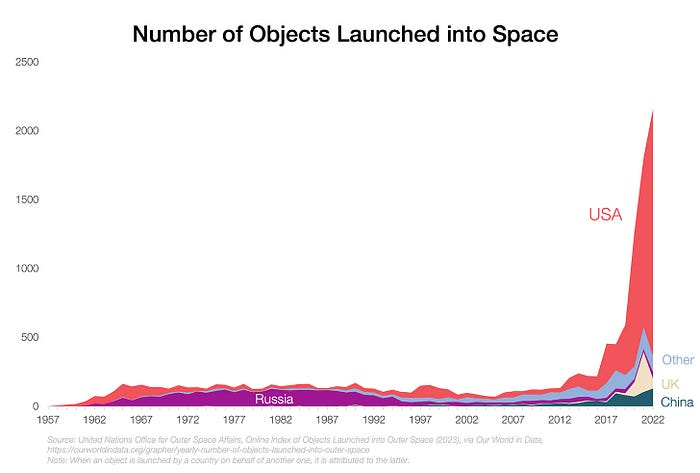
We mostly send items to LEO, the green area below:

SpaceX's reusable rockets can send these things to LEO. Each may launch dozens of payloads into space.
With all these launches, we're sending more than simply things to space. Volume and mass. Since the 1980s, launching a kilogram of payload to LEO has become cheaper:
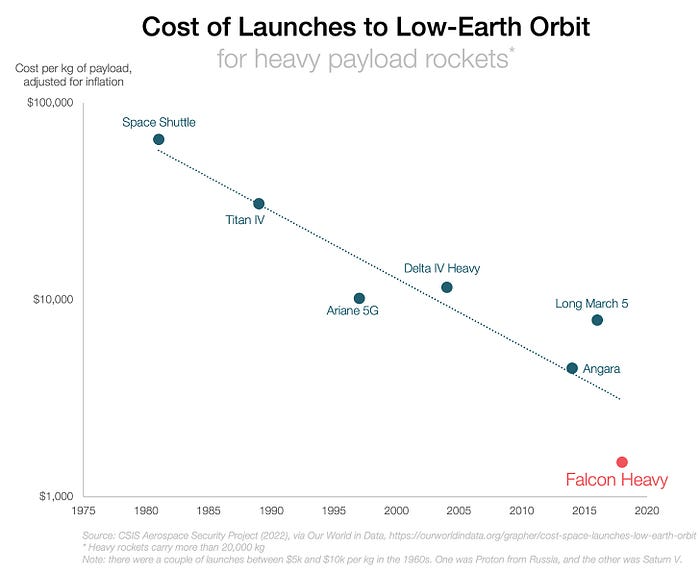
One kilogram in a large rocket cost over $75,000 in the 1980s. Carrying one astronaut cost nearly $5M! Falcon Heavy's $1,500/kg price is 50 times lower. SpaceX's larger, reusable rockets are amazing.
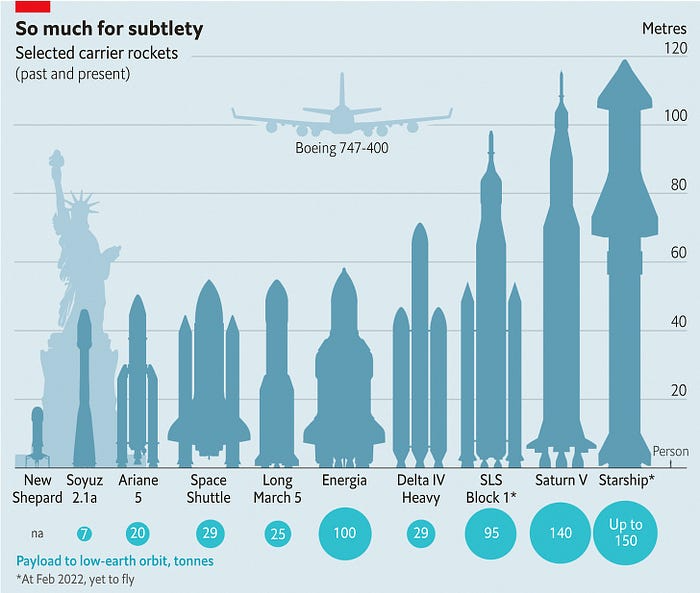
SpaceX's Starship rocket will continue. It can carry over 100 tons to LEO, 50% more than the current Falcon heavy. Thousands of launches per year. Elon Musk predicts Falcon Heavy's $1,500/kg cost will plummet to $100 in 23 years.
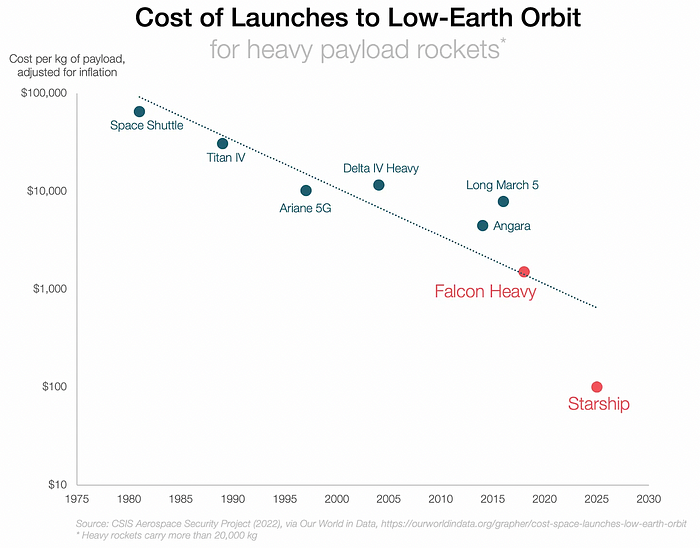
In context:
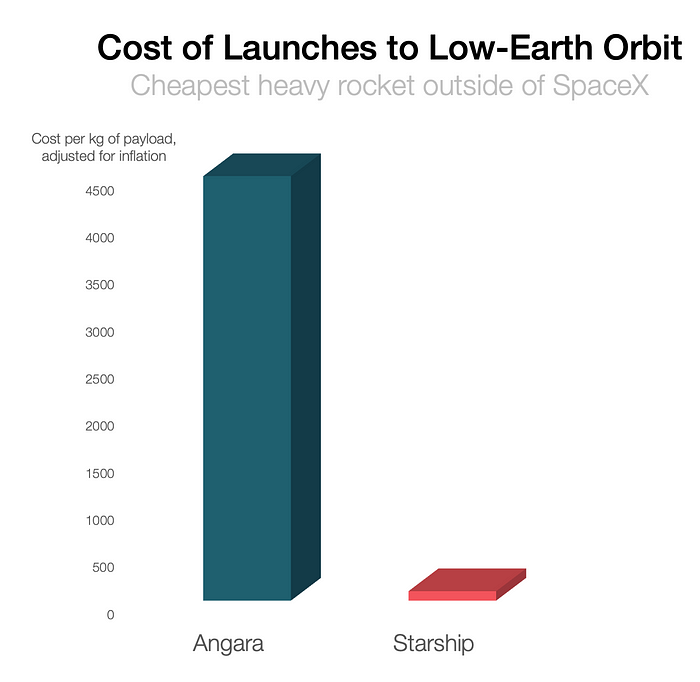
People underestimate this.
2. The Benefits of Affordable Transportation
Compare Earth's transportation costs:
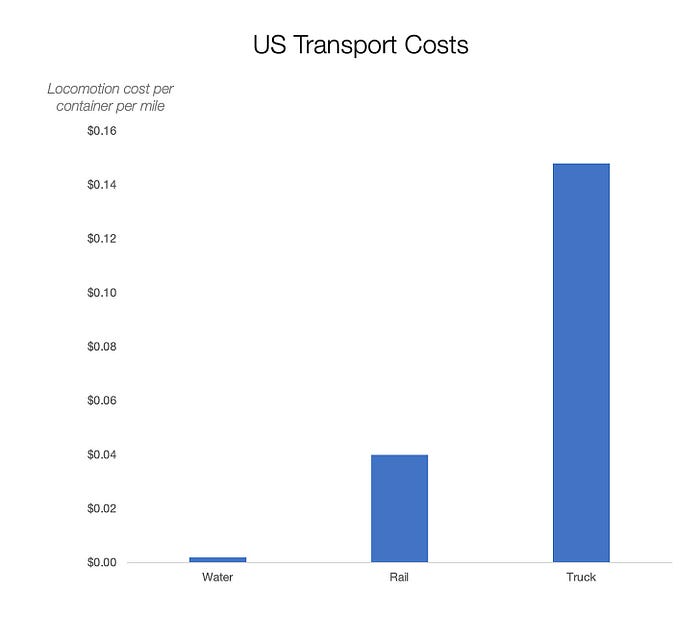
It's no surprise that the US and Northern Europe are the wealthiest and have the most navigable interior waterways.
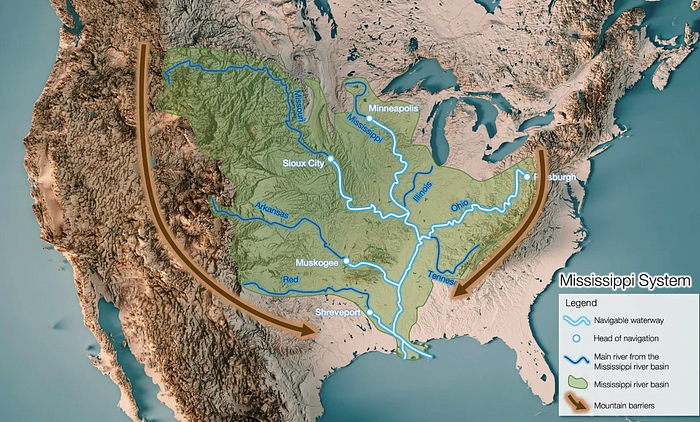
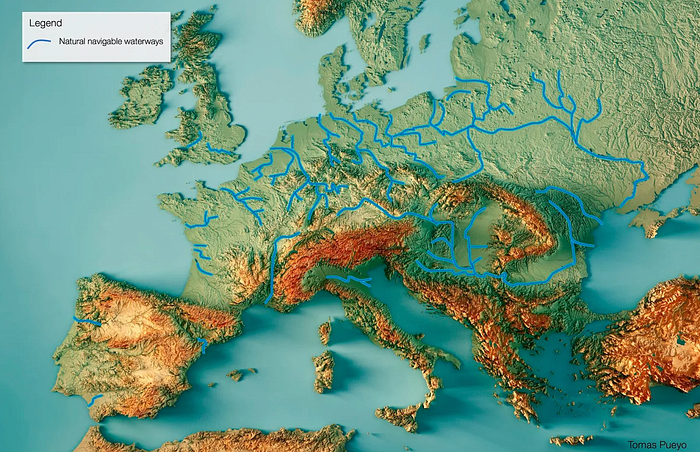
So what? since sea transportation is cheaper than land. Inland waterways are even better than sea transportation since weather is less of an issue, currents can be controlled, and rivers serve two banks instead of one for coastal transportation.
In France, because population density follows river systems, rivers are valuable. Cheap transportation brought people and money to rivers, especially their confluences.
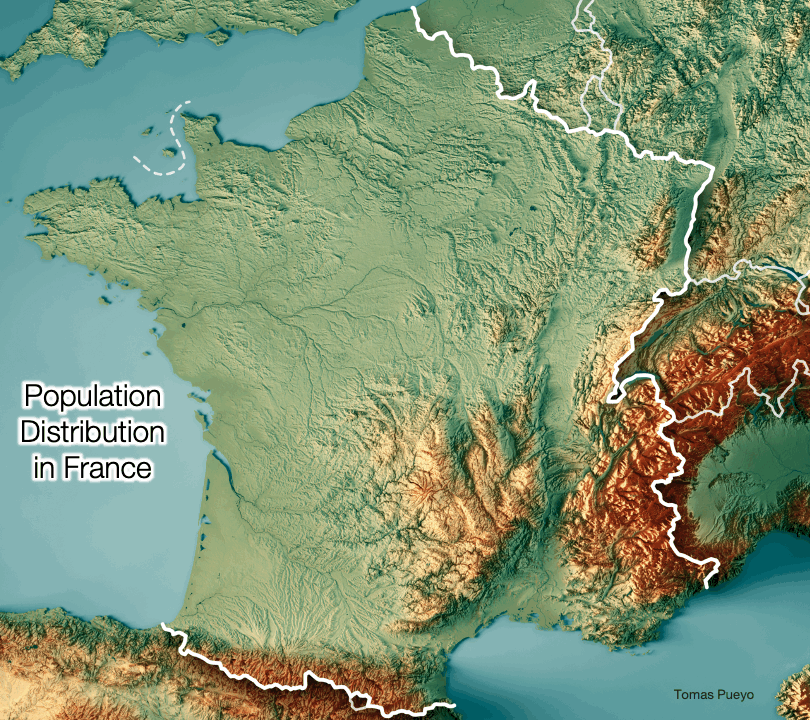
How come? Why were humans surrounding rivers?
Imagine selling meat for $10 per kilogram. Transporting one kg one kilometer costs $1. Your margin decreases $1 each kilometer. You can only ship 10 kilometers. For example, you can only trade with four cities:
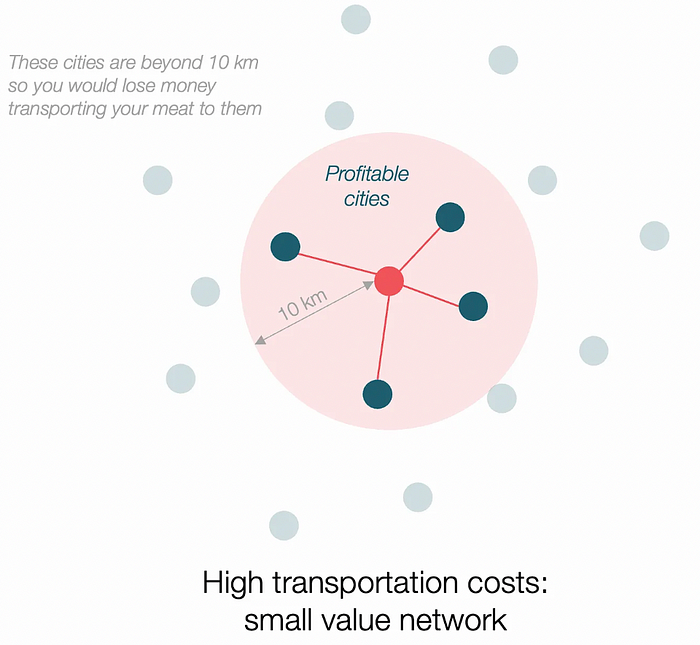
If instead, your cost of transportation is half, what happens? It costs you $0.5 per km. You now have higher margins with each city you traded with. More importantly, you can reach 20-km markets.
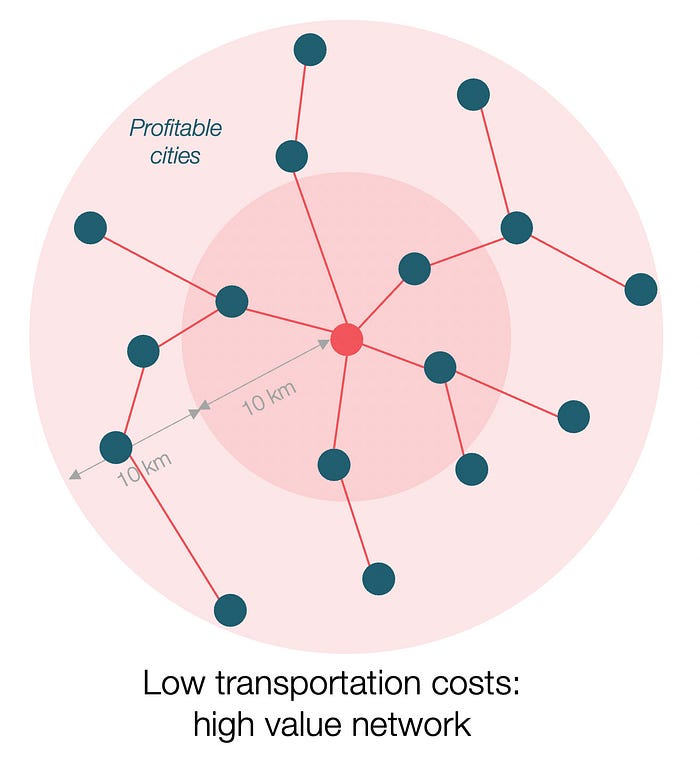
However, 2x distance 4x surface! You can now trade with sixteen cities instead of four! Metcalfe's law states that a network's value increases with its nodes squared. Since now sixteen cities can connect to yours. Each city now has sixteen connections! They get affluent and can afford more meat.
Rivers lower travel costs, connecting many cities, which can trade more, get wealthy, and buy more.
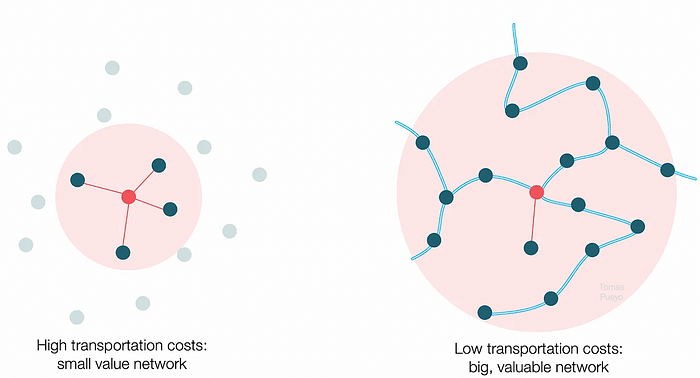
The right network is worth at least an order of magnitude more than the left! The cheaper the transport, the more trade at a lower cost, the more income generated, the more that wealth can be reinvested in better canals, bridges, and roads, and the wealth grows even more.
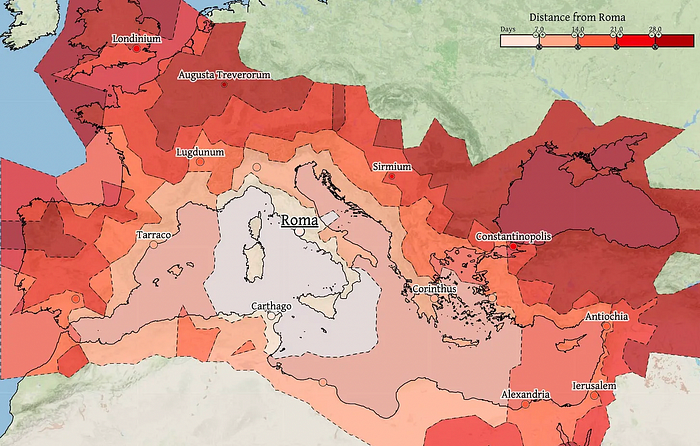
Throughout history. Rome was established around cheap Mediterranean transit and preoccupied with cutting overland transportation costs with their famous roadways. Communications restricted their empire.
The Egyptians lived around the Nile, the Vikings around the North Sea, early Japan around the Seto Inland Sea, and China started canals in the 5th century BC.
Transportation costs shaped empires.Starship is lowering new-world transit expenses. What's possible?
3. Change Organizations, Change Companies, Change the World
Starship is a conveyor belt to LEO. A new world of opportunity opens up as transportation prices drop 100x in a decade.
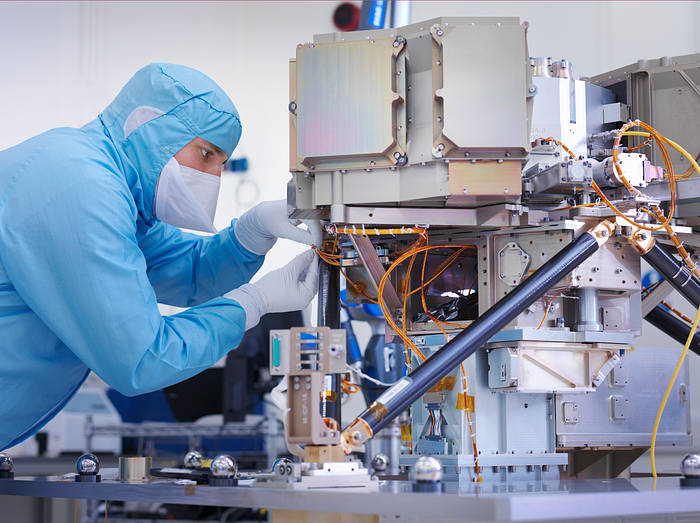
Satellite engineers have spent decades shedding milligrams. Weight influenced every decision: pricing structure, volumes to be sent, material selections, power sources, thermal protection, guiding, navigation, and control software. Weight was everything in the mission. To pack as much science into every millimeter, NASA missions had to be miniaturized. Engineers were indoctrinated against mass.
No way.
Starship is not constrained by any space mission, robotic or crewed.
Starship obliterates the mass constraint and every last vestige of cultural baggage it has gouged into the minds of spacecraft designers. A dollar spent on mass optimization no longer buys a dollar saved on launch cost. It buys nothing. It is time to raise the scope of our ambition and think much bigger. — Casey Handmer, Starship is still not understood
A Tesla Roadster in space makes more sense.
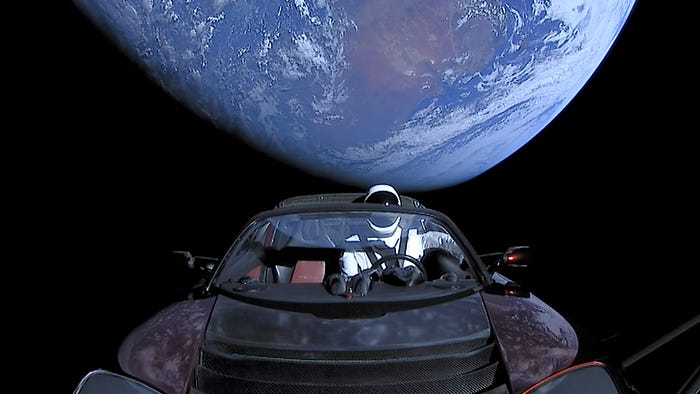
It went beyond bad PR. It told the industry: Did you care about every microgram? No more. My rockets are big enough to send a Tesla without noticing. Industry watchers should have noticed.
Most didn’t. Artemis is a global mission to send astronauts to the Moon and build a base. Artemis uses disposable Space Launch System rockets. Instead of sending two or three dinky 10-ton crew habitats over the next decade, Starship might deliver 100x as much cargo and create a base for 1,000 astronauts in a year or two. Why not? Because Artemis remains in a pre-Starship paradigm where each kilogram costs a million dollars and we must aggressively descope our objective.
Space agencies can deliver 100x more payload to space for the same budget with 100x lower costs and 100x higher transportation volumes. How can space economy saturate this new supply?
Before Starship, NASA supplied heavy equipment for Moon base construction. After Starship, Caterpillar and Deere may space-qualify their products with little alterations. Instead than waiting decades for NASA engineers to catch up, we could send people to build a space outpost with John Deere equipment in a few years.
History is littered with the wreckage of former industrial titans that underestimated the impact of new technology and overestimated their ability to adapt: Blockbuster, Motorola, Kodak, Nokia, RIM, Xerox, Yahoo, IBM, Atari, Sears, Hitachi, Polaroid, Toshiba, HP, Palm, Sony, PanAm, Sega, Netscape, Compaq, GM… — Casey Handmer, Starship is still not understood
Everyone saw it coming, but senior management failed to realize that adaption would involve moving beyond their established business practice. Others will if they don't.
4. The Starship Possibilities
It's Starlink.

SpaceX invented affordable cargo space and grasped its implications first. How can we use all this inexpensive cargo nobody knows how to use?
Satellite communications seemed like the best way to capitalize on it. They tried. Starlink, designed by SpaceX, provides fast, dependable Internet worldwide. Beaming information down is often cheaper than cable. Already profitable.
Starlink is one use for all this cheap cargo space. Many more. The longer firms ignore the opportunity, the more SpaceX will acquire.
What are these chances?
Satellite imagery is outdated and lacks detail. We can improve greatly. Synthetic aperture radar can take beautiful shots like this:

Have you ever used Google Maps and thought, "I want to see this in more detail"? What if I could view Earth live? What if we could livestream an infrared image of Earth?
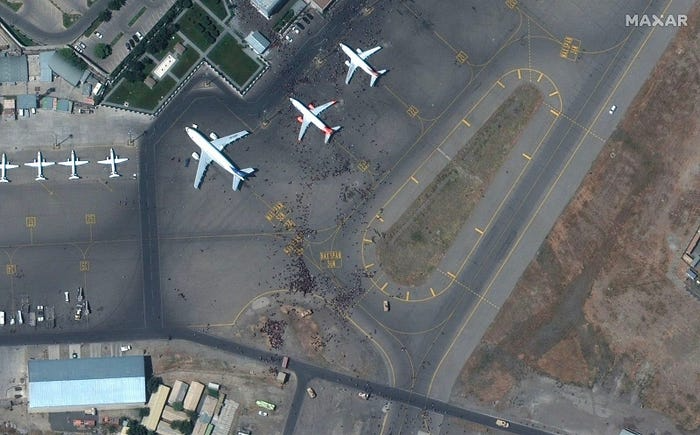
We could launch hundreds of satellites with such mind-blowing visual precision of the Earth that we would dramatically improve the accuracy of our meteorological models; our agriculture; where crime is happening; where poachers are operating in the savannah; climate change; and who is moving military personnel where. Is that useful?
What if we could see Earth in real time? That affects businesses? That changes society?