


A Warm Welcome to Web3 and the Future of the Internet
Let's take a look back at the internet's history and see where we're going — and why.
Tim Berners Lee had a problem. He was at CERN, the world's largest particle physics factory, at the time. The institute's stated goal was to study the simplest particles with the most sophisticated scientific instruments. The institute completed the LEP Tunnel in 1988, a 27 kilometer ring. This was Europe's largest civil engineering project (to study smaller particles — electrons).
The problem Tim Berners Lee found was information loss, not particle physics. CERN employed a thousand people in 1989. Due to team size and complexity, people often struggled to recall past project information. While these obstacles could be overcome, high turnover was nearly impossible. Berners Lee addressed the issue in a proposal titled ‘Information Management'.
When a typical stay is two years, data is constantly lost. The introduction of new people takes a lot of time from them and others before they understand what is going on. An emergency situation may require a detective investigation to recover technical details of past projects. Often, the data is recorded but cannot be found. — Information Management: A Proposal
He had an idea. Create an information management system that allowed users to access data in a decentralized manner using a new technology called ‘hypertext'.
To quote Berners Lee, his proposal was “vague but exciting...”. The paper eventually evolved into the internet we know today. Here are three popular W3C standards used by billions of people today:
(credit: CERN)
HTML (Hypertext Markup)
A web formatting language.
URI (Unique Resource Identifier)
Each web resource has its own “address”. Known as ‘a URL'.
HTTP (Hypertext Transfer Protocol)
Retrieves linked resources from across the web.
These technologies underpin all computer work. They were the seeds of our quest to reorganize information, a task as fruitful as particle physics.
Tim Berners-Lee would probably think the three decades from 1989 to 2018 were eventful. He'd be amazed by the billions, the inspiring, the novel. Unlocking innovation at CERN through ‘Information Management'.
The fictional character would probably need a drink, walk, and a few deep breaths to fully grasp the internet's impact. He'd be surprised to see a few big names in the mix.
Then he'd say, "Something's wrong here."
We should review the web's history before going there. Was it a success after Berners Lee made it public? Web1 and Web2: What is it about what we are doing now that so many believe we need a new one, web3?
Per Outlier Ventures' Jamie Burke:
Web 1.0 was read-only.
Web 2.0 was the writable
Web 3.0 is a direct-write web.
Let's explore.
Web1: The Read-Only Web
Web1 was the digital age. We put our books, research, and lives ‘online'. The web made information retrieval easier than any filing cabinet ever. Massive amounts of data were stored online. Encyclopedias, medical records, and entire libraries were put away into floppy disks and hard drives.
In 2015, the web had around 305,500,000,000 pages of content (280 million copies of Atlas Shrugged).
Initially, one didn't expect to contribute much to this database. Web1 was an online version of the real world, but not yet a new way of using the invention.
One gets the impression that the web has been underutilized by historians if all we can say about it is that it has become a giant global fax machine. — Daniel Cohen, The Web's Second Decade (2004)
That doesn't mean developers weren't building. The web was being advanced by great minds. Web2 was born as technology advanced.
Web2: Read-Write Web
Remember when you clicked something on a website and the whole page refreshed? Is it too early to call the mid-2000s ‘the good old days'?
Browsers improved gradually, then suddenly. AJAX calls augmented CGI scripts, and applications began sending data back and forth without disrupting the entire web page. One button to ‘digg' a post (see below). Web experiences blossomed.
In 2006, Digg was the most active ‘Web 2.0' site. (Photo: Ethereum Foundation Taylor Gerring)
Interaction was the focus of new applications. Posting, upvoting, hearting, pinning, tweeting, liking, commenting, and clapping became a lexicon of their own. It exploded in 2004. Easy ways to ‘write' on the internet grew, and continue to grow.
Facebook became a Web2 icon, where users created trillions of rows of data. Google and Amazon moved from Web1 to Web2 by better understanding users and building products and services that met their needs.
Business models based on Software-as-a-Service and then managing consumer data within them for a fee have exploded.
Web2 Emerging Issues
Unbelievably, an intriguing dilemma arose. When creating this read-write web, a non-trivial question skirted underneath the covers. Who owns it all?
You have no control over [Web 2] online SaaS. People didn't realize this because SaaS was so new. People have realized this is the real issue in recent years.
Even if these organizations have good intentions, their incentive is not on the users' side.
“You are not their customer, therefore you are their product,” they say. With Laura Shin, Vitalik Buterin, Unchained
A good plot line emerges. Many amazing, world-changing software products quietly lost users' data control.
For example: Facebook owns much of your social graph data. Even if you hate Facebook, you can't leave without giving up that data. There is no ‘export' or ‘exit'. The platform owns ownership.
While many companies can pull data on you, you cannot do so.
On the surface, this isn't an issue. These companies use my data better than I do! A complex group of stakeholders, each with their own goals. One is maximizing shareholder value for public companies. Tim Berners-Lee (and others) dislike the incentives created.
“Show me the incentive and I will show you the outcome.” — Berkshire Hathaway's CEO
It's easy to see what the read-write web has allowed in retrospect. We've been given the keys to create content instead of just consume it. On Facebook and Twitter, anyone with a laptop and internet can participate. But the engagement isn't ours. Platforms own themselves.
Web3: The ‘Unmediated’ Read-Write Web
Tim Berners Lee proposed a decade ago that ‘linked data' could solve the internet's data problem.
However, until recently, the same principles that allowed the Web of documents to thrive were not applied to data...
The Web of Data also allows for new domain-specific applications. Unlike Web 2.0 mashups, Linked Data applications work with an unbound global data space. As new data sources appear on the Web, they can provide more complete answers.
At around the same time as linked data research began, Satoshi Nakamoto created Bitcoin. After ten years, it appears that Berners Lee's ideas ‘link' spiritually with cryptocurrencies.
What should Web 3 do?
Here are some quick predictions for the web's future.
Users' data:
Users own information and provide it to corporations, businesses, or services that will benefit them.
Defying censorship:
No government, company, or institution should control your access to information (1, 2, 3)
Connect users and platforms:
Create symbiotic rather than competitive relationships between users and platform creators.
Open networks:
“First, the cryptonetwork-participant contract is enforced in open source code. Their voices and exits are used to keep them in check.” Dixon, Chris (4)
Global interactivity:
Transacting value, information, or assets with anyone with internet access, anywhere, at low cost
Self-determination:
Giving you the ability to own, see, and understand your entire digital identity.
Not pull, push:
‘Push' your data to trusted sources instead of ‘pulling' it from others.
Where Does This Leave Us?
Change incentives, change the world. Nick Babalola
People believe web3 can help build a better, fairer system. This is not the same as equal pay or outcomes, but more equal opportunity.
It should be noted that some of these advantages have been discussed previously. Will the changes work? Will they make a difference? These unanswered questions are technical, economic, political, and philosophical. Unintended consequences are likely.
We hope Web3 is a more democratic web. And we think incentives help the user. If there’s one thing that’s on our side, it’s that open has always beaten closed, given a long enough timescale.
We are at the start.
More on Web3 & Crypto

CyberPunkMetalHead
3 years ago
195 countries want Terra Luna founder Do Kwon
Interpol has issued a red alert on Terraform Labs' CEO, South Korean prosecutors said.

After the May crash of Terra Luna revealed tax evasion issues, South Korean officials filed an arrest warrant for Do Kwon, but he is missing.
Do Kwon is now a fugitive in 195 countries after Seoul prosecutors placed him to Interpol's red list. Do Kwon hasn't commented since then. The red list allows any country's local authorities to apprehend Do Kwon.
Do Dwon and Terraform Labs were believed to have moved to Singapore days before the $40 billion wipeout, but Singapore authorities said he fled the country on September 17. Do Kwon tweeted that he wasn't on the run and cited privacy concerns.
Do Kwon was not on the red list at the time and said he wasn't "running," only to reply to his own tweet saying he hasn't jogged in a while and needed to trim calories.
Whether or not it makes sense to read too much into this, the reality is that Do Kwon is now on Interpol red list, despite the firmly asserts on twitter that he does absolutely nothing to hide.
UPDATE:
South Korean authorities are investigating alleged withdrawals of over $60 million U.S. and seeking to freeze these assets. Korean authorities believe a new wallet exchanged over 3000 BTC through OKX and Kucoin.
Do Kwon and the Luna Foundation Guard (of whom Do Kwon is a key member of) have declined all charges and dubbed this disinformation.
Singapore's Luna Foundation Guard (LFG) manages the Terra Ecosystem.
The Legal Situation
Multiple governments are searching for Do Kwon and five other Terraform Labs employees for financial markets legislation crimes.
South Korean authorities arrested a man suspected of tax fraud and Ponzi scheme.
The U.S. SEC is also examining Terraform Labs on how UST was advertised as a stablecoin. No legal precedent exists, so it's unclear what's illegal.
The future of Terraform Labs, Terra, and Terra 2 is unknown, and despite what Twitter shills say about LUNC, the company remains in limbo awaiting a decision that will determine its fate. This project isn't a wise investment.

Koji Mochizuki
4 years ago
How to Launch an NFT Project by Yourself
Creating 10,000 auto-generated artworks, deploying a smart contract to the Ethereum / Polygon blockchain, setting up some tools, etc.
There is so much to do from launching to running an NFT project. Creating parts for artworks, generating 10,000 unique artworks and metadata, creating a smart contract and deploying it to a blockchain network, creating a website, creating a Twitter account, setting up a Discord server, setting up an OpenSea collection. In addition, you need to have MetaMask installed in your browser and have some ETH / MATIC. Did you get tired of doing all this? Don’t worry, once you know what you need to do, all you have to do is do it one by one.
To be honest, it’s best to run an NFT project in a team of three or more, including artists, developers, and marketers. However, depending on your motivation, you can do it by yourself. Some people might come later to offer help with your project. The most important thing is to take a step as soon as possible.
Creating Parts for Artworks
There are lots of free/paid software for drawing, but after all, I think Adobe Illustrator or Photoshop is the best. The images of Skulls In Love are a composite of 48x48 pixel parts created using Photoshop.
The most important thing in creating parts for generative art is to repeatedly test what your artworks will look like after each layer has been combined. The generated artworks should not be too unnatural.
How Many Parts Should You Create?
Are you wondering how many parts you should create to avoid duplication as much as possible when generating your artworks? My friend Stephane, a developer, has created a great tool to help with that.
Generating 10,000 Unique Artworks and Metadata
I highly recommend using the HashLips Art Engine to generate your artworks and metadata. Perhaps there is no better artworks generation tool at the moment.
GitHub: https://github.com/HashLips/hashlips_art_engine
YouTube:
Storing Artworks and Metadata
Ideally, the generated artworks and metadata should be stored on-chain, but if you want to store them off-chain, you should use IPFS. Do not store in centralized storage. This is because data will be lost if the server goes down or if the company goes down. On the other hand, IPFS is a more secure way to find data because it utilizes a distributed, decentralized system.
Storing to IPFS is easy with Pinata, NFT.Storage, and so on. The Skulls In Love uses Pinata. It’s very easy to use, just upload the folder containing your artworks.
Creating and Deploying a Smart Contract
You don’t have to create a smart contract from scratch. There are many great NFT projects, many of which publish their contract source code on Etherscan / PolygonScan. You can choose the contract you like and reuse it. Of course, that requires some knowledge of Solidity, but it depends on your efforts. If you don’t know which contract to choose, use the HashLips smart contract. It’s very simple, but it has almost all the functions you need.
GitHub: https://github.com/HashLips/hashlips_nft_contract
Note: Later on, you may want to change the cost value. You can change it on Remix or Etherscan / PolygonScan. But in this case, enter the Wei value instead of the Ether value. For example, if you want to sell for 1 MATIC, you have to enter “1000000000000000000”. If you set this value to “1”, you will have a nightmare. I recommend using Simple Unit Converter as a tool to calculate the Wei value.
Creating a Website
The website here is not just a static site to showcase your project, it’s a so-called dApp that allows you to access your smart contract and mint NFTs. In fact, this level of dApp is not too difficult for anyone who has ever created a website. Because the ethers.js / web3.js libraries make it easy to interact with your smart contract. There’s also no problem connecting wallets, as MetaMask has great documentation.
The Skulls In Love uses a simple, fast, and modern dApp that I built from scratch using Next.js. It is published on GitHub, so feel free to use it.
Why do people mint NFTs on a website?
Ethereum’s gas fees are high, so if you mint all your NFTs, there will be a huge initial cost. So it makes sense to get the buyers to help with the gas fees for minting.
What about Polygon? Polygon’s gas fees are super cheap, so even if you mint 10,000 NFTs, it’s not a big deal. But we don’t do that. Since NFT projects are a kind of game, it involves the fun of not knowing what will come out after minting.
Creating a Twitter Account
I highly recommend creating a Twitter account. Twitter is an indispensable tool for announcing giveaways and reaching more people. It’s better to announce your project and your artworks little by little, 1–2 weeks before launching your project.
Creating and Setting Up a Discord Server
I highly recommend creating a Discord server as well as a Twitter account. The Discord server is a community and its home. Fans of your NFT project will want to join your community and interact with many other members. So, carefully create each channel on your Discord server to make it a cozy place for your community members.
If you are unfamiliar with Discord, you may be particularly confused by the following:
What bots should I use?
How should I set roles and permissions?
But don’t worry. There are lots of great YouTube videos and blog posts about these.
It’s also a good idea to join the Discord servers of some NFT projects and see how they’re made. Our Discord server is so simple that even beginners will find it easy to understand. Please join us and see it!
Note: First, create a test account and a test server to make sure your bots and permissions work properly. It is better to verify the behavior on the test server before setting up your production server.
UPDATED: As your Discord server grows, you cannot manage it on your own. In this case, you will be hiring several moderators, but choose carefully before hiring. And don’t give them important role permissions right after hiring. Initially, the same permissions as other members are sufficient. After a while, you can add permissions as needed, such as kicking/banning, using the “@every” tag, and adding roles. Again, don’t immediately give significant permissions to your Mod role. Your server can be messed up by fake moderators.
Setting Up Your OpenSea Collection
Before you start selling your NFTs, you need to reserve some for airdrops, giveaways, staff, and more. It’s up to you whether it’s 100, 500, or how many.
After minting some of your NFTs, your account and collection should have been created in OpenSea. Go to OpenSea, connect to your wallet, and set up your collection. Just set your logo, banner image, description, links, royalties, and more. It’s not that difficult.
Promoting Your Project
After all, promotion is the most important thing. In fact, almost every successful NFT project spends a lot of time and effort on it.
In addition to Twitter and Discord, it’s even better to use Instagram, Reddit, and Medium. Also, register your project in NFTCalendar and DISBOARD
DISBOARD is the public Discord server listing community.
About Promoters
You’ll probably get lots of contacts from promoters on your Discord, Twitter, Instagram, and more. But most of them are scams, so don’t pay right away. If you have a promoter that looks attractive to you, be sure to check the promoter’s social media accounts or website to see who he/she is. They basically charge in dollars. The amount they charge isn’t cheap, but promoters with lots of followers may have some temporary effect on your project. Some promoters accept 50% prepaid and 50% postpaid. If you can afford it, it might be worth a try. I never ask them, though.
When Should the Promotion Activities Start?
You may be worried that if you promote your project before it starts, someone will copy your project (artworks). It is true that some projects have actually suffered such damage. I don’t have a clear answer to this question right now, but:
- Do not publish all the information about your project too early
- The information should be released little by little
- Creating artworks that no one can easily copy
I think these are important.
If anyone has a good idea, please share it!
About Giveaways
When hosting giveaways, you’ll probably use multiple social media platforms. You may want to grow your Discord server faster. But if joining the Discord server is included in the giveaway requirements, some people hate it. I recommend holding giveaways for each platform. On Twitter and Reddit, you should just add the words “Discord members-only giveaway is being held now! Please join us if you like!”.
If you want to easily pick a giveaway winner in your browser, I recommend Twitter Picker.
Precautions for Distributing Free NFTs
If you want to increase your Twitter followers and Discord members, you can actually get a lot of people by holding events such as giveaways and invite contests. However, distributing many free NFTs at once can be dangerous. Some people who want free NFTs, as soon as they get a free one, sell it at a very low price on marketplaces such as OpenSea. They don’t care about your project and are only thinking about replacing their own “free” NFTs with Ethereum. The lower the floor price of your NFTs, the lower the value of your NFTs (project). Try to think of ways to get people to “buy” your NFTs as much as possible.
Ethereum vs. Polygon
Even though Ethereum has high gas fees, NFT projects on the Ethereum network are still mainstream and popular. On the other hand, Polygon has very low gas fees and fast transaction processing, but NFT projects on the Polygon network are not very popular.
Why? There are several reasons, but the biggest one is that it’s a lot of work to get MATIC (on Polygon blockchain, use MATIC instead of ETH) ready to use. Simply put, you need to bridge your tokens to the Polygon chain. So people need to do this first before minting your NFTs on your website. It may not be a big deal for those who are familiar with crypto and blockchain, but it may be complicated for those who are not. I hope that the tedious work will be simplified in the near future.
If you are confident that your NFTs will be purchased even if they are expensive, or if the total supply of your NFTs is low, you may choose Ethereum. If you just want to save money, you should choose Polygon. Keep in mind that gas fees are incurred not only when minting, but also when performing some of your smart contract functions and when transferring your NFTs.
If I were to launch a new NFT project, I would probably choose Ethereum or Solana.
Conclusion
Some people may want to start an NFT project to make money, but don’t forget to enjoy your own project. Several months ago, I was playing with creating generative art by imitating the CryptoPunks. I found out that auto-generated artworks would be more interesting than I had imagined, and since then I’ve been completely absorbed in generative art.
This is one of the Skulls In Love artworks:
This character wears a cowboy hat, black slim sunglasses, and a kimono. If anyone looks like this, I can’t help laughing!
The Skulls In Love NFTs can be minted for a small amount of MATIC on the official website. Please give it a try to see what kind of unique characters will appear 💀💖
Thank you for reading to the end. I hope this article will be helpful to those who want to launch an NFT project in the future ✨

Shan Vernekar
3 years ago
How the Ethereum blockchain's transactions are carried out
Overview
Ethereum blockchain is a network of nodes that validate transactions. Any network node can be queried for blockchain data for free. To write data as a transition requires processing and writing to each network node's storage. Fee is paid in ether and is also called as gas.
We'll examine how user-initiated transactions flow across the network and into the blockchain.
Flow of transactions
A user wishes to move some ether from one external account to another. He utilizes a cryptocurrency wallet for this (like Metamask), which is a browser extension.
The user enters the desired transfer amount and the external account's address. He has the option to choose the transaction cost he is ready to pay.
Wallet makes use of this data, signs it with the user's private key, and writes it to an Ethereum node. Services such as Infura offer APIs that enable writing data to nodes. One of these services is used by Metamask. An example transaction is shown below. Notice the “to” address and value fields.
var rawTxn = {
    nonce: web3.toHex(txnCount),
    gasPrice: web3.toHex(100000000000),
    gasLimit: web3.toHex(140000),
    to: '0x633296baebc20f33ac2e1c1b105d7cd1f6a0718b',
    value: web3.toHex(0),
    data: '0xcc9ab24952616d6100000000000000000000000000000000000000000000000000000000'
};
The transaction is written to the target Ethereum node's local TRANSACTION POOL. It informed surrounding nodes of the new transaction, and those nodes reciprocated. Eventually, this transaction is received by and written to each node's local TRANSACTION pool.
The miner who finds the following block first adds pending transactions (with a higher gas cost) from the nearby TRANSACTION POOL to the block.
The transactions written to the new block are verified by other network nodes.
A block is added to the main blockchain after there is consensus and it is determined to be genuine. The local blockchain is updated with the new node by additional nodes as well.
Block mining begins again next.
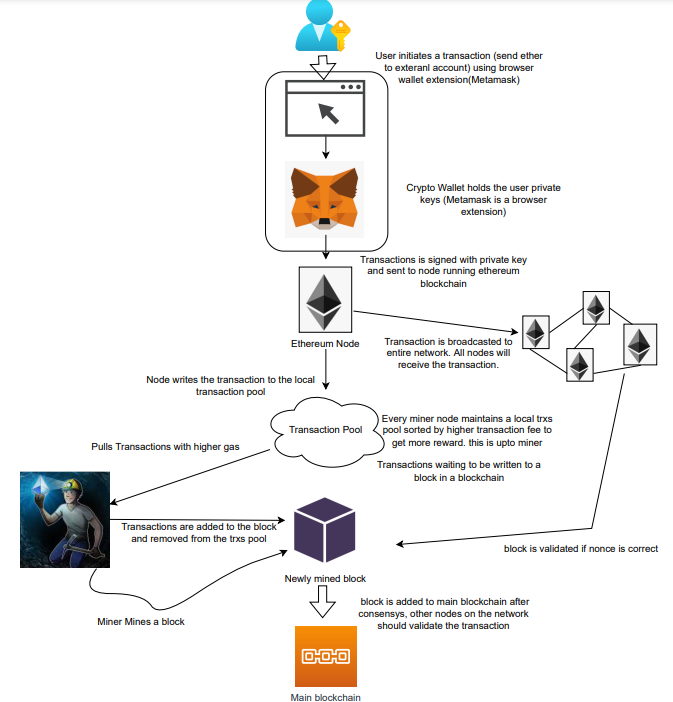
The image above shows how transactions go via the network and what's needed to submit them to the main block chain.
References
ethereum.org/transactions How Ethereum transactions function, their data structure, and how to send them via app. ethereum.org
You might also like

Architectural Digest
3 years ago
Take a look at The One, a Los Angeles estate with a whopping 105,000 square feet of living area.
The interiors of the 105,000-square-foot property, which sits on a five-acre parcel in the wealthy Los Angeles suburb of Bel Air and is suitably titled The One, have been a well guarded secret. We got an intimate look inside this world-record-breaking property, as well as the creative and aesthetic geniuses behind it.
The estate appears to float above the city, surrounded on three sides by a moat and a 400-foot-long running track. Completed over eight years—and requiring 600 workers to build—the home was designed by architect Paul McClean and interior designer Kathryn Rotondi, who were enlisted by owner and developer Nile Niami to help it live up to its standard.
"This endeavor seemed both exhilarating and daunting," McClean says. However, the home's remarkable location and McClean's long-standing relationship with Niami persuaded him to "build something unique and extraordinary" rather than just take on the job.
And McClean has more than delivered.
The home's main entrance leads to a variety of meeting places with magnificent 360-degree views of the Pacific Ocean, downtown Los Angeles, and the San Gabriel Mountains, thanks to its 26-foot-high ceilings. There is water at the entrance area, as well as a sculpture and a bridge. "We often employ water in our design approach because it provides a sensory change that helps you acclimatize to your environment," McClean explains.
Niami wanted a neutral palette that would enable the environment and vistas to shine, so she used black, white, and gray throughout the house.
McClean has combined the home's inside with outside "to create that quintessential L.A. lifestyle but on a larger scale," he says, drawing influence from the local environment and history of Los Angeles modernism. "We separated the entertaining spaces from the living portions to make the house feel more livable. The former are on the lowest level, which serves as a plinth for the rest of the house and minimizes its apparent mass."
The home's statistics, in addition to its eye-catching style, are equally impressive. There are 42 bathrooms, 21 bedrooms, a 5,500-square-foot master suite, a 30-car garage gallery with two car-display turntables, a four-lane bowling alley, a spa level, a 30-seat movie theater, a "philanthropy wing (with a capacity of 200) for charity galas, a 10,000-square-foot sky deck, and five swimming pools.
Rotondi, the creator of KFR Design, collaborated with Niami on the interior design to create different spaces that flow into one another despite the house's grandeur. "I was especially driven to 'wow factor' components in the hospitality business," Rotondi says, citing top luxury hotel brands such as Aman, Bulgari, and Baccarat as sources of inspiration. Meanwhile, the home's color scheme, soft textures, and lighting are a nod to Niami and McClean's favorite Tom Ford boutique on Rodeo Drive.
The house boasts an extraordinary collection of art, including a butterfly work by Stephen Wilson on the lower level and a Niclas Castello bespoke panel in black and silver in the office, thanks to a cooperation between Creative Art Partners and Art Angels. There is also a sizable collection of bespoke furniture pieces from byShowroom.
A house of this size will never be erected again in Los Angeles, thanks to recently enacted city rules, so The One will truly be one of a kind. "For all of us, this project has been such a long and instructive trip," McClean says. "It was exciting to develop and approached with excitement, but I don't think any of us knew how much effort and time it would take to finish the project."

Antonio Neto
3 years ago
Should you skip the minimum viable product?
Are MVPs outdated and have no place in modern product culture?
Frank Robinson coined "MVP" in 2001. In the same year as the Agile Manifesto, the first Scrum experiment began. MVPs are old.
The concept was created to solve the waterfall problem at the time.
The market was still sour from the .com bubble. The tech industry needed a new approach. Product and Agile gained popularity because they weren't waterfall.
More than 20 years later, waterfall is dead as dead can be, but we are still talking about MVPs. Does that make sense?
What is an MVP?
Minimum viable product. You probably know that, so I'll be brief:
[…] The MVP fits your company and customer. It's big enough to cause adoption, satisfaction, and sales, but not bloated and risky. It's the product with the highest ROI/risk. […] — Frank Robinson, SyncDev
MVP is a complete product. It's not a prototype. It's your product's first iteration, which you'll improve. It must drive sales and be user-friendly.
At the MVP stage, you should know your product's core value, audience, and price. We are way deep into early adoption territory.
What about all the things that come before?
Modern product discovery
Eric Ries popularized the term with The Lean Startup in 2011. (Ries would work with the concept since 2008, but wide adoption came after the book was released).
Ries' definition of MVP was similar to Robinson's: "Test the market" before releasing anything. Ries never mentioned money, unlike Jobs. His MVP's goal was learning.
“Remove any feature, process, or effort that doesn't directly contribute to learning” — Eric Ries, The Lean Startup
Product has since become more about "what" to build than building it. What started as a learning tool is now a discovery discipline: fake doors, prototyping, lean inception, value proposition canvas, continuous interview, opportunity tree... These are cheap, effective learning tools.
Over time, companies realized that "maximum ROI divided by risk" started with discovery, not the MVP. MVPs are still considered discovery tools. What is the problem with that?
Time to Market vs Product Market Fit
Waterfall's Time to Market is its biggest flaw. Since projects are sliced horizontally rather than vertically, when there is nothing else to be done, it’s not because the product is ready, it’s because no one cares to buy it anymore.
MVPs were originally conceived as a way to cut corners and speed Time to Market by delivering more customer requests after they paid.
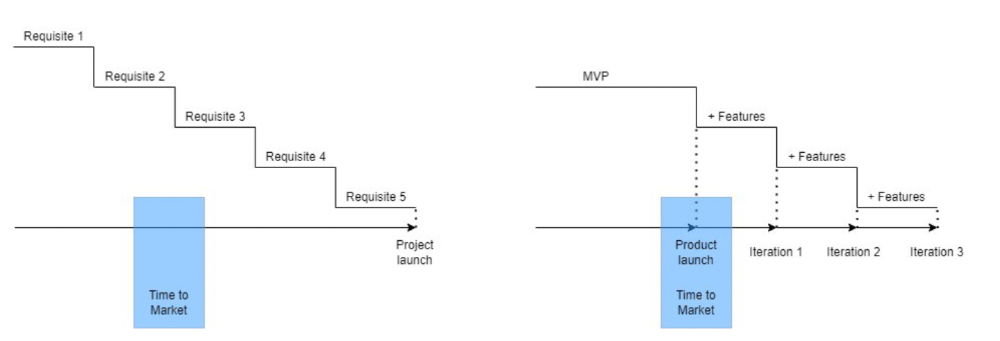
Original product development was waterfall-like.
Time to Market defines an optimal, specific window in which value should be delivered. It's impossible to predict how long or how often this window will be open.
Product Market Fit makes this window a "state." You don’t achieve Product Market Fit, you have it… and you may lose it.
Take, for example, Snapchat. They had a great time to market, but lost product-market fit later. They regained product-market fit in 2018 and have grown since.
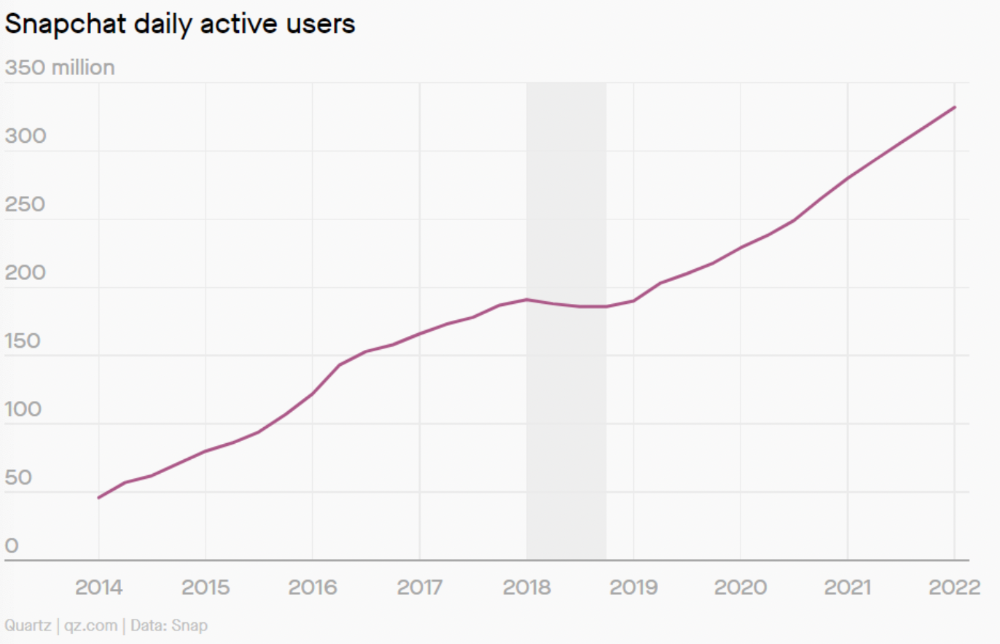
An MVP couldn't handle this. What should Snapchat do? Launch Snapchat 2 and see what the market was expecting differently from the last time? MVPs are a snapshot in time that may be wrong in two weeks.
MVPs are mini-projects. Instead of spending a lot of time and money on waterfall, you spend less but are still unsure of the results.
MVPs aren't always wrong. When releasing your first product version, consider an MVP.
Minimum viable product became less of a thing on its own and more interchangeable with Alpha Release or V.1 release over time.
Modern discovery technics are more assertive and predictable than the MVP, but clarity comes only when you reach the market.
MVPs aren't the starting point, but they're the best way to validate your product concept.

The woman
3 years ago
Why Google's Hiring Process is Brilliant for Top Tech Talent
Without a degree and experience, you can get a high-paying tech job.

Most organizations follow this hiring rule: you chat with HR, interview with your future boss and other senior managers, and they make the final hiring choice.
If you've ever applied for a job, you know how arduous it can be. A newly snapped photo and a glossy resume template can wear you out. Applying to Google can change this experience.
According to an Universum report, Google is one of the world's most coveted employers. It's not simply the search giant's name and reputation that attract candidates, but its role requirements or lack thereof.
Candidates no longer need a beautiful resume, cover letter, Ivy League laurels, or years of direct experience. The company requires no degree or experience.
Elon Musk started it. He employed the two-hands test to uncover talented non-graduates. The billionaire eliminated the requirement for experience.
Google is deconstructing traditional employment with programs like the Google Project Management Degree, a free online and self-paced professional credential course.
Google's hiring is interesting. After its certification course, applicants can work in project management. Instead of academic degrees and experience, the company analyzes coursework.
Google finds the best project managers and technical staff in exchange. Google uses three strategies to find top talent.
Chase down the innovators
Google eliminates restrictions like education, experience, and others to find the polar bear amid the snowfall. Google's free project management education makes project manager responsibilities accessible to everyone.
Many jobs don't require a degree. Overlooking individuals without a degree can make it difficult to locate a candidate who can provide value to a firm.
Firsthand knowledge follows the same rule. A lack of past information might be an employer's benefit. This is true for creative teams or businesses that prefer to innovate.
Or when corporations conduct differently from the competition. No-experience candidates can offer fresh perspectives. Fast Company reports that people with no sales experience beat those with 10 to 15 years of experience.
Give the aptitude test first priority.
Google wants the best candidates. Google wouldn't be able to receive more applications if it couldn't screen them for fit. Its well-organized online training program can be utilized as a portfolio.
Google learns a lot about an applicant through completed assignments. It reveals their ability, leadership style, communication capability, etc. The course mimics the job to assess candidates' suitability.
Basic screening questions might provide information to compare candidates. Any size small business can use screening questions and test projects to evaluate prospective employees.
Effective training for employees
Businesses must train employees regardless of their hiring purpose. Formal education and prior experience don't guarantee success. Maintaining your employees' professional knowledge gaps is key to their productivity and happiness. Top-notch training can do that. Learning and development are key to employee engagement, says Bob Nelson, author of 1,001 Ways to Engage Employees.
Google's online certification program isn't available everywhere. Improving the recruiting process means emphasizing aptitude over experience and a degree. Instead of employing new personnel and having them work the way their former firm trained them, train them how you want them to function.
If you want to know more about Google’s recruiting process, we recommend you watch the movie “Internship.”