


Gran Turismo 7 Update Eases Up On The Grind After Fan Outrage
Polyphony Digital has changed the game after apologizing in March.
To make amends for some disastrous downtime, Gran Turismo 7 director Kazunori Yamauchi announced a credits handout and promised to “dramatically change GT7's car economy to help make amends” last month. The first of these has arrived.
The game's 1.11 update includes the following concessions to players frustrated by the economy and its subsequent grind:
-
The last half of the World Circuits events have increased in-game credit rewards.
-
Modified Arcade and Custom Race rewards
-
Clearing all circuit layouts with Gold or Bronze now rewards In-game Credits. Exiting the Sector selection screen with the Exit button will award Credits if an event has already been cleared.
-
Increased Credits Rewards in Lobby and Daily Races
-
Increased the free in-game Credits cap from 20,000,000 to 100,000,000.
Additionally, “The Human Comedy” missions are one-hour endurance races that award “up to 1,200,000” credits per event.
This isn't everything Yamauchi promised last month; he said it would take several patches and updates to fully implement the changes. Here's a list of everything he said would happen, some of which have already happened (like the World Cup rewards and credit cap):
- Increase rewards in the latter half of the World Circuits by roughly 100%.
- Added high rewards for all Gold/Bronze results clearing the Circuit Experience.
- Online Races rewards increase.
- Add 8 new 1-hour Endurance Race events to Missions. So expect higher rewards.
- Increase the non-paid credit limit in player wallets from 20M to 100M.
- Expand the number of Used and Legend cars available at any time.
- With time, we will increase the payout value of limited time rewards.
- New World Circuit events.
- Missions now include 24-hour endurance races.
- Online Time Trials added, with rewards based on the player's time difference from the leader.
- Make cars sellable.
The full list of updates and changes can be found here.
Read the original post.
More on Gaming

Matthew Cluff
3 years ago
GTO Poker 101
"GTO" (Game Theory Optimal) has been used a lot in poker recently. To clarify its meaning and application, the aim of this article is to define what it is, when to use it when playing, what strategies to apply for how to play GTO poker, for beginner and more advanced players!
Poker GTO
In poker, you can choose between two main winning strategies:
Exploitative play maximizes expected value (EV) by countering opponents' sub-optimal plays and weaker tendencies. Yes, playing this way opens you up to being exploited, but the weaker opponents you're targeting won't change their game to counteract this, allowing you to reap maximum profits over the long run.
GTO (Game-Theory Optimal): You try to play perfect poker, which forces your opponents to make mistakes (which is where almost all of your profit will be derived from). It mixes bluffs or semi-bluffs with value bets, clarifies bet sizes, and more.
GTO vs. Exploitative: Which is Better in Poker?
Before diving into GTO poker strategy, it's important to know which of these two play styles is more profitable for beginners and advanced players. The simple answer is probably both, but usually more exploitable.
Most players don't play GTO poker and can be exploited in their gameplay and strategy, allowing for more profits to be made using an exploitative approach. In fact, it’s only in some of the largest games at the highest stakes that GTO concepts are fully utilized and seen in practice, and even then, exploitative plays are still sometimes used.
Knowing, understanding, and applying GTO poker basics will create a solid foundation for your poker game. It's also important to understand GTO so you can deviate from it to maximize profits.
GTO Poker Strategy
According to Ed Miller's book "Poker's 1%," the most fundamental concept that only elite poker players understand is frequency, which could be in relation to cbets, bluffs, folds, calls, raises, etc.
GTO poker solvers (downloadable online software) give solutions for how to play optimally in any given spot and often recommend using mixed strategies based on select frequencies.
In a river situation, a solver may tell you to call 70% of the time and fold 30%. It may also suggest calling 50% of the time, folding 35% of the time, and raising 15% of the time (with a certain range of hands).
Frequencies are a fundamental and often unrecognized part of poker, but they run through these 5 GTO concepts.
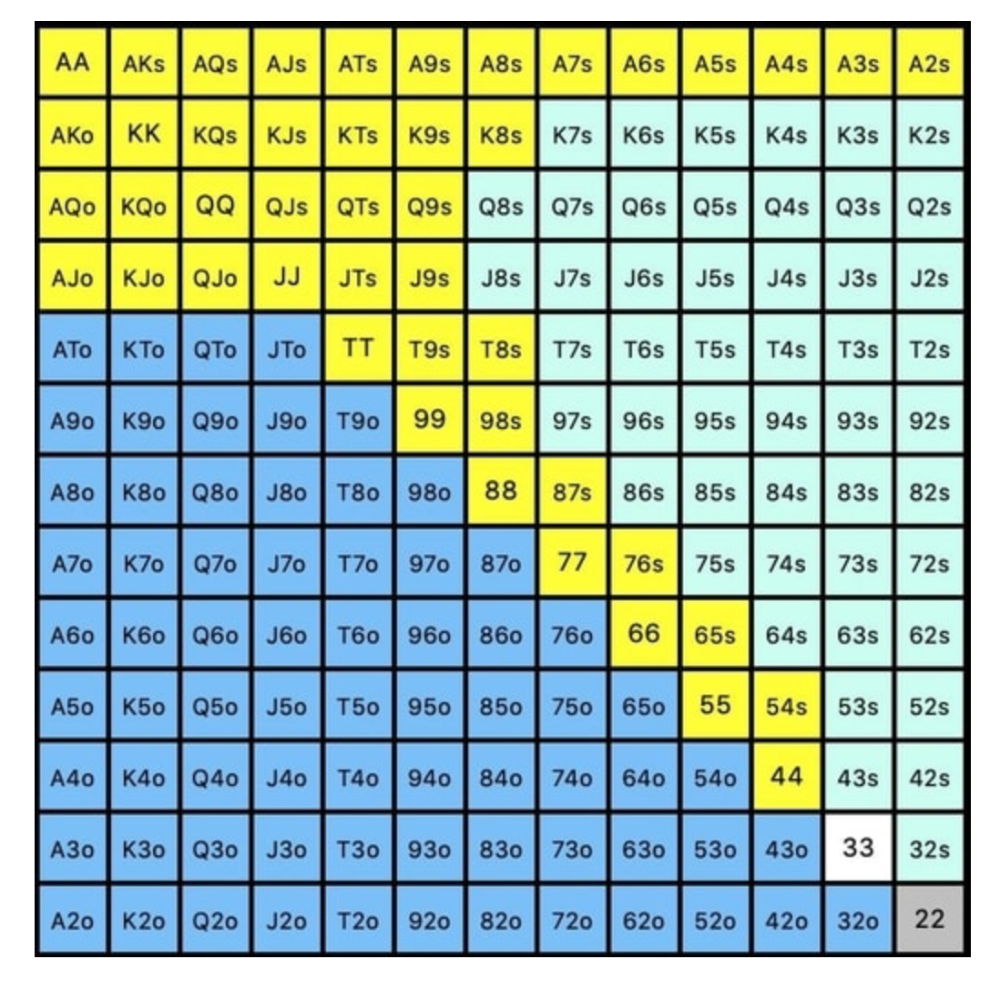
1. Preflop ranges
To compensate for positional disadvantage, out-of-position players must open tighter hand ranges.
Premium starting hands aren't enough, though. Considering GTO poker ranges and principles, you want a good, balanced starting hand range from each position with at least some hands that can make a strong poker hand regardless of the flop texture (low, mid, high, disconnected, etc).
Below is a GTO preflop beginner poker chart for online 6-max play, showing which hand ranges one should open-raise with. Table positions are color-coded (see key below).
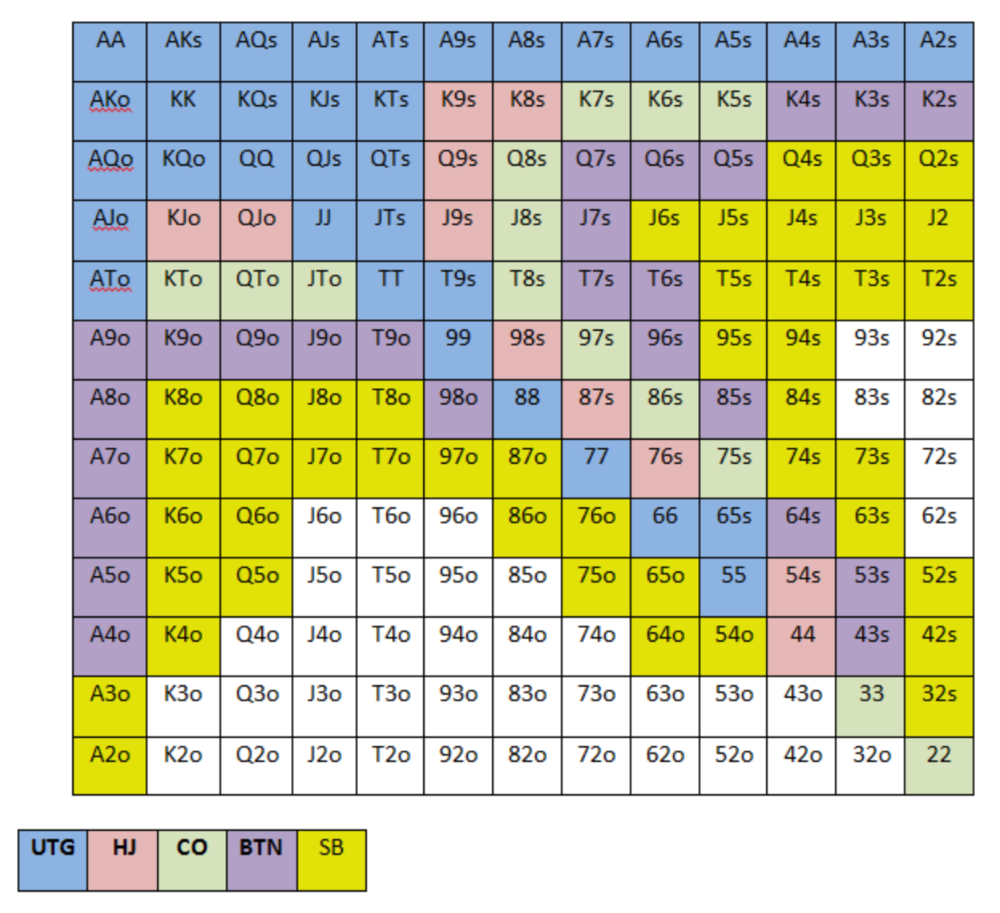
NOTE: For GTO play, it's advisable to use a mixed strategy for opening in the small blind, combining open-limps and open-raises for various hands. This cannot be illustrated with the color system used for the chart.
Choosing which hands to play is often a math problem, as discussed below.
Other preflop GTO poker charts include which hands to play after a raise, which to 3bet, etc. Solvers can help you decide which preflop hands to play (call, raise, re-raise, etc.).
2. Pot Odds
Always make +EV decisions that profit you as a poker player. Understanding pot odds (and equity) can help.
Postflop Pot Odds
Let’s say that we have JhTh on a board of 9h8h2s4c (open-ended straight-flush draw). We have $40 left and $50 in the pot. He has you covered and goes all-in. As calling or folding are our only options, playing GTO involves calculating whether a call is +EV or –EV. (The hand was empty.)
Any remaining heart, Queen, or 7 wins the hand. This means we can improve 15 of 46 unknown cards, or 32.6% of the time.
What if our opponent has a set? The 4h or 2h could give us a flush, but it could also give the villain a boat. If we reduce outs from 15 to 14.5, our equity would be 31.5%.
We must now calculate pot odds.
(bet/(our bet+pot)) = pot odds
= $50 / ($40 + $90)
= $40 / $130
= 30.7%
To make a profitable call, we need at least 30.7% equity. This is a profitable call as we have 31.5% equity (even if villain has a set). Yes, we will lose most of the time, but we will make a small profit in the long run, making a call correct.
Pot odds aren't just for draws, either. If an opponent bets 50% pot, you get 3 to 1 odds on a call, so you must win 25% of the time to be profitable. If your current hand has more than 25% equity against your opponent's perceived range, call.
Preflop Pot Odds
Preflop, you raise to 3bb and the button 3bets to 9bb. You must decide how to act. In situations like these, we can actually use pot odds to assist our decision-making.
This pot is:
(our open+3bet size+small blind+big blind)
(3bb+9bb+0.5bb+1bb)
= 13.5
This means we must call 6bb to win a pot of 13.5bb, which requires 30.7% equity against the 3bettor's range.
Three additional factors must be considered:
Being out of position on our opponent makes it harder to realize our hand's equity, as he can use his position to put us in tough spots. To profitably continue against villain's hand range, we should add 7% to our equity.
Implied Odds / Reverse Implied Odds: The ability to win or lose significantly more post-flop (than pre-flop) based on our remaining stack.
While statistics on 3bet stats can be gained with a large enough sample size (i.e. 8% 3bet stat from button), the numbers don't tell us which 8% of hands villain could be 3betting with. Both polarized and depolarized charts below show 8% of possible hands.
7.4% of hands are depolarized.
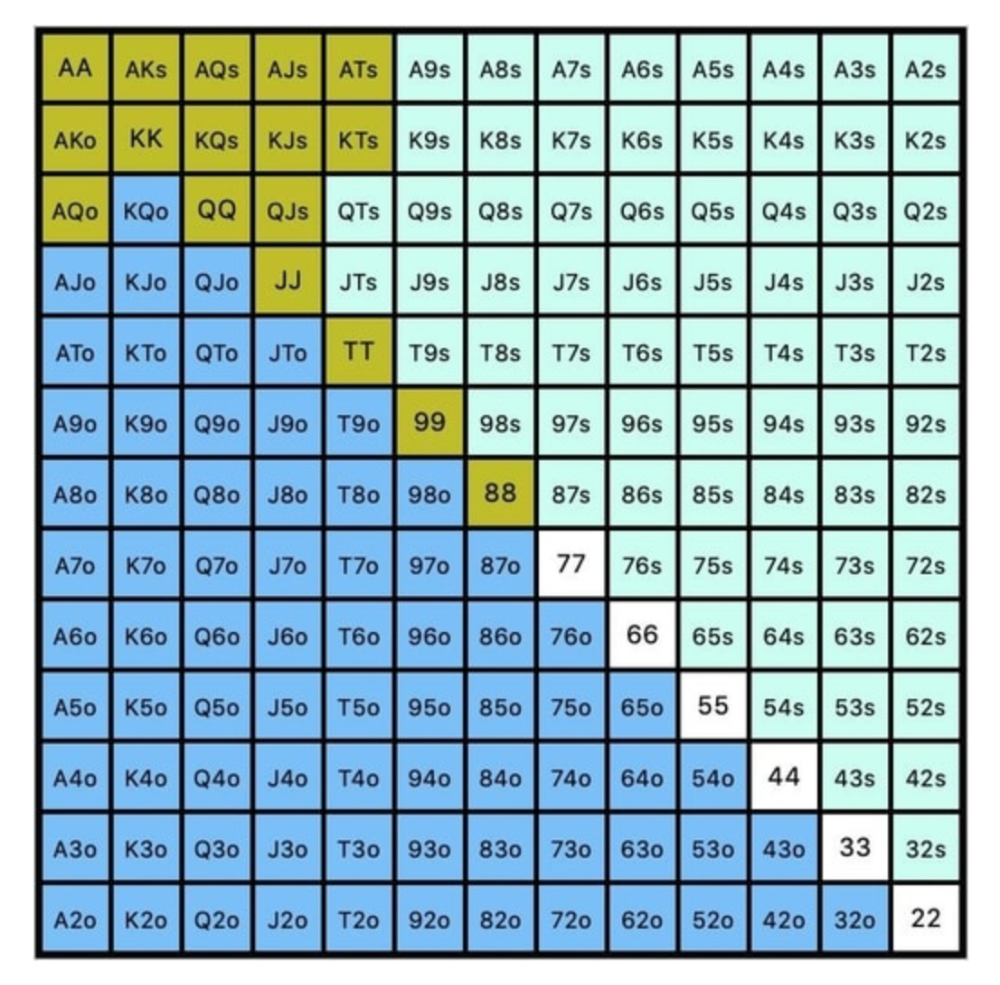
Polarized Hand range (7.54%):
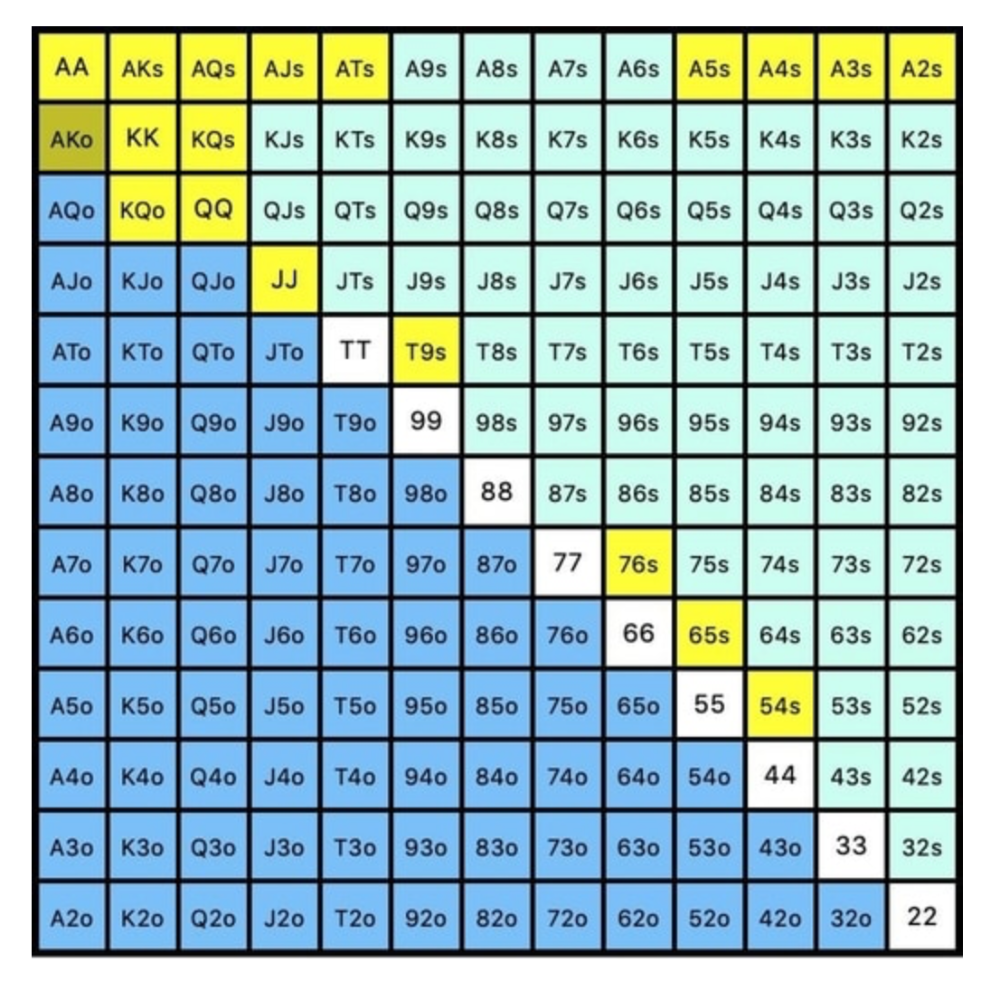
Each hand range has different contents. We don't know if he 3bets some hands and calls or folds others.
Using an exploitable strategy can help you play a hand range correctly. The next GTO concept will make things easier.
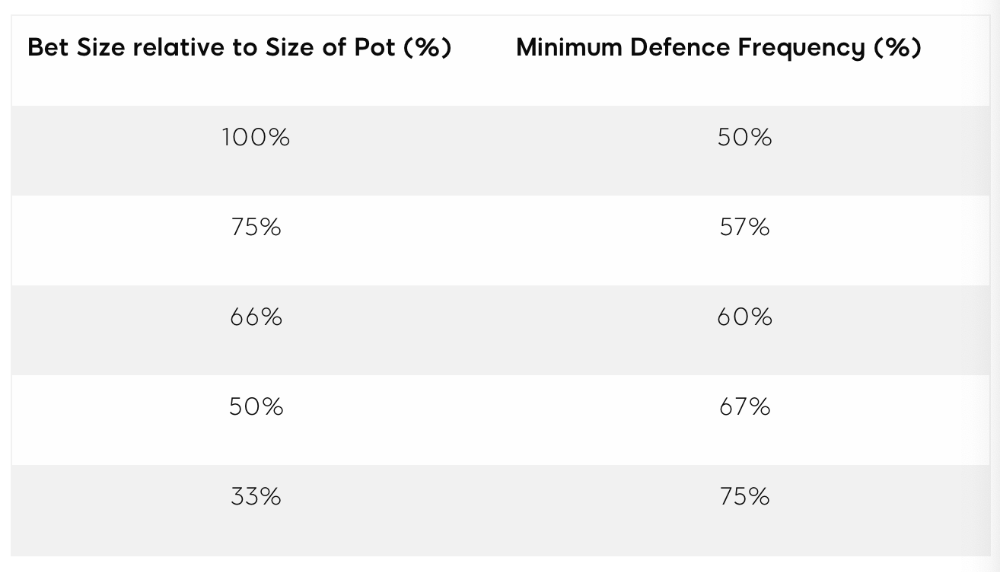
3. Minimum Defense Frequency:
This concept refers to the % of our range we must continue with (by calling or raising) to avoid being exploited by our opponents. This concept is most often used off-table and is difficult to apply in-game.
These beginner GTO concepts will help your decision-making during a hand, especially against aggressive opponents.
MDF formula:
MDF = POT SIZE/(POT SIZE+BET SIZE)
Here's a poker GTO chart of common bet sizes and minimum defense frequency.
Take the number of hand combos in your starting hand range and use the MDF to determine which hands to continue with. Choose hands with the most playability and equity against your opponent's betting range.
Say you open-raise HJ and BB calls. Qh9h6c flop. Your opponent leads you for a half-pot bet. MDF suggests keeping 67% of our range.
Using the above starting hand chart, we can determine that the HJ opens 254 combos:
We must defend 67% of these hands, or 170 combos, according to MDF. Hands we should keep include:
Flush draws
Open-Ended Straight Draws
Gut-Shot Straight Draws
Overcards
Any Pair or better
So, our flop continuing range could be:
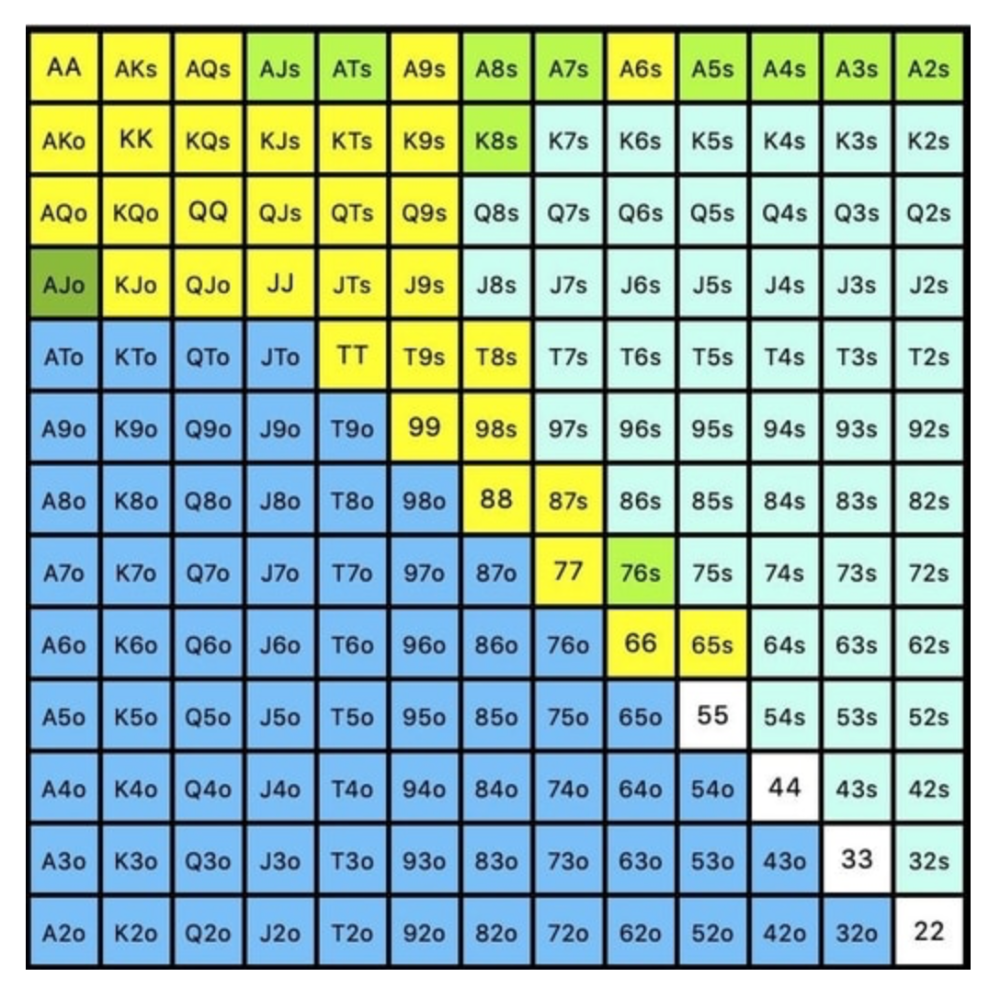
Some highlights:
Fours and fives have little chance of improving on the turn or river.
We only continue with AX hearts (with a flush draw) without a pair or better.
We'll also include 4 AJo combos, all of which have the Ace of hearts, and AcJh, which can block a backdoor nut flush combo.
Let's assume all these hands are called and the turn is blank (2 of spades). Opponent bets full-pot. MDF says we must defend 50% of our flop continuing range, or 85 of 170 combos, to be unexploitable. This strategy includes our best flush draws, straight draws, and made hands.
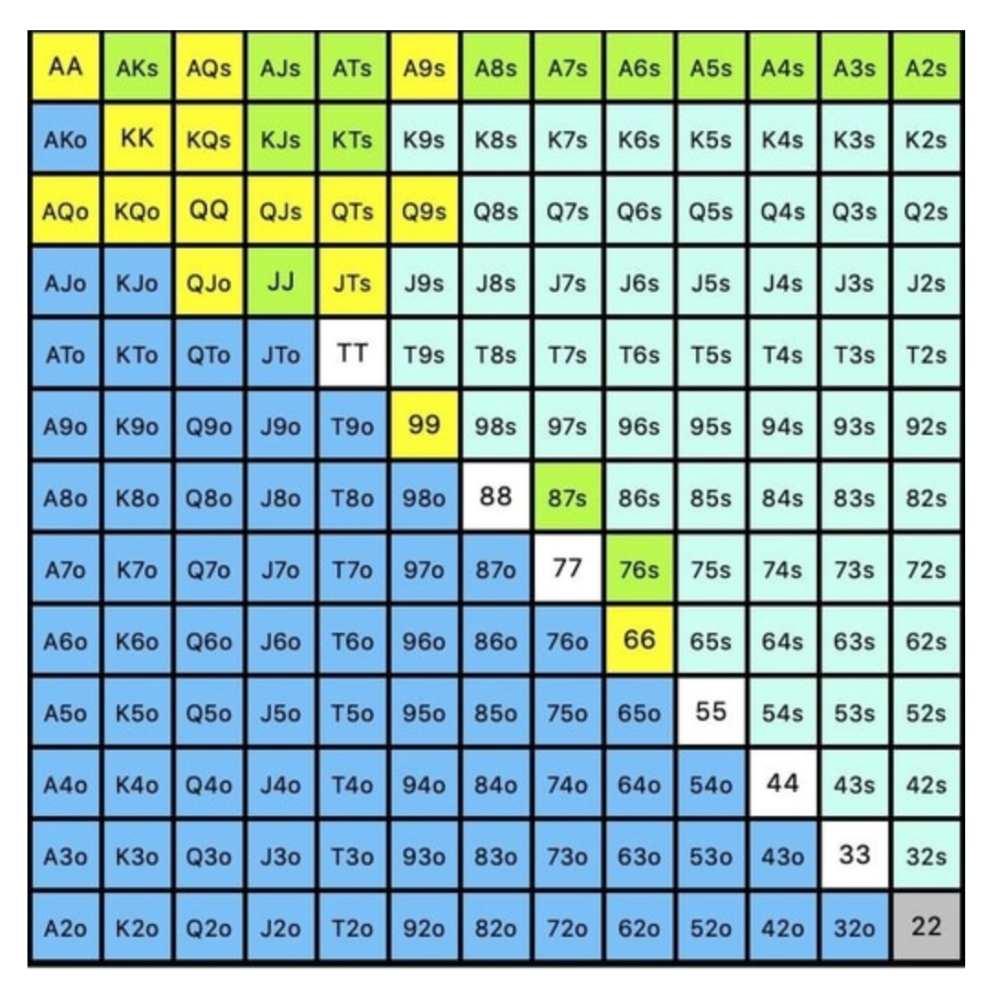
Here, we keep combining:
Nut flush draws
Pair + flush draws
GS + flush draws
Second Pair, Top Kicker+
One combo of JJ that doesn’t block the flush draw or backdoor flush draw.
On the river, we can fold our missed draws and keep our best made hands. When calling with weaker hands, consider blocker effects and card removal to avoid overcalling and decide which combos to continue.
4. Poker GTO Bet Sizing
To avoid being exploited, balance your bluffs and value bets. Your betting range depends on how much you bet (in relation to the pot). This concept only applies on the river, as draws (bluffs) on the flop and turn still have equity (and are therefore total bluffs).
On the flop, you want a 2:1 bluff-to-value-bet ratio. On the flop, there won't be as many made hands as on the river, and your bluffs will usually contain equity. The turn should have a "bluffing" ratio of 1:1. Use the chart below to determine GTO river bluff frequencies (relative to your bet size):
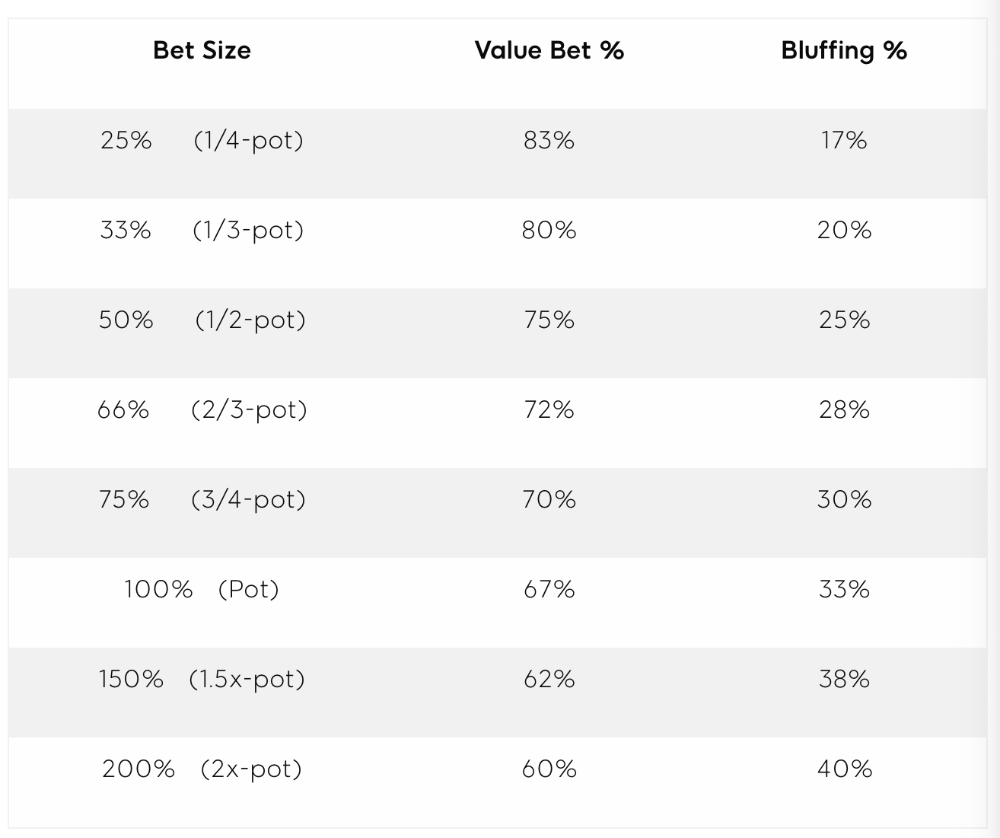
This chart relates to your opponent's pot odds. If you bet 50% pot, your opponent gets 3:1 odds and must win 25% of the time to call. Poker GTO theory suggests including 25% bluff combinations in your betting range so you're indifferent to your opponent calling or folding.
Best river bluffs don't block hands you want your opponent to have (or not have). For example, betting with missed Ace-high flush draws is often a mistake because you block a missed flush draw you want your opponent to have when bluffing on the river (meaning that it would subsequently be less likely he would have it, if you held two of the flush draw cards). Ace-high usually has some river showdown value.
If you had a 3-flush on the river and wanted to raise, you could bluff raise with AX combos holding the bluff suit Ace. Blocking the nut flush prevents your opponent from using that combo.
5. Bet Sizes and Frequency
GTO beginner strategies aren't just bluffs and value bets. They show how often and how much to bet in certain spots. Top players have benefited greatly from poker solvers, which we'll discuss next.
GTO Poker Software
In recent years, various poker GTO solvers have been released to help beginner, intermediate, and advanced players play balanced/GTO poker in various situations.
PokerSnowie and PioSolver are popular GTO and poker study programs.
While you can't compute players' hand ranges and what hands to bet or check with in real time, studying GTO play strategies with these programs will pay off. It will improve your poker thinking and understanding.
Solvers can help you balance ranges, choose optimal bet sizes, and master cbet frequencies.
GTO Poker Tournament
Late-stage tournaments have shorter stacks than cash games. In order to follow GTO poker guidelines, Nash charts have been created, tweaked, and used for many years (and also when to call, depending on what number of big blinds you have when you find yourself shortstacked).
The charts are for heads-up push/fold. In a multi-player game, the "pusher" chart can only be used if play is folded to you in the small blind. The "caller" chart can only be used if you're in the big blind and assumes a small blind "pusher" (with a much wider range than if a player in another position was open-shoving).
Divide the pusher chart's numbers by 2 to see which hand to use from the Button. Divide the original chart numbers by 4 to find the CO's pushing range. Some of the figures will be impossible to calculate accurately for the CO or positions to the right of the blinds because the chart's highest figure is "20+" big blinds, which is also used for a wide range of hands in the push chart.
Both of the GTO charts below are ideal for heads-up play, but exploitable HU shortstack strategies can lead to more +EV decisions against certain opponents. Following the charts will make your play GTO and unexploitable.
Poker pro Max Silver created the GTO push/fold software SnapShove. (It's accessible online at www.snapshove.com or as iOS or Android apps.)
Players can access GTO shove range examples in the full version. (You can customize the number of big blinds you have, your position, the size of the ante, and many other options.)
In Conclusion
Due to the constantly changing poker landscape, players are always improving their skills. Exploitable strategies often yield higher profit margins than GTO-based approaches, but knowing GTO beginner and advanced concepts can give you an edge for a few reasons.
It creates a solid gameplay base.
Having a baseline makes it easier to exploit certain villains.
You can avoid leveling wars with your opponents by making sound poker decisions based on GTO strategy.
It doesn't require assuming opponents' play styles.
Not results-oriented.
This is just the beginning of GTO and poker theory. Consider investing in the GTO poker solver software listed above to improve your game.

Ash Parrish
4 years ago
Sonic Prime and indie games on Netflix
Netflix will stream Spiritfarer, Raji: An Ancient Epic, and Lucky Luna.
Netflix's Geeked Week brought a slew of announcements. The flurry of reveals for The Sandman, The Umbrella Academy season 3, One Piece, and more also included game and game-adjacent announcements.
Netflix released a teaser for Cuphead season 2 ahead of its August premiere, featuring more of Grey DeLisle's Ms. Chalice. DOTA: Dragon's Blood season 3 hits Netflix in August. Tekken, the fighting game that throws kids off cliffs, gets an anime, Tekken: Bloodline.
Netflix debuted a clip of Sonic Prime before Sonic Origins in June and Sonic Frontiers in 2022.
Castlevania: Nocturne will follow Richter Belmont.
Netflix is reviving licensed games with titles based on its shows. There's a Queen's Gambit chess game, a Shadow and Bone RPG, a La Casa de Papel heist adventure, and a Too Hot to Handle game where a pregnant woman must choose between stabbing her cheating ex or forgiving him.
Riot's rhythm platformer Hextech Mayhem debuted on Netflix last year, and now Netflix is adding games from Devolver Digital. Reigns: Three Kingdoms is a card game that lets players choose the fate of Three Kingdoms-era China by swiping left or right on cards. Spiritfarer, the "cozy game about death" from 2020, and Raji: An Ancient Epic are coming to Netflix. Poinpy, a vertical climber from the creator of Downwell, is now on Netflix.
Desta: The Memories Between is a turn-based strategy game set in dreams and memories.
Snowman's Lucky Luna will also be added soon.
With these games, Netflix is expanding beyond dinky mobile games — it plans to have 50 by the end of the year — and could be a serious platform for indies that want to expand into mobile. It takes gaming seriously.

Chris Moyse
4 years ago
Sony and LEGO raise $2 billion for Epic Games' metaverse
‘Kid-friendly’ project holds $32 billion valuation
Epic Games announced today that it has raised $2 billion USD from Sony Group Corporation and KIRKBI (holding company of The LEGO Group). Both companies contributed $1 billion to Epic Games' upcoming ‘metaverse' project.
“We need partners who share our vision as we reimagine entertainment and play. Our partnership with Sony and KIRKBI has found this,” said Epic Games CEO Tim Sweeney. A new metaverse will be built where players can have fun with friends and brands create creative and immersive experiences, as well as creators thrive.
Last week, LEGO and Epic Games announced their plans to create a family-friendly metaverse where kids can play, interact, and create in digital environments. The service's users' safety and security will be prioritized.
With this new round of funding, Epic Games' project is now valued at $32 billion.
“Epic Games is known for empowering creators large and small,” said KIRKBI CEO Sren Thorup Srensen. “We invest in trends that we believe will impact the world we and our children will live in. We are pleased to invest in Epic Games to support their continued growth journey, with a long-term focus on the future metaverse.”
Epic Games is expected to unveil its metaverse plans later this year, including its name, details, services, and release date.
You might also like

Camilla Dudley
4 years ago
How to gain Twitter followers: A 101 Guide
No wonder brands use Twitter to reach their audience. 53% of Twitter users buy new products first.
Twitter growth does more than make your brand look popular. It helps clients trust your business. It boosts your industry standing. It shows clients, prospects, and even competitors you mean business.
How can you naturally gain Twitter followers?
Share useful information
Post visual content
Tweet consistently
Socialize
Spread your @name everywhere.
Use existing customers
Promote followers
Share useful information
Twitter users join conversations and consume material. To build your followers, make sure your material appeals to them and gives value, whether it's sales, product lessons, or current events.
Use Twitter Analytics to learn what your audience likes.
Explore popular topics by utilizing relevant keywords and hashtags. Check out this post on how to use Twitter trends.
Post visual content
97% of Twitter users focus on images, so incorporating media can help your Tweets stand out. Visuals and videos make content more engaging and memorable.
Tweet often
Your audience should expect regular content updates. Plan your ideas and tweet during crucial seasons and events with a content calendar.
Socialize
Twitter connects people. Do more than tweet. Follow industry leaders. Retweet influencers, engage with thought leaders, and reply to mentions and customers to boost engagement.
Micro-influencers can promote your brand or items. They can help you gain new audiences' trust.
Spread your @name everywhere.
Maximize brand exposure. Add a follow button on your website, link to it in your email signature and newsletters, and promote it on business cards or menus.
Use existing customers
Emails can be used to find existing Twitter clients. Upload your email contacts and follow your customers on Twitter to start a dialogue.
Promote followers
Run a followers campaign to boost your organic growth. Followers campaigns promote your account to a particular demographic, and you only pay when someone follows you.
Consider short campaigns to enhance momentum or an always-on campaign to gain new followers.
Increasing your brand's Twitter followers takes effort and experimentation, but the payback is huge.
👋 Follow me on twitter

Desiree Peralta
3 years ago
Why Now Is Your Chance To Create A Millionaire Career
People don’t believe in influencers anymore; they need people like you.
Social media influencers have dominated for years. We've seen videos, images, and articles of *famous* individuals unwrapping, reviewing, and endorsing things.
This industry generates billions. This year, marketers spent $2.23 billion on Instagram, $1 million on Youtube, and $775 million on Tiktok. This marketing has helped start certain companies.
Influencers are dying, so ordinary people like us may take over this billion-dollar sector. Why?
Why influencers are perishing
Most influencers lie to their fans, especially on Instagram. Influencers' first purpose was to make their lives so flawless that others would want to buy their stuff.
In 2015, an Australian influencer with 600,000 followers went viral for revealing all her photos and everything she did to seem great before deleting her account.
“I dramatically edited the pictures, I manipulated the environements, and made my life look perfect in social media… I remember I obsessively checked the like count for a full week since uploading it, a selfie that now has close to 2,500 likes. It got 5 likes. This was when I was so hungry for social media validation … This was the reason why I quit social media: for me, personally, it consumed me. I wasn’t living in a 3D world.”
Influencers then lost credibility.
Influencers seem to live in a bubble, separate from us. Thanks to self-popularity love's and constant awareness campaigns, people find these people ridiculous.
Influencers are praised more for showing themselves as natural and common than for showing luxuries and lies.
Little by little, they are dying, making room for a new group to take advantage of this multi-million dollar business, which gives us (ordinary people) a big opportunity to grow on any content creation platform we want.
Why this is your chance to develop on any platform for creating content
In 2021, I wrote “Not everyone who talks about money is a Financial Advisor, be careful of who you take advice from,”. In it, I warned that not everyone with a large following is a reputable source of financial advice.
Other writers hated this post and said I was wrong.
People don't want Jeff Bezos or Elon Musk's counsel, they said. They prefer to hear about their neighbor's restroom problems or his closest friend's terrible business.
Real advice from regular folks.
And I found this was true when I returned to my independent YouTube channel and had more than 1000 followers after having abandoned it with fewer than 30 videos in 2021 since there were already many personal finance and travel channels and I thought mine wasn't special.
People appreciated my videos because I was a 20-something girl trying to make money online, and they believed my advice more than that of influencers with thousands of followers.
I think today is the greatest time to grow on any platform as an ordinary person. Normal individuals give honest recommendations about what works for them and look easier to make because they have the same options as us.
Nobody cares how a millionaire acquired a Lamborghini unless it's entertaining. Education works now. Real counsel from average people is replicable.
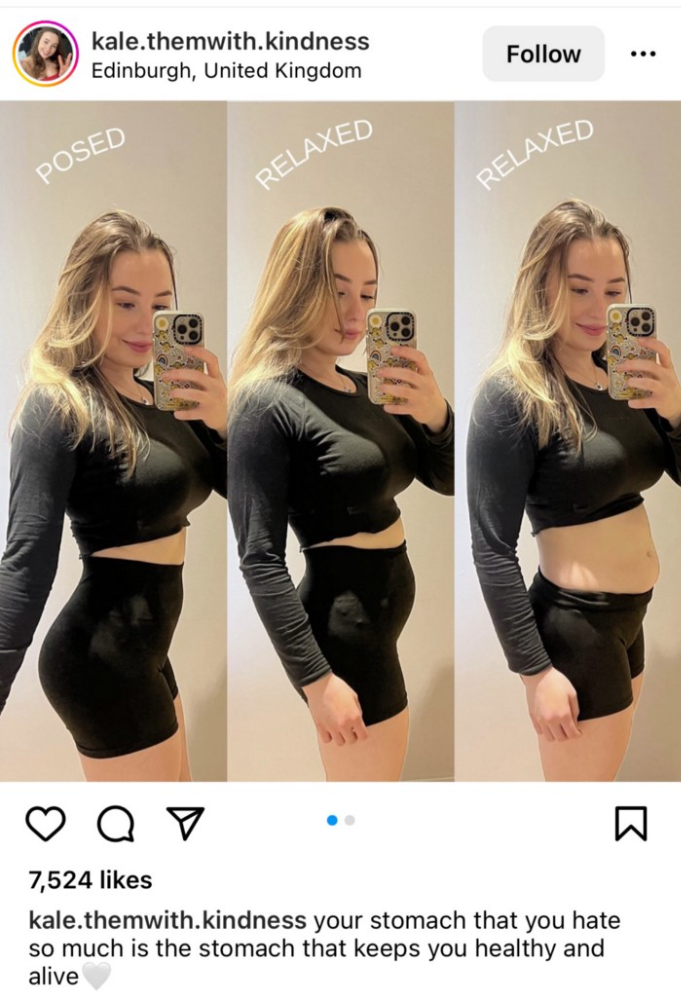
Many individuals don't appreciate how false influencers seem (unreal bodies and excessive surgery and retouching) since it makes them feel uneasy.
That's why body-positive advertisements have been so effective, but they've lost ground in places like Tiktok, where the audience wants more content from everyday people than influencers living amazing lives. More people will relate to your content if you appear genuine.
Last thoughts
Influencers are dwindling. People want more real people to give real advice and demonstrate an ordinary life.
People will enjoy anything you tell about your daily life as long as you provide value, and you can build a following rapidly if you're honest.
This is a millionaire industry that is getting more expensive and will go with what works, so stand out immediately.

Cammi Pham
3 years ago
7 Scientifically Proven Things You Must Stop Doing To Be More Productive
Smarter work yields better results.

17-year-old me worked and studied 20 hours a day. During school breaks, I did coursework and ran a nonprofit at night. Long hours earned me national campaigns, A-list opportunities, and a great career. As I aged, my thoughts changed. Working harder isn't necessarily the key to success.
In some cases, doing less work might lead to better outcomes.
Consider a hard-working small business owner. He can't beat his corporate rivals by working hard. Time's limited. An entrepreneur can work 24 hours a day, 7 days a week, but a rival can invest more money, create a staff, and put in more man hours. Why have small startups done what larger companies couldn't? Facebook paid $1 billion for 13-person Instagram. Snapchat, a 30-person startup, rejected Facebook and Google bids. Luck and efficiency each contributed to their achievement.
The key to success is not working hard. It’s working smart.
Being busy and productive are different. Busy doesn't always equal productive. Productivity is less about time management and more about energy management. Life's work. It's using less energy to obtain more rewards. I cut my work week from 80 to 40 hours and got more done. I value simplicity.
Here are seven activities I gave up in order to be more productive.
1. Give up working extra hours and boost productivity instead.
When did the five-day, 40-hour work week start? Henry Ford, Ford Motor Company founder, experimented with his workers in 1926.
He decreased their daily hours from 10 to 8, and shortened the work week from 6 days to 5. As a result, he saw his workers’ productivity increase.
According to a 1980 Business Roundtable report, Scheduled Overtime Effect on Construction Projects, the more you work, the less effective and productive you become.
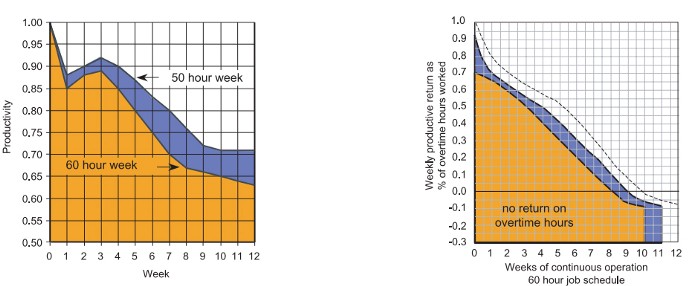
“Where a work schedule of 60 or more hours per week is continued longer than about two months, the cumulative effect of decreased productivity will cause a delay in the completion date beyond that which could have been realized with the same crew size on a 40-hour week.” Source: Calculating Loss of Productivity Due to Overtime Using Published Charts — Fact or Fiction
AlterNet editor Sara Robinson cited US military research showing that losing one hour of sleep per night for a week causes cognitive impairment equivalent to a.10 blood alcohol level. You can get fired for showing up drunk, but an all-nighter is fine.
Irrespective of how well you were able to get on with your day after that most recent night without sleep, it is unlikely that you felt especially upbeat and joyous about the world. Your more-negative-than-usual perspective will have resulted from a generalized low mood, which is a normal consequence of being overtired. More important than just the mood, this mind-set is often accompanied by decreases in willingness to think and act proactively, control impulses, feel positive about yourself, empathize with others, and generally use emotional intelligence. Source: The Secret World of Sleep: The Surprising Science of the Mind at Rest
To be productive, don't overwork and get enough sleep. If you're not productive, lack of sleep may be to blame. James Maas, a sleep researcher and expert, said 7/10 Americans don't get enough sleep.
Did you know?
Leonardo da Vinci slept little at night and frequently took naps.
Napoleon, the French emperor, had no qualms about napping. He splurged every day.
Even though Thomas Edison felt self-conscious about his napping behavior, he regularly engaged in this ritual.
President Franklin D. Roosevelt's wife Eleanor used to take naps before speeches to increase her energy.
The Singing Cowboy, Gene Autry, was known for taking regular naps in his dressing area in between shows.
Every day, President John F. Kennedy took a siesta after eating his lunch in bed.
Every afternoon, oil businessman and philanthropist John D. Rockefeller took a nap in his office.
It was unavoidable for Winston Churchill to take an afternoon snooze. He thought it enabled him to accomplish twice as much each day.
Every afternoon around 3:30, President Lyndon B. Johnson took a nap to divide his day into two segments.
Ronald Reagan, the 40th president, was well known for taking naps as well.
Source: 5 Reasons Why You Should Take a Nap Every Day — Michael Hyatt
Since I started getting 7 to 8 hours of sleep a night, I've been more productive and completed more work than when I worked 16 hours a day. Who knew marketers could use sleep?
2. Refrain from accepting too frequently
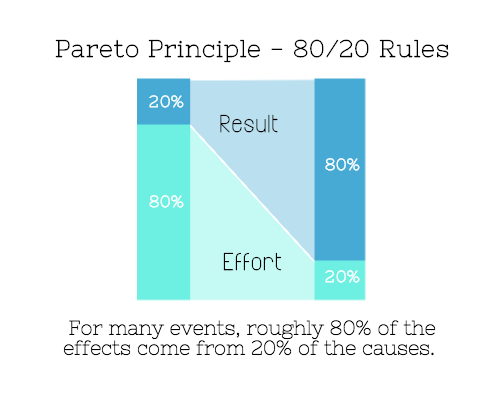
Pareto's principle states that 20% of effort produces 80% of results, but 20% of results takes 80% of effort. Instead of working harder, we should prioritize the initiatives that produce the most outcomes. So we can focus on crucial tasks. Stop accepting unproductive tasks.
“The difference between successful people and very successful people is that very successful people say “no” to almost everything.” — Warren Buffett
What should you accept? Why say no? Consider doing a split test to determine if anything is worth your attention. Track what you do, how long it takes, and the consequences. Then, evaluate your list to discover what worked (or didn't) to optimize future chores.
Most of us say yes more often than we should, out of guilt, overextension, and because it's simpler than no. Nobody likes being awful.
Researchers separated 120 students into two groups for a 2012 Journal of Consumer Research study. One group was educated to say “I can't” while discussing choices, while the other used “I don't”.
The students who told themselves “I can’t eat X” chose to eat the chocolate candy bar 61% of the time. Meanwhile, the students who told themselves “I don’t eat X” chose to eat the chocolate candy bars only 36% of the time. This simple change in terminology significantly improved the odds that each person would make a more healthy food choice.
Next time you need to say no, utilize I don't to encourage saying no to unimportant things.
The 20-second rule is another wonderful way to avoid pursuits with little value. Add a 20-second roadblock to things you shouldn't do or bad habits you want to break. Delete social media apps from your phone so it takes you 20 seconds to find your laptop to access them. You'll be less likely to engage in a draining hobby or habit if you add an inconvenience.
Lower the activation energy for habits you want to adopt and raise it for habits you want to avoid. The more we can lower or even eliminate the activation energy for our desired actions, the more we enhance our ability to jump-start positive change. Source: The Happiness Advantage: The Seven Principles of Positive Psychology That Fuel Success and Performance at Work
3. Stop doing everything yourself and start letting people help you
I once managed a large community and couldn't do it alone. The community took over once I burned out. Members did better than I could have alone. I learned about community and user-generated content.
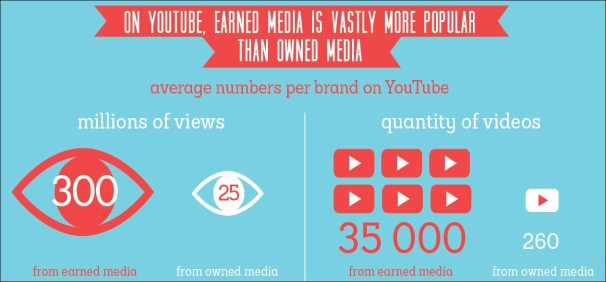
Consumers know what they want better than marketers. Octoly says user-generated videos on YouTube are viewed 10 times more than brand-generated videos. 51% of Americans trust user-generated material more than a brand's official website (16%) or media coverage (22%). (14 percent). Marketers should seek help from the brand community.
Being a successful content marketer isn't about generating the best content, but cultivating a wonderful community.
We should seek aid when needed. We can't do everything. It's best to delegate work so you may focus on the most critical things. Instead of overworking or doing things alone, let others help.
Having friends or coworkers around can boost your productivity even if they can't help.
Just having friends nearby can push you toward productivity. “There’s a concept in ADHD treatment called the ‘body double,’ ” says David Nowell, Ph.D., a clinical neuropsychologist from Worcester, Massachusetts. “Distractable people get more done when there is someone else there, even if he isn’t coaching or assisting them.” If you’re facing a task that is dull or difficult, such as cleaning out your closets or pulling together your receipts for tax time, get a friend to be your body double. Source: Friendfluence: The Surprising Ways Friends Make Us Who We Are
4. Give up striving for perfection
Perfectionism hinders professors' research output. Dr. Simon Sherry, a psychology professor at Dalhousie University, did a study on perfectionism and productivity. Dr. Sherry established a link between perfectionism and productivity.
Perfectionism has its drawbacks.
They work on a task longer than necessary.
They delay and wait for the ideal opportunity. If the time is right in business, you are already past the point.
They pay too much attention to the details and miss the big picture.
Marketers await the right time. They miss out.
The perfect moment is NOW.
5. Automate monotonous chores instead of continuing to do them.
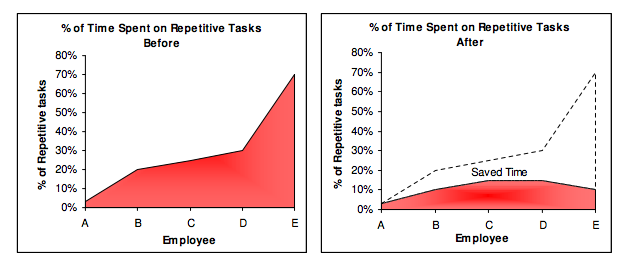
A team of five workers who spent 3%, 20%, 25%, 30%, and 70% of their time on repetitive tasks reduced their time spent to 3%, 10%, 15%, 15%, and 10% after two months of working to improve their productivity.
Last week, I wrote a 15-minute Python program. I wanted to generate content utilizing Twitter API data and Hootsuite to bulk schedule it. Automation has cut this task from a day to five minutes. Whenever I do something more than five times, I try to automate it.
Automate monotonous chores without coding. Skills and resources are nice, but not required. If you cannot build it, buy it.
People forget time equals money. Manual work is easy and requires little investigation. You can moderate 30 Instagram photographs for your UGC campaign. You need digital asset management software to manage 30,000 photographs and movies from five platforms. Filemobile helps individuals develop more user-generated content. You may buy software to manage rich media and address most internet difficulties.
Hire an expert if you can't find a solution. Spend money to make money, and time is your most precious asset.
Visit GitHub or Google Apps Script library, marketers. You may often find free, easy-to-use open source code.
6. Stop relying on intuition and start supporting your choices with data.
You may optimize your life by optimizing webpages for search engines.
Numerous studies might help you boost your productivity. Did you know individuals are most distracted from midday to 4 p.m.? This is what a Penn State psychology professor found. Even if you can't find data on a particular question, it's easy to run a split test and review your own results.
7. Stop working and spend some time doing absolutely nothing.
Most people don't know that being too focused can be destructive to our work or achievements. The Boston Globe's The Power of Lonely says solo time is excellent for the brain and spirit.
One ongoing Harvard study indicates that people form more lasting and accurate memories if they believe they’re experiencing something alone. Another indicates that a certain amount of solitude can make a person more capable of empathy towards others. And while no one would dispute that too much isolation early in life can be unhealthy, a certain amount of solitude has been shown to help teenagers improve their moods and earn good grades in school. Source: The Power of Lonely
Reflection is vital. We find solutions when we're not looking.
We don't become more productive overnight. It demands effort and practice. Waiting for change doesn't work. Instead, learn about your body and identify ways to optimize your energy and time for a happy existence.