


More on Marketing

Rita McGrath
3 years ago
Flywheels and Funnels
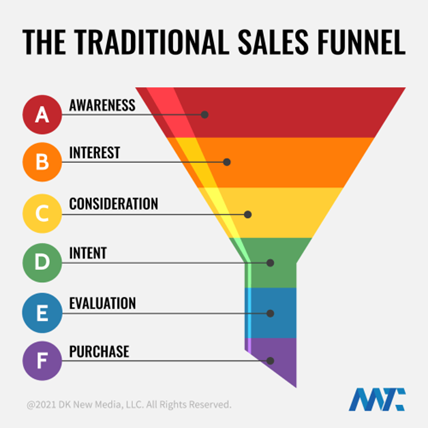
Traditional sales organizations used the concept of a sales “funnel” to describe the process through which potential customers move, ending up with sales at the end. Winners today have abandoned that way of thinking in favor of building flywheels — business models in which every element reinforces every other.
Ah, the marketing funnel…
Prospective clients go through a predictable set of experiences, students learn in business school marketing classes. It looks like this:
Understanding the funnel helps evaluate sales success indicators. Gail Goodwin, former CEO of small business direct mail provider Constant Contact, said managing the pipeline was key to escaping the sluggish SaaS ramp of death.
Like the funnel concept. To predict how well your business will do, measure how many potential clients are aware of it (awareness) and how many take the next step. If 1,000 people heard about your offering and 10% showed interest, you'd have 100 at that point. If 50% of these people made buyer-like noises, you'd know how many were, etc. It helped model buying trends.
TV, magazine, and radio advertising are pricey for B2C enterprises. Traditional B2B marketing involved armies of sales reps, which was expensive and a barrier to entry.
Cracks in the funnel model
Digital has exposed the funnel's limitations. Hubspot was born at a time when buyers and sellers had huge knowledge asymmetries, according to co-founder Brian Halligan. Those selling a product could use the buyer's lack of information to become a trusted partner.
As the world went digital, getting information and comparing offerings became faster, easier, and cheaper. Buyers didn't need a seller to move through a funnel. Interactions replaced transactions, and the relationship didn't end with a sale.
Instead, buyers and sellers interacted in a constant flow. In many modern models, the sale is midway through the process (particularly true with subscription and software-as-a-service models). Example:
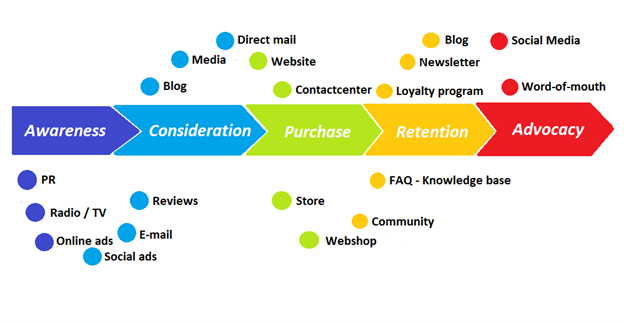
You're creating a winding journey with many touch points, not a funnel (and lots of opportunities for customers to get lost).
From winding journey to flywheel
Beyond this revised view of an interactive customer journey, a company can create what Jim Collins famously called a flywheel. Imagine rolling a heavy disc on its axis. The first few times you roll it, you put in a lot of effort for a small response. The same effort yields faster turns as it gains speed. Over time, the flywheel gains momentum and turns without your help.
Modern digital organizations have created flywheel business models, in which any additional force multiplies throughout the business. The flywheel becomes a force multiplier, according to Collins.
Amazon is a famous flywheel example. Collins explained the concept to Amazon CEO Jeff Bezos at a corporate retreat in 2001. In The Everything Store, Brad Stone describes in his book The Everything Store how he immediately understood Amazon's levers.
The result (drawn on a napkin):
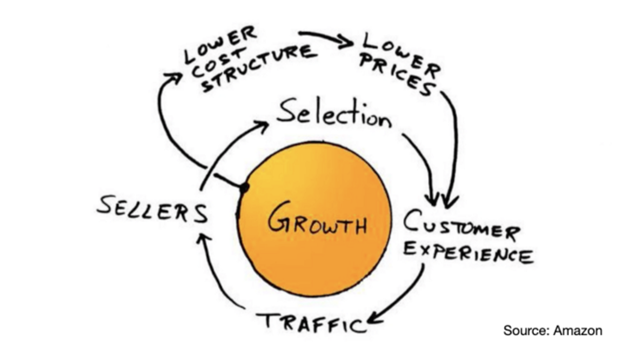
Low prices and a large selection of products attracted customers, while a focus on customer service kept them coming back, increasing traffic. Third-party sellers then increased selection. Low-cost structure supports low-price commitment. It's brilliant! Every wheel turn creates acceleration.
Where from here?
Flywheel over sales funnel! Consider these business terms.

Camilla Dudley
3 years ago
How to gain Twitter followers: A 101 Guide

No wonder brands use Twitter to reach their audience. 53% of Twitter users buy new products first.
Twitter growth does more than make your brand look popular. It helps clients trust your business. It boosts your industry standing. It shows clients, prospects, and even competitors you mean business.
How can you naturally gain Twitter followers?
Share useful information
Post visual content
Tweet consistently
Socialize
Spread your @name everywhere.
Use existing customers
Promote followers
Share useful information
Twitter users join conversations and consume material. To build your followers, make sure your material appeals to them and gives value, whether it's sales, product lessons, or current events.
Use Twitter Analytics to learn what your audience likes.
Explore popular topics by utilizing relevant keywords and hashtags. Check out this post on how to use Twitter trends.
Post visual content
97% of Twitter users focus on images, so incorporating media can help your Tweets stand out. Visuals and videos make content more engaging and memorable.
Tweet often
Your audience should expect regular content updates. Plan your ideas and tweet during crucial seasons and events with a content calendar.
Socialize
Twitter connects people. Do more than tweet. Follow industry leaders. Retweet influencers, engage with thought leaders, and reply to mentions and customers to boost engagement.
Micro-influencers can promote your brand or items. They can help you gain new audiences' trust.
Spread your @name everywhere.
Maximize brand exposure. Add a follow button on your website, link to it in your email signature and newsletters, and promote it on business cards or menus.
Use existing customers
Emails can be used to find existing Twitter clients. Upload your email contacts and follow your customers on Twitter to start a dialogue.
Promote followers
Run a followers campaign to boost your organic growth. Followers campaigns promote your account to a particular demographic, and you only pay when someone follows you.
Consider short campaigns to enhance momentum or an always-on campaign to gain new followers.
Increasing your brand's Twitter followers takes effort and experimentation, but the payback is huge.
👋 Follow me on twitter

Saskia Ketz
2 years ago
I hate marketing for my business, but here's how I push myself to keep going
Start now.

When it comes to building my business, I’m passionate about a lot of things. I love creating user experiences that simplify branding essentials. I love creating new typefaces and color combinations to inspire logo designers. I love fixing problems to improve my product.
Business marketing isn't my thing.
This is shared by many. Many solopreneurs, like me, struggle to advertise their business and drive themselves to work on it.
Without a lot of promotion, no company will succeed. Marketing is 80% of developing a firm, and when you're starting out, it's even more. Some believe that you shouldn't build anything until you've begun marketing your idea and found enough buyers.
Marketing your business without marketing experience is difficult. There are various outlets and techniques to learn. Instead of figuring out where to start, it's easier to return to your area of expertise, whether that's writing, designing product features, or improving your site's back end. Right?
First, realize that your role as a founder is to market your firm. Being a founder focused on product, I rarely work on it.
Secondly, use these basic methods that have helped me dedicate adequate time and focus to marketing. They're all simple to apply, and they've increased my business's visibility and success.
1. Establish buckets for every task.
You've probably heard to schedule tasks you don't like. As simple as it sounds, blocking a substantial piece of my workday for marketing duties like LinkedIn or Twitter outreach, AppSumo customer support, or SEO has forced me to spend time on them.
Giving me lots of room to focus on product development has helped even more. Sure, this means scheduling time to work on product enhancements after my four-hour marketing sprint.
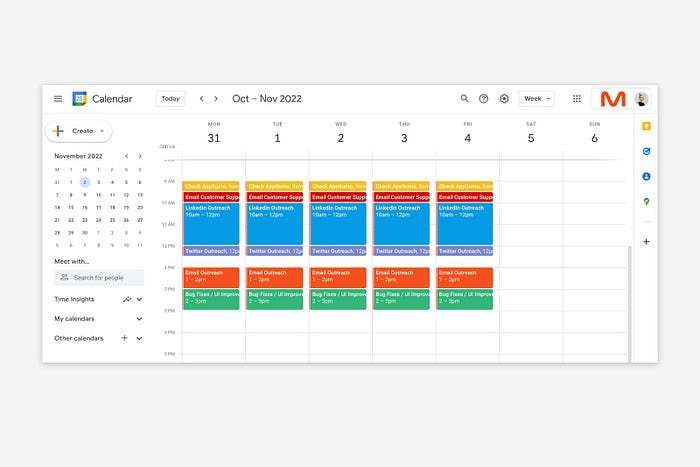
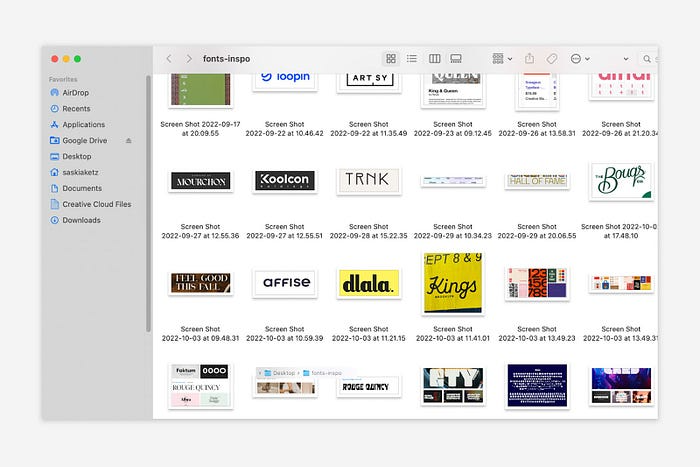
It also involves making space to store product inspiration and ideas throughout the day so I don't get distracted. This is like the advice to keep a notebook beside your bed to write down your insomniac ideas. I keep fonts, color palettes, and product ideas in folders on my desktop. Knowing these concepts won't be lost lets me focus on marketing in the moment. When I have limited time to work on something, I don't have to conduct the research I've been collecting, so I can get more done faster.
2. Look for various accountability systems
Accountability is essential for self-discipline. To keep focused on my marketing tasks, I've needed various streams of accountability, big and little.
Accountability groups are great for bigger things. SaaS Camp, a sales outreach coaching program, is mine. We discuss marketing duties and results every week. This motivates me to do enough each week to be proud of my accomplishments. Yet hearing what works (or doesn't) for others gives me benchmarks for my own marketing outcomes and plenty of fresh techniques to attempt.
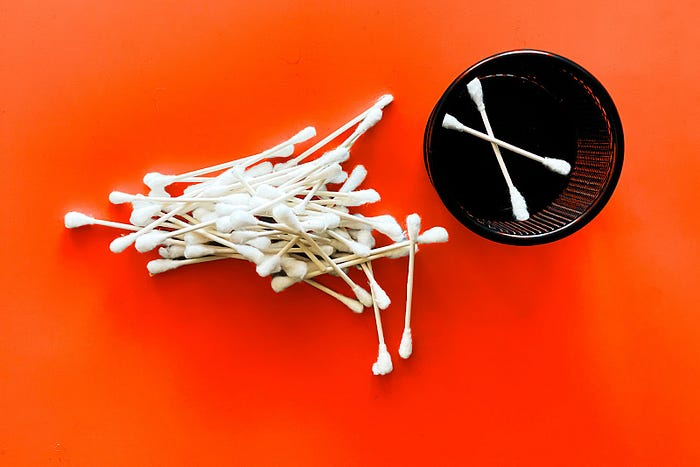
… say, I want to DM 50 people on Twitter about my product — I get that many Q-tips and place them in one pen holder on my desk.
The best accountability group can't watch you 24/7. I use a friend's simple method that shouldn't work (but it does). When I have a lot of marketing chores, like DMing 50 Twitter users about my product, That many Q-tips go in my desk pen holder. After each task, I relocate one Q-tip to an empty pen holder. When you have a lot of minor jobs to perform, it helps to see your progress. You might use toothpicks, M&Ms, or anything else you have a lot of.
3. Continue to monitor your feedback loops
Knowing which marketing methods work best requires monitoring results. As an entrepreneur with little go-to-market expertise, every tactic I pursue is an experiment. I need to know how each trial is doing to maximize my time.
I placed Google and Facebook advertisements on hold since they took too much time and money to obtain Return. LinkedIn outreach has been invaluable to me. I feel that talking to potential consumers one-on-one is the fastest method to grasp their problem areas, figure out my messaging, and find product market fit.
Data proximity offers another benefit. Seeing positive results makes it simpler to maintain doing a work you don't like. Why every fitness program tracks progress.
Marketing's goal is to increase customers and revenues, therefore I've found it helpful to track those metrics and celebrate monthly advances. I provide these updates for extra accountability.
Finding faster feedback loops is also motivating. Marketing brings more clients and feedback, in my opinion. Product-focused founders love that feedback. Positive reviews make me proud that my product is benefitting others, while negative ones provide me with suggestions for product changes that can improve my business.
The best advice I can give a lone creator who's afraid of marketing is to just start. Start early to learn by doing and reduce marketing stress. Start early to develop habits and successes that will keep you going. The sooner you start, the sooner you'll have enough consumers to return to your favorite work.
You might also like
Blake Montgomery
3 years ago
Explaining Twitter Files
Elon Musk, Matt Taibbi, the 'Twitter Files,' and Hunter Biden's laptop: what gives?
Explaining Twitter Files
Matt Taibbi released "The Twitter Files," a batch of emails sent by Twitter executives discussing the company's decision to stop an October 2020 New York Post story online.
What's on Twitter? New York Post and Fox News call them "bombshell" documents. Or, as a Post columnist admitted, are they "not the smoking gun"? Onward!
What started this?
The New York Post published an exclusive, potentially explosive story in October 2020: Biden's Secret Emails: Ukrainian executive thanks Hunter Biden for'meeting' veep dad. The story purported to report the contents of a laptop brought to the tabloid by a Delaware computer repair shop owner who said it belonged to President Biden's second son, Hunter Biden. Emails and files on the laptop allegedly showed how Hunter peddled influence with Ukranian businessmen and included a "raunchy 12-minute video" of Hunter smoking crack and having sex.
Twitter banned links to the Post story after it was published, calling it "hacked material." The Post's Twitter account was suspended for multiple days.
Why? Yoel Roth, Twitter's former head of trust and safety, said the company couldn't verify the story, implying they didn't trust the Post.
Twitter's stated purpose rarely includes verifying news stories. This seemed like intentional political interference. This story was hard to verify because the people who claimed to have found the laptop wouldn't give it to other newspapers. (Much of the story, including Hunter's business dealings in Ukraine and China, was later confirmed.)
Roth: "It looked like a hack and leak."
So what are the “Twitter Files?”
Twitter's decision to bury the story became a political scandal, and new CEO Elon Musk promised an explanation. The Twitter Files, named after Facebook leaks.
Musk promised exclusive details of "what really happened" with Hunter Biden late Friday afternoon. The tweet was punctuated with a popcorn emoji.
Explaining Twitter Files
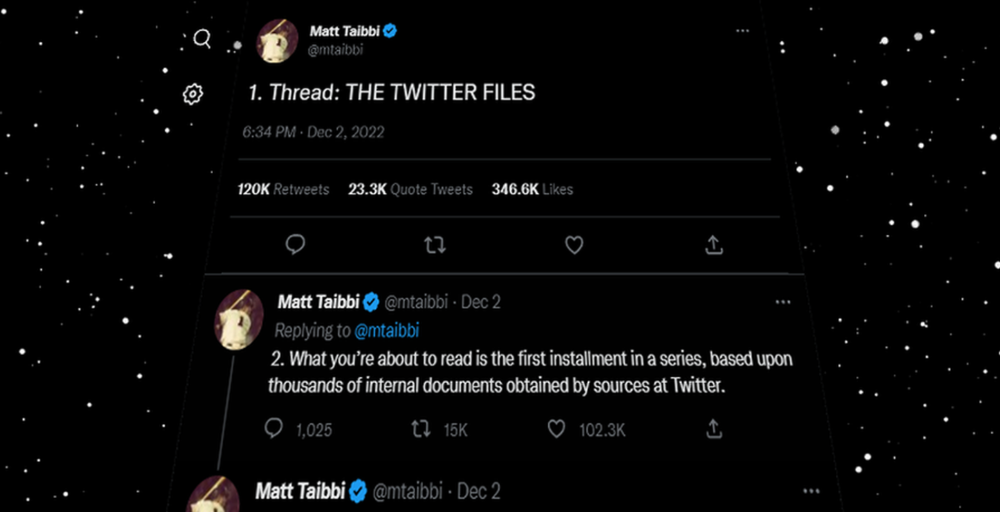
Three hours later, journalist Matt Taibbi tweeted more than three dozen tweets based on internal Twitter documents that revealed "a Frankensteinian tale of a human-built mechanism grown out of its designer's control."
Musk sees this release as a way to shape Twitter's public perception and internal culture in his image. We don't know if the CEO gave Taibbi the documents. Musk hyped the document dump before and during publication, but Taibbi cited "internal sources."
Taibbi shares email screenshots showing Twitter execs discussing the Post story and blocking its distribution. Taibbi says the emails show Twitter's "extraordinary steps" to bury the story.
Twitter communications chief Brandon Borrman has the most damning quote in the Files. Can we say this is policy? The story seemed unbelievable. It seemed like a hack... or not? Could Twitter, which ex-CEO Dick Costolo called "the free speech wing of the free speech party," censor a news story?
Many on the right say the Twitter Files prove the company acted at the behest of Democrats. Both parties had these tools, writes Taibbi. In 2020, both the Trump White House and Biden campaign made requests. He says the system for reporting tweets for deletion is unbalanced because Twitter employees' political donations favor Democrats. Perhaps. These donations may have helped Democrats connect with Twitter staff, but it's also possible they didn't. No emails in Taibbi's cache show these alleged illicit relations or any actions Twitter employees took as a result.
Even Musk's supporters were surprised by the drop. Miranda Devine of the New York Post told Tucker Carlson the documents weren't "the smoking gun we'd hoped for." Sebastian Gorka said on Truth Social, "So far, I'm deeply underwhelmed." DC Democrats collude with Palo Alto Democrats. Whoop!” The Washington Free Beacon's Joe Simonson said the Twitter files are "underwhelming." Twitter was staffed by Democrats who did their bidding. (Why?)
If "The Twitter Files" matter, why?
These emails led Twitter to suppress the Hunter Biden laptop story has real news value. It's rare for a large and valuable company like Twitter to address wrongdoing so thoroughly. Emails resemble FOIA documents. They describe internal drama at a company with government-level power. Katie Notopoulos tweeted, "Any news outlet would've loved this scoop!" It's not a'scandal' as teased."
Twitter's new owner calls it "the de facto public town square," implying public accountability. Like a government agency. Though it's exciting to receive once-hidden documents in response to a FOIA, they may be boring and tell you nothing new. Like Twitter files. We learned how Twitter blocked the Post's story, but not why. Before these documents were released, we knew Twitter had suppressed the story and who was involved.
These people were disciplined and left Twitter. Musk fired Vijaya Gadde, the former CLO who reportedly played a "key role" in the decision. Roth quit over Musk's "dictatorship." Musk arrived after Borrman left. Jack Dorsey, then-CEO, has left. Did those who digitally quarantined the Post's story favor Joe Biden and the Democrats? Republican Party opposition and Trump hatred? New York Post distaste? According to our documents, no. Was there political and press interference? True. We knew.
Taibbi interviewed anonymous ex-Twitter employees about the decision; all expressed shock and outrage. One source said, "Everyone knew this was fucked." Since Taibbi doesn't quote that expletive, we can assume the leaked emails contained few or no sensational quotes. These executives said little to support nefarious claims.
Outlets more invested in the Hunter Biden story than Gizmodo seem vexed by the release and muted headlines. The New York Post, which has never shied away from a blaring headline in its 221-year history, owns the story of Hunter Biden's laptop. Two Friday-night Post alerts about Musk's actions were restrained. Elon Musk will drop Twitter files on NY Post-Hunter Biden laptop censorship today. Elon Musk's Twitter dropped Post censorship details from Biden's laptop. Fox News' Apple News push alert read, "Elon Musk drops Twitter censorship documents."
Bombshell, bombshell, bombshell… what, exactly, is the bombshell? Maybe we've heard this story too much and are missing the big picture. Maybe these documents detail a well-documented decision.
The Post explains why on its website. "Hunter Biden laptop bombshell: Twitter invented reason to censor Post's reporting," its headline says.
Twitter's ad hoc decision to moderate a tabloid's content is not surprising. The social network had done this for years as it battled toxic users—violent white nationalists, virulent transphobes, harassers and bullies of all political stripes, etc. No matter how much Musk crows, the company never had content moderation under control. Buzzfeed's 2016 investigation showed how Twitter has struggled with abusive posters since 2006. Jack Dorsey and his executives improvised, like Musk.
Did the US government interfere with the ex-social VP's media company? That's shocking, a bombshell. Musk said Friday, "Twitter suppressing free speech by itself is not a 1st amendment violation, but acting under government orders with no judicial review is." Indeed! Taibbi believed this. August 2022: "The laptop is secondary." Zeynep Tufecki, a Columbia professor and New York Times columnist, says the FBI is cutting true story distribution. Taibbi retracted the claim Friday night: "I've seen no evidence of government involvement in the laptop story."
What’s the bottom line?
I'm still not sure what's at stake in the Hunter Biden scandal after dozens of New York Post articles, hundreds of hours of Fox News airtime, and thousands of tweets. Briefly: Joe Biden's son left his laptop with a questionable repairman. FBI confiscated it? The repairman made a copy and gave it to Rudy Giuliani's lawyer. The Post got it from Steve Bannon. On that laptop were videos of Hunter Biden smoking crack, cavorting with prostitutes, and emails about introducing his father to a Ukrainian businessman for $50,000 a month. Joe Biden urged Ukraine to fire a prosecutor investigating the company. What? The story seems to be about Biden family business dealings, right?
The discussion has moved past that point anyway. Now, the story is the censorship of it. Adrienne Rich wrote in "Diving Into the Wreck" that she came for "the wreck and not the story of the wreck" No matter how far we go, Hunter Biden's laptop is done. Now, the crash's story matters.
I'm dizzy. Katherine Miller of BuzzFeed wrote, "I know who I believe, and you probably do, too. To believe one is to disbelieve the other, which implicates us in the decision; we're stuck." I'm stuck. Hunter Biden's laptop is a political fabrication. You choose. I've decided.
This could change. Twitter Files drama continues. Taibbi said, "Much more to come." I'm dizzy.

Glorin Santhosh
3 years ago
In his final days, Steve Jobs sent an email to himself. What It Said Was This
An email capturing Steve Jobs's philosophy.

Steve Jobs may have been the most inspired and driven entrepreneur.
He worked on projects because he wanted to leave a legacy.
Steve Jobs' final email to himself encapsulated his philosophy.
After his death from pancreatic cancer in October 2011, Laurene Powell Jobs released the email. He was 56.
Read: Steve Jobs by Walter Isaacson (#BestSeller)
The Email:
September 2010 Steve Jobs email:
“I grow little of the food I eat, and of the little I do grow, I do not breed or perfect the seeds.” “I do not make my own clothing. I speak a language I did not invent or refine,” he continued. “I did not discover the mathematics I use… I am moved by music I did not create myself.”
Jobs ended his email by reflecting on how others created everything he uses.
He wrote:
“When I needed medical attention, I was helpless to help myself survive.”
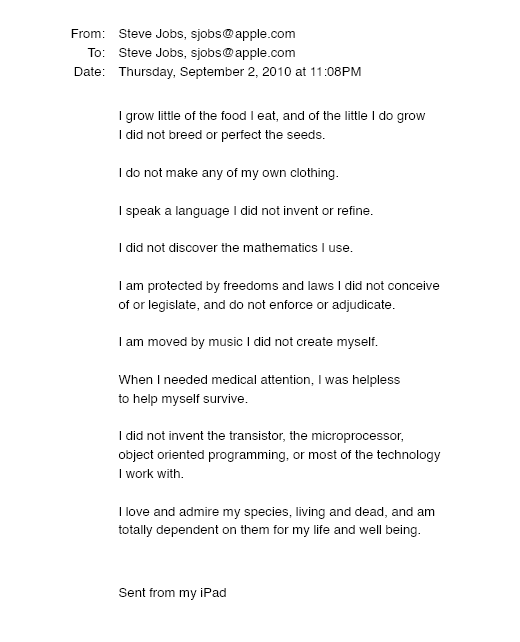
The Apple co-founder concluded by praising humanity.
“I did not invent the transistor, the microprocessor, object-oriented programming, or most of the technology I work with. I love and admire my species, living and dead, and am totally dependent on them for my life and well-being,” he concluded.
The email was made public as a part of the Steve Jobs Archive, a website that was launched in tribute to his legacy.
Steve Jobs' widow founded the internet archive. Apple CEO Tim Cook and former design leader Jony Ive were prominent guests.
Steve Jobs has always inspired because he shows how even the best can be improved.
High expectations were always there, and they were consistently met.
We miss him because he was one of the few with lifelong enthusiasm and persona.

Bloomberg
3 years ago
Expulsion of ten million Ukrainians
According to recent data from two UN agencies, ten million Ukrainians have been displaced.
The International Organization for Migration (IOM) estimates nearly 6.5 million Ukrainians have relocated. Most have fled the war zones around Kyiv and eastern Ukraine, including Dnipro, Zhaporizhzhia, and Kharkiv. Most IDPs have fled to western and central Ukraine.
Since Russia invaded on Feb. 24, 3.6 million people have crossed the border to seek refuge in neighboring countries, according to the latest UN data. While most refugees have fled to Poland and Romania, many have entered Russia.
Internally displaced figures are IOM estimates as of March 19, based on 2,000 telephone interviews with Ukrainians aged 18 and older conducted between March 9-16. The UNHCR compiled the figures for refugees to neighboring countries on March 21 based on official border crossing data and its own estimates. The UNHCR's top-line total is lower than the country totals because Romania and Moldova totals include people crossing between the two countries.
Sources: IOM, UNHCR
According to IOM estimates based on telephone interviews with a representative sample of internally displaced Ukrainians, over 53% of those displaced are women, and over 60% of displaced households have children.