


More on Leadership

William Anderson
3 years ago
When My Remote Leadership Skills Took Off
4 Ways To Manage Remote Teams & Employees
The wheels hit the ground as I landed in Rochester.
Our six-person satellite office was now part of my team.
Their manager only reported to me the day before, but I had my ticket booked ahead of time.
I had managed remote employees before but this was different. Engineers dialed into headquarters for every meeting.
So when I learned about the org chart change, I knew a strong first impression would set the tone for everything else.
I was either their boss, or their boss's boss, and I needed them to know I was committed.
Managing a fleet of satellite freelancers or multiple offices requires treating others as more than just a face behind a screen.
You must comprehend each remote team member's perspective and daily interactions.
The good news is that you can start using these techniques right now to better understand and elevate virtual team members.
1. Make Visits To Other Offices
If budgeted, visit and work from offices where teams and employees report to you. Only by living alongside them can one truly comprehend their problems with communication and other aspects of modern life.
2. Have Others Come to You
• Having remote, distributed, or satellite employees and teams visit headquarters every quarter or semi-quarterly allows the main office culture to rub off on them.
When remote team members visit, more people get to meet them, which builds empathy.
If you can't afford to fly everyone, at least bring remote managers or leaders. Hopefully they can resurrect some culture.
3. Weekly Work From Home
No home office policy?
Make one.
WFH is a team-building, problem-solving, and office-viewing opportunity.
For dial-in meetings, I started working from home on occasion.
It also taught me which teams “forget” or “skip” calls.
As a remote team member, you experience all the issues first hand.
This isn't as accurate for understanding teams in other offices, but it can be done at any time.
4. Increase Contact Even If It’s Just To Chat
Don't underestimate office banter.
Sometimes it's about bonding and trust, other times it's about business.
If you get all this information in real-time, please forward it.
Even if nothing critical is happening, call remote team members to check in and chat.
I guarantee that building relationships and rapport will increase both their job satisfaction and yours.

Caspar Mahoney
3 years ago
Changing Your Mindset From a Project to a Product
Product game mindsets? How do these vary from Project mindset?

1950s spawned the Iron Triangle. Project people everywhere know and live by it. In stakeholder meetings, it is used to stretch the timeframe, request additional money, or reduce scope.
Quality was added to this triangle as things matured.
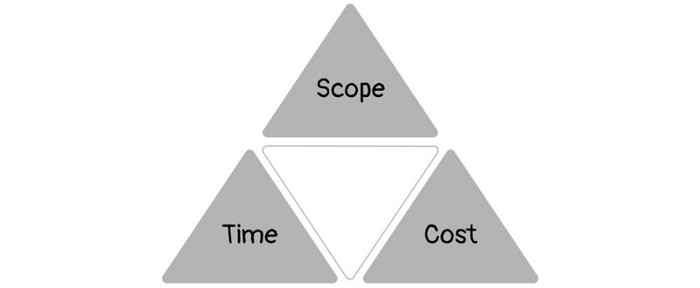
Quality was intended to be transformative, but none of these principles addressed why we conduct projects.
Value and benefits are key.
Product value is quantified by ROI, revenue, profit, savings, or other metrics. For me, every project or product delivery is about value.
Most project managers, especially those schooled 5-10 years or more ago (thousands working in huge corporations worldwide), understand the world in terms of the iron triangle. What does that imply? They worry about:
a) enough time to get the thing done.
b) have enough resources (budget) to get the thing done.
c) have enough scope to fit within (a) and (b) >> note, they never have too little scope, not that I have ever seen! although, theoretically, this could happen.
Boom—iron triangle.
To make the triangle function, project managers will utilize formal governance (Steering) to move those things. Increase money, scope, or both if time is short. Lacking funds? Increase time, scope, or both.
In current product development, shifting each item considerably may not yield value/benefit.
Even terrible. This approach will fail because it deprioritizes Value/Benefit by focusing the major stakeholders (Steering participants) and delivery team(s) on Time, Scope, and Budget restrictions.
Pre-agile, this problem was terrible. IT projects failed wildly. History is here.
Value, or benefit, is central to the product method. Product managers spend most of their time planning value-delivery paths.
Product people consider risk, schedules, scope, and budget, but value comes first. Let me illustrate.
Imagine managing internal products in an enterprise. Your core customer team needs a rapid text record of a chat to fix a problem. The consumer wants a feature/features added to a product you're producing because they think it's the greatest spot.
Project-minded, I may say;
Ok, I have budget as this is an existing project, due to run for a year. This is a new requirement to add to the features we’re already building. I think I can keep the deadline, and include this scope, as it sounds related to the feature set we’re building to give the desired result”.
This attitude repeats Scope, Time, and Budget.
Since it meets those standards, a project manager will likely approve it. If they have a backlog, they may add it and start specking it out assuming it will be built.
Instead, think like a product;
What problem does this feature idea solve? Is that problem relevant to the product I am building? Can that problem be solved quicker/better via another route ? Is it the most valuable problem to solve now? Is the problem space aligned to our current or future strategy? or do I need to alter/update the strategy?
A product mindset allows you to focus on timing, resource/cost, feasibility, feature detail, and so on after answering the aforementioned questions.
The above oversimplifies because
Leadership in discovery

Project managers are facilitators of ideas. This is as far as they normally go in the ‘idea’ space.
Business Requirements collection in classic project delivery requires extensive upfront documentation.
Agile project delivery analyzes requirements iteratively.
However, the project manager is a facilitator/planner first and foremost, therefore topic knowledge is not expected.
I mean business domain, not technical domain (to confuse matters, it is true that in some instances, it can be both technical and business domains that are important for a single individual to master).
Product managers are domain experts. They will become one if they are training/new.
They lead discovery.
Product Manager-led discovery is much more than requirements gathering.
Requirements gathering involves a Business Analyst interviewing people and documenting their requests.
The project manager calculates what fits and what doesn't using their Iron Triangle (presumably in their head) and reports back to Steering.
If this requirements-gathering exercise failed to identify requirements, what would a project manager do? or bewildered by project requirements and scope?
They would tell Steering they need a Business SME or Business Lead assigning or more of their time.
Product discovery requires the Product Manager's subject knowledge and a new mindset.
How should a Product Manager handle confusing requirements?
Product Managers handle these challenges with their talents and tools. They use their own knowledge to fill in ambiguity, but they have the discipline to validate those assumptions.
To define the problem, they may perform qualitative or quantitative primary research.
They might discuss with UX and Engineering on a whiteboard and test assumptions or hypotheses.
Do Product Managers escalate confusing requirements to Steering/Senior leaders? They would fix that themselves.
Product managers raise unclear strategy and outcomes to senior stakeholders. Open talks, soft skills, and data help them do this. They rarely raise requirements since they have their own means of handling them without top stakeholder participation.
Discovery is greenfield, exploratory, research-based, and needs higher-order stakeholder management, user research, and UX expertise.
Product Managers also aid discovery. They lead discovery. They will not leave customer/user engagement to a Business Analyst. Administratively, a business analyst could aid. In fact, many product organizations discourage business analysts (rely on PM, UX, and engineer involvement with end-users instead).
The Product Manager must drive user interaction, research, ideation, and problem analysis, therefore a Product professional must be skilled and confident.
Creating vs. receiving and having an entrepreneurial attitude

Product novices and project managers focus on details rather than the big picture. Project managers prefer spreadsheets to strategy whiteboards and vision statements.
These folks ask their manager or senior stakeholders, "What should we do?"
They then elaborate (in Jira, in XLS, in Confluence or whatever).
They want that plan populated fast because it reduces uncertainty about what's going on and who's supposed to do what.
Skilled Product Managers don't only ask folks Should we?
They're suggesting this, or worse, Senior stakeholders, here are some options. After asking and researching, they determine what value this product adds, what problems it solves, and what behavior it changes.
Therefore, to move into Product, you need to broaden your view and have courage in your ability to discover ideas, find insightful pieces of information, and collate them to form a valuable plan of action. You are constantly defining RoI and building Business Cases, so much so that you no longer create documents called Business Cases, it is simply ingrained in your work through metrics, intelligence, and insights.
Product Management is not a free lunch.
Plateless.
Plates and food must be prepared.
In conclusion, Product Managers must make at least three mentality shifts:
You put value first in all things. Time, money, and scope are not as important as knowing what is valuable.
You have faith in the field and have the ability to direct the search. YYou facilitate, but you don’t just facilitate. You wouldn't want to limit your domain expertise in that manner.
You develop concepts, strategies, and vision. You are not a waiter or an inbox where other people can post suggestions; you don't merely ask folks for opinion and record it. However, you excel at giving things that aren't clearly spoken or written down physical form.

Joe Procopio
3 years ago
Provide a product roadmap that can withstand startup velocities
This is how to build a car while driving.
Building a high-growth startup is compared to building a car while it's speeding down the highway.
How to plan without going crazy? Or, without losing team, board, and investor buy-in?
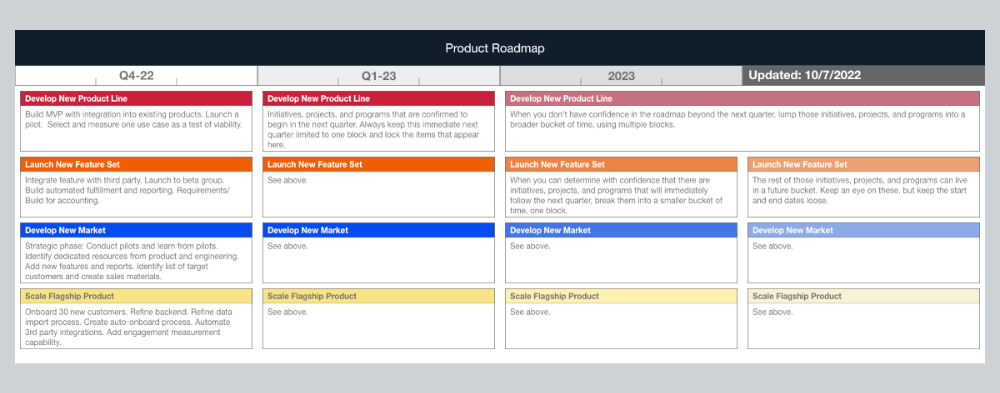
I just delivered our company's product roadmap for the rest of the year. Complete. Thorough. Page-long. I'm optimistic about its chances of surviving as everything around us changes, from internal priorities to the global economy.
It's tricky. This isn't the first time I've created a startup roadmap. I didn't invent a document. It took time to deliver a document that will be relevant for months.
Goals matter.
Although they never change, goals are rarely understood.
This is the third in a series about a startup's unique roadmapping needs. Velocity is the intensity at which a startup must produce to survive.
A high-growth startup moves at breakneck speed, which I alluded to when I said priorities and economic factors can change daily or weekly.
At that speed, a startup's roadmap must be flexible, bend but not break, and be brief and to the point. I can't tell you how many startups and large companies develop a product roadmap every quarter and then tuck it away.
Big, wealthy companies can do this. It's suicide for a startup.
The drawer thing happens because startup product roadmaps are often valid for a short time. The roadmap is a random list of features prioritized by different company factions and unrelated to company goals.
It's not because the goals changed that a roadmap is shelved or ignored. Because the company's goals were never communicated or documented in the context of its product.
In the previous post, I discussed how to turn company goals into a product roadmap. In this post, I'll show you how to make a one-page startup roadmap.
In a future post, I'll show you how to follow this roadmap. This roadmap helps you track company goals, something a roadmap must do.
Be vague for growth, but direct for execution.
Here's my plan. The real one has more entries and more content in each.
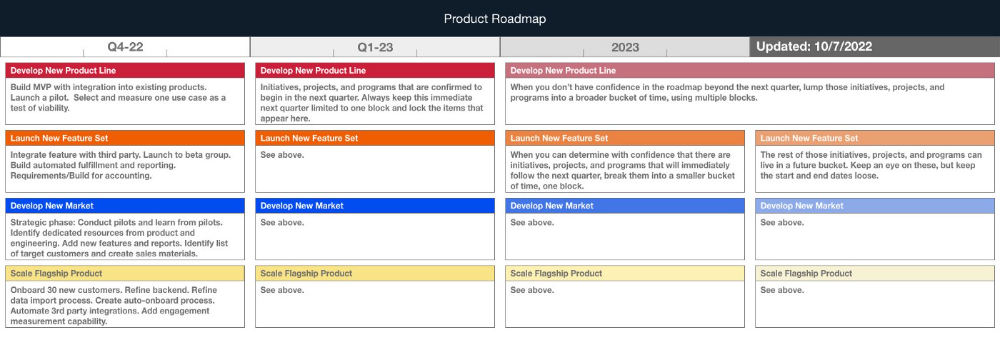
Let's discuss smaller boxes.
Product developers and engineers know that the further out they predict, the more wrong they'll be. When developing the product roadmap, this rule is ignored. Then it bites us three, six, or nine months later when we haven't even started.
Why do we put everything in a product roadmap like a project plan?
Yes, I know. We use it when the product roadmap isn't goal-based.
A goal-based roadmap begins with a document that outlines each goal's idea, execution, growth, and refinement.
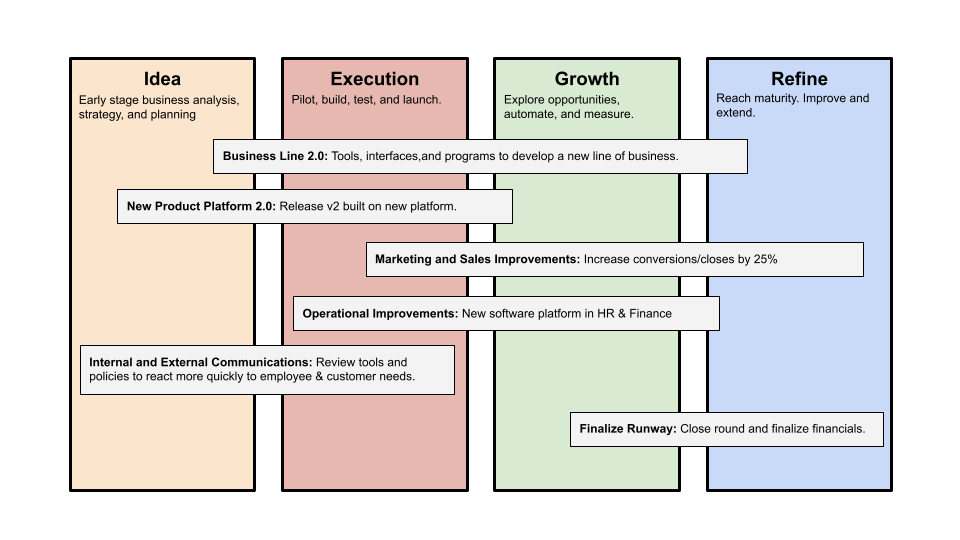
Once the goals are broken down into epics, initiatives, projects, and programs, only the idea and execution phases should be modeled. Any goal growth or refinement items should be vague and loosely mapped.
Why? First, any idea or execution-phase goal will result in growth initiatives that are unimaginable today. Second, internal priorities and external factors will change, but the goals won't. Locking items into calendar slots reduces flexibility and forces deviation from the single source of truth.
No soothsayers. Predicting the future is pointless; just prepare.
A map is useless if you don't know where you're going.
As we speed down the road, the car and the road will change. Goals define the destination.
This quarter and next quarter's roadmap should be set. After that, you should track destination milestones, not how to get there.
When you do that, even the most critical investors will understand the roadmap and buy in. When you track progress at the end of the quarter and revise your roadmap, the destination won't change.
You might also like

Ajay Shrestha
2 years ago
Bitcoin's technical innovation: addressing the issue of the Byzantine generals
The 2008 Bitcoin white paper solves the classic computer science consensus problem.
Issue Statement
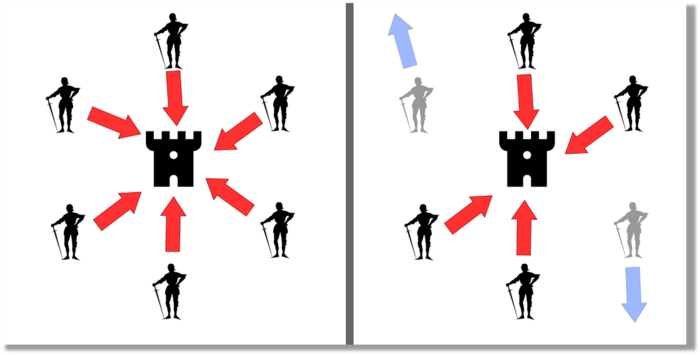
The Byzantine Generals Problem (BGP) is called after an allegory in which several generals must collaborate and attack a city at the same time to win (figure 1-left). Any general who retreats at the last minute loses the fight (figure 1-right). Thus, precise messengers and no rogue generals are essential. This is difficult without a trusted central authority.
In their 1982 publication, Leslie Lamport, Robert Shostak, and Marshall Please termed this topic the Byzantine Generals Problem to simplify distributed computer systems.
Consensus in a distributed computer network is the issue. Reaching a consensus on which systems work (and stay in the network) and which don't makes maintaining a network tough (i.e., needs to be removed from network). Challenges include unreliable communication routes between systems and mis-reporting systems.
Solving BGP can let us construct machine learning solutions without single points of failure or trusted central entities. One server hosts model parameters while numerous workers train the model. This study describes fault-tolerant Distributed Byzantine Machine Learning.
Bitcoin invented a mechanism for a distributed network of nodes to agree on which transactions should go into the distributed ledger (blockchain) without a trusted central body. It solved BGP implementation. Satoshi Nakamoto, the pseudonymous bitcoin creator, solved the challenge by cleverly combining cryptography and consensus mechanisms.
Disclaimer
This is not financial advice. It discusses a unique computer science solution.
Bitcoin
Bitcoin's white paper begins:
“A purely peer-to-peer version of electronic cash would allow online payments to be sent directly from one party to another without going through a financial institution.” Source: https://www.ussc.gov/sites/default/files/pdf/training/annual-national-training-seminar/2018/Emerging_Tech_Bitcoin_Crypto.pdf
Bitcoin's main parts:
The open-source and versioned bitcoin software that governs how nodes, miners, and the bitcoin token operate.
The native kind of token, known as a bitcoin token, may be created by mining (up to 21 million can be created), and it can be transferred between wallet addresses in the bitcoin network.
Distributed Ledger, which contains exact copies of the database (or "blockchain") containing each transaction since the first one in January 2009.
distributed network of nodes (computers) running the distributed ledger replica together with the bitcoin software. They broadcast the transactions to other peer nodes after validating and accepting them.
Proof of work (PoW) is a cryptographic requirement that must be met in order for a miner to be granted permission to add a new block of transactions to the blockchain of the cryptocurrency bitcoin. It takes the form of a valid hash digest. In order to produce new blocks on average every 10 minutes, Bitcoin features a built-in difficulty adjustment function that modifies the valid hash requirement (length of nonce). PoW requires a lot of energy since it must continually generate new hashes at random until it satisfies the criteria.
The competing parties known as miners carry out continuous computing processing to address recurrent cryptography issues. Transaction fees and some freshly minted (mined) bitcoin are the rewards they receive. The amount of hashes produced each second—or hash rate—is a measure of mining capacity.
Cryptography, decentralization, and the proof-of-work consensus method are Bitcoin's most unique features.
Bitcoin uses encryption
Bitcoin employs this established cryptography.
Hashing
digital signatures based on asymmetric encryption
Hashing (SHA-256) (SHA-256)

Hashing converts unique plaintext data into a digest. Creating the plaintext from the digest is impossible. Bitcoin miners generate new hashes using SHA-256 to win block rewards.
A new hash is created from the current block header and a variable value called nonce. To achieve the required hash, mining involves altering the nonce and re-hashing.
The block header contains the previous block hash and a Merkle root, which contains hashes of all transactions in the block. Thus, a chain of blocks with increasing hashes links back to the first block. Hashing protects new transactions and makes the bitcoin blockchain immutable. After a transaction block is mined, it becomes hard to fabricate even a little entry.
Asymmetric Cryptography Digital Signatures
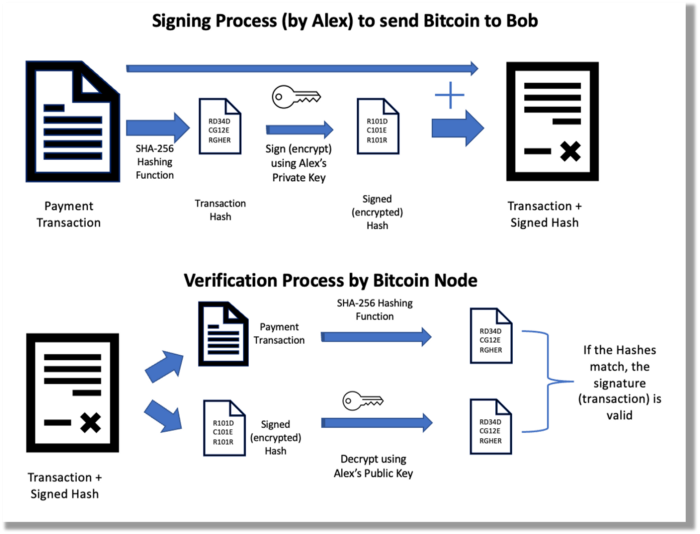
Asymmetric cryptography (public-key encryption) requires each side to have a secret and public key. Public keys (wallet addresses) can be shared with the transaction party, but private keys should not. A message (e.g., bitcoin payment record) can only be signed by the owner (sender) with the private key, but any node or anybody with access to the public key (visible in the blockchain) can verify it. Alex will submit a digitally signed transaction with a desired amount of bitcoin addressed to Bob's wallet to a node to send bitcoin to Bob. Alex alone has the secret keys to authorize that amount. Alex's blockchain public key allows anyone to verify the transaction.
Solution
Now, apply bitcoin to BGP. BGP generals resemble bitcoin nodes. The generals' consensus is like bitcoin nodes' blockchain block selection. Bitcoin software on all nodes can:
Check transactions (i.e., validate digital signatures)
2. Accept and propagate just the first miner to receive the valid hash and verify it accomplished the task. The only way to guess the proper hash is to brute force it by repeatedly producing one with the fixed/current block header and a fresh nonce value.
Thus, PoW and a dispersed network of nodes that accept blocks from miners that solve the unfalsifiable cryptographic challenge solve consensus.
Suppose:
Unreliable nodes
Unreliable miners
Bitcoin accepts the longest chain if rogue nodes cause divergence in accepted blocks. Thus, rogue nodes must outnumber honest nodes in accepting/forming the longer chain for invalid transactions to reach the blockchain. As of November 2022, 7000 coordinated rogue nodes are needed to takeover the bitcoin network.
Dishonest miners could also try to insert blocks with falsified transactions (double spend, reverse, censor, etc.) into the chain. This requires over 50% (51% attack) of miners (total computational power) to outguess the hash and attack the network. Mining hash rate exceeds 200 million (source). Rewards and transaction fees encourage miners to cooperate rather than attack. Quantum computers may become a threat.
Visit my Quantum Computing post.
Quantum computers—what are they? Quantum computers will have a big influence. towardsdatascience.com
Nodes have more power than miners since they can validate transactions and reject fake blocks. Thus, the network is secure if honest nodes are the majority.
Summary
Table 1 compares three Byzantine Generals Problem implementations.
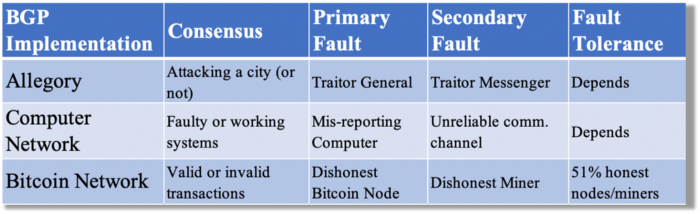
Bitcoin white paper and implementation solved the consensus challenge of distributed systems without central governance. It solved the illusive Byzantine Generals Problem.
Resources
Resources
Source-code for Bitcoin Core Software — https://github.com/bitcoin/bitcoin
Bitcoin white paper — https://bitcoin.org/bitcoin.pdf
https://www.microsoft.com/en-us/research/publication/byzantine-generals-problem/
https://www.microsoft.com/en-us/research/uploads/prod/2016/12/The-Byzantine-Generals-Problem.pdf
Genuinely Distributed Byzantine Machine Learning, El-Mahdi El-Mhamdi et al., 2020. ACM, New York, NY, https://doi.org/10.1145/3382734.3405695

Andy Raskin
3 years ago
I've Never Seen a Sales Deck This Good

It’s Zuora’s, and it’s brilliant. Here’s why.
My friend Tim got a sales position at a Series-C software company that garnered $60 million from A-list investors. He's one of the best salespeople I know, yet he emailed me after starting to struggle.
Tim has a few modest clients. “Big companies ignore my pitch”. Tim said.
I love helping teams write the strategic story that drives sales, marketing, and fundraising. Tim and I had lunch at Amber India on Market Street to evaluate his deck.
After a feast, I asked Tim when prospects tune out.
He said, “several slides in”.
Intent on maximizing dining ROI, Tim went back to the buffet for seconds. When he returned, I pulled out my laptop and launched into a Powerpoint presentation.
“What’s this?” Tim asked.
“This,” I said, “is the greatest sales deck I have ever seen.”
Five Essentials of a Great Sales Narrative
I showed Tim a sales slide from IPO-bound Zuora, which sells a SaaS platform for subscription billing. Zuora supports recurring payments (e.g. enterprise software).
Ex-Zuora salesman gave me the deck, saying it helped him close his largest business. (I don't know anyone who works at Zuora.) After reading this, a few Zuora employees contacted me.)
Tim abandoned his naan in a pool of goat curry and took notes while we discussed the Zuora deck.
We remarked how well the deck led prospects through five elements:
(The ex-Zuora salesperson begged me not to release the Zuora deck publicly.) All of the images below originate from Zuora's website and SlideShare channel.)
#1. Name a Significant Change in the World
Don't start a sales presentation with mentioning your product, headquarters, investors, clients, or yourself.
Name the world shift that raises enormous stakes and urgency for your prospect.
Every Zuora sales deck begins with this slide:

Zuora coined the term subscription economy to describe a new market where purchasers prefer regular service payments over outright purchases. Zuora then shows a slide with the change's history.

Most pitch recommendation advises starting with the problem. When you claim a problem, you put prospects on the defensive. They may be unaware of or uncomfortable admitting the situation.
When you highlight a global trend, prospects open up about how it affects them, worries them, and where they see opportunity. You capture their interest. Robert McKee says:
…what attracts human attention is change. …if the temperature around you changes, if the phone rings — that gets your attention. The way in which a story begins is a starting event that creates a moment of change.
#2. Show There’ll Be Winners and Losers
Loss aversion affects all prospects. They avoid a loss by sticking with the status quo rather than risking a gain by changing.
To fight loss aversion, show how the change will create winners and losers. You must show both
that if the prospect can adjust to the modification you mentioned, the outcome will probably be quite favorable; and
That failing to do so is likely to have an unacceptable negative impact on the prospect's future
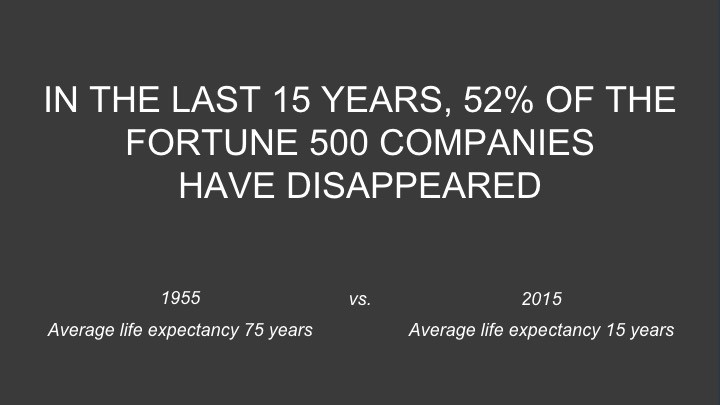
Zuora shows a mass extinction among Fortune 500 firms.
…and then showing how the “winners” have shifted from product ownership to subscription services. Those include upstarts…
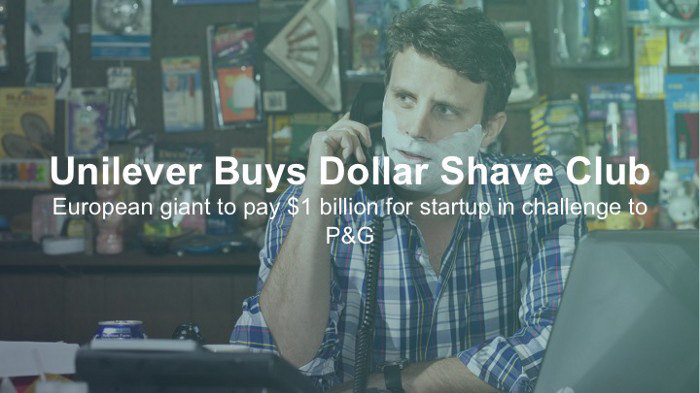
…as well as rejuvenated incumbents:

To illustrate, Zuora asks:

Winners utilize Zuora's subscription service models.
#3. Tease the Promised Land
It's tempting to get into product or service details now. Resist that urge.
Prospects won't understand why product/service details are crucial if you introduce them too soon, therefore they'll tune out.
Instead, providing a teaser image of the happily-ever-after your product/service will assist the prospect reach.
Your Promised Land should be appealing and hard to achieve without support. Otherwise, why does your company exist?
Zuora shows this Promised Land slide after explaining that the subscription economy will have winners and losers.

Not your product or service, but a new future state.
(I asked my friend Tim to describe his Promised Land, and he answered, "You’ll have the most innovative platform for ____." Nope: the Promised Land isn't possessing your technology, but living with it.)
Your Promised Land helps prospects market your solution to coworkers after your sales meeting. Your coworkers will wonder what you do without you. Your prospects are more likely to provide a persuasive answer with a captivating Promised Land.
#4. Present Features as “Mystic Gifts” for Overcoming Difficulties on the Road to the Promised Land
Successful sales decks follow the same format as epic films and fairy tales. Obi Wan gives Luke a lightsaber to help him destroy the Empire. You're Gandalf, helping Frodo destroy the ring. Your prospect is Cinderella, and you're her fairy godmother.
Position your product or service's skills as mystical gifts to aid your main character (prospect) achieve the Promised Land.

Zuora's client record slide is shown above. Without context, even the most technical prospect would be bored.
Positioned in the context of shifting from an “old” to a “new world”, it's the foundation for a compelling conversation with prospects—technical and otherwise—about why traditional solutions can't reach the Promised Land.
#5. Show Proof That You Can Make the Story True.
In this sense, you're promising possibilities that if they follow you, they'll reach the Promised Land.
The journey to the Promised Land is by definition rocky, so prospects are right to be cautious. The final part of the pitch is proof that you can make the story come true.
The most convincing proof is a success story about how you assisted someone comparable to the prospect. Zuora's sales people use a deck of customer success stories, but this one gets the essence.
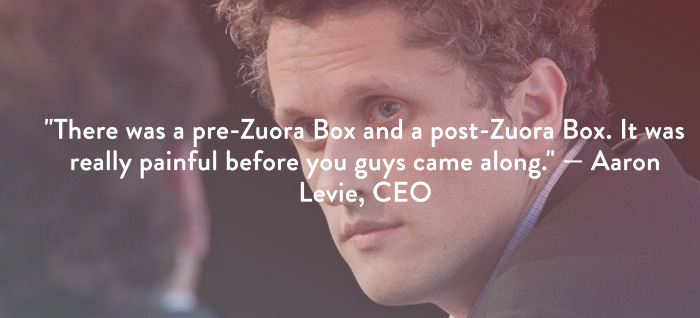
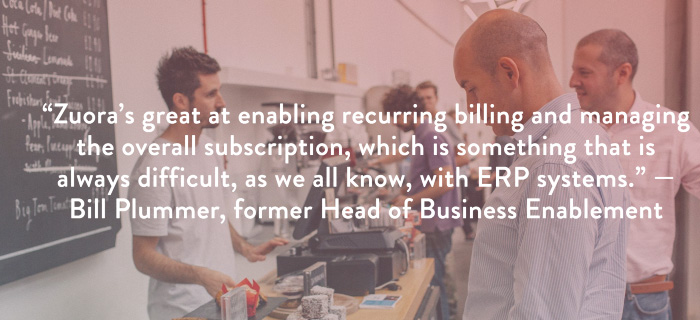
I particularly appreciate this one from an NCR exec (a Zuora customer), which relates more strongly to Zuora's Promised Land:
Not enough successful customers? Product demos are the next best evidence, but features should always be presented in the context of helping a prospect achieve the Promised Land.
The best sales narrative is one that is told by everyone.
Success rarely comes from a fantastic deck alone. To be effective, salespeople need an organization-wide story about change, Promised Land, and Magic Gifts.
Zuora exemplifies this. If you hear a Zuora executive, including CEO Tien Tzuo, talk, you'll likely hear about the subscription economy and its winners and losers. This is the theme of the company's marketing communications, campaigns, and vision statement.

According to the ex-Zuora salesperson, company-wide story alignment made him successful.
The Zuora marketing folks ran campaigns and branding around this shift to the subscription economy, and [CEO] Tien [Tzuo] talked it up all the time. All of that was like air cover for my in-person sales ground attack. By the time I arrived, prospects were already convinced they had to act. It was the closest thing I’ve ever experienced to sales nirvana.
The largest deal ever
Tim contacted me three weeks after our lunch to tell me that prospects at large organizations were responding well to his new deck, which we modeled on Zuora's framework. First, prospects revealed their obstacles more quickly. The new pitch engages CFOs and other top gatekeepers better, he said.
A week later, Tim emailed that he'd signed his company's biggest agreement.
Next week, we’re headed back to Amber India to celebrate.

Tim Denning
3 years ago
I gave up climbing the corporate ladder once I realized how deeply unhappy everyone at the top was.
Restructuring and layoffs cause career reevaluation. Your career can benefit.

Once you become institutionalized, the corporate ladder is all you know.
You're bubbled. Extremists term it the corporate Matrix. I'm not so severe because the business world brainwashed me, too.
This boosted my corporate career.
Until I hit bottom.
15 months later, I view my corporate life differently. You may wish to advance professionally. Read this before you do.
Your happiness in the workplace may be deceptive.
I've been fortunate to spend time with corporate aces.
Working for 2.5 years in banking social media gave me some of these experiences. Earlier in my career, I recorded interviews with business leaders.
These people have titles like Chief General Manager and Head Of. New titles brought life-changing salaries.
They seemed happy.
I’d pass them in the hallway and they’d smile or shake my hand. I dreamt of having their life.
The ominous pattern
Unfiltered talks with some of them revealed a different world.
They acted well. They were skilled at smiling and saying the correct things. All had the same dark pattern, though.
Something felt off.
I found my conversations with them were generally for their benefit. They hoped my online antics as a writer/coach would shed light on their dilemma.
They'd tell me they wanted more. When you're one position away from CEO, it's hard not to wonder if this next move will matter.
What really displeased corporate ladder chasers
Before ascending further, consider these.
Zero autonomy
As you rise in a company, your days get busier.
Many people and initiatives need supervision. Everyone expects you to know business details. Weak when you don't. A poor leader is fired during the next restructuring and left to pursue their corporate ambition.
Full calendars leave no time for reflection. You can't have a coffee with a friend or waste a day.
You’re always on call. It’s a roll call kinda life.
Unable to express oneself freely
My 8 years of LinkedIn writing helped me meet these leaders.
I didn't think they'd care. Mistake.
Corporate leaders envied me because they wanted to talk freely again without corporate comms or a PR firm directing them what to say.
They couldn't share their flaws or inspiring experiences.
They wanted to.
Every day they were muzzled eroded by their business dream.
Limited family time
Top leaders had families.
They've climbed the corporate ladder. Nothing excellent happens overnight.
Corporate dreamers rarely saw their families.
Late meetings, customer functions, expos, training, leadership days, team days, town halls, and product demos regularly occurred after work.
Or they had to travel interstate or internationally for work events. They used bags and motel showers.
Initially, they said business class flights and hotels were nice. They'd get bored. 5-star hotels become monotonous.
No hotel beats home.
One leader said he hadn't seen his daughter much. They used to Facetime, but now that he's been gone so long, she rarely wants to talk to him.
So they iPad-parented.
You're miserable without your family.
Held captive by other job titles
Going up the business ladder seems like a battle.
Leaders compete for business gains and corporate advancement.
I saw shocking filthy tricks. Leaders would lie to seem nice.
Captives included top officials.
A different section every week. If they ran technology, the Head of Sales would argue their CRM cost millions. Or an Operations chief would battle a product team over support requests.
After one conflict, another began.
Corporate echelons are antagonistic. Huge pay and bonuses guarantee bad behavior.
Overly centered on revenue
As you rise, revenue becomes more prevalent. Most days, you'd believe revenue was everything. Here’s the problem…
Numbers drain us.
Unless you're a closet math nerd, contemplating and talking about numbers drains your creativity.
Revenue will never substitute impact.
Incapable of taking risks
Corporate success requires taking fewer risks.
Risks can cause dismissal. Risks can interrupt business. Keep things moving so you may keep getting paid your enormous salary and bonus.
Restructuring or layoffs are inevitable. All corporate climbers experience it.
On this fateful day, a small few realize the game they’ve been trapped in and escape. Most return to play for a new company, but it takes time.
Addiction keeps them trapped. You know nothing else. The rest is strange.
You start to think “I’m getting old” or “it’s nearly retirement.” So you settle yet again for the trappings of the corporate ladder game to nowhere.
Should you climb the corporate ladder?
Let me end on a surprising note.
Young people should ascend the corporate ladder. It teaches you business skills and helps support your side gig and (potential) online business.
Don't get trapped, shackled, or muzzled.
Your ideas and creativity become stifled after too much gaming play.
Corporate success won't bring happiness.
Find fulfilling employment that matters. That's it.