


More on Personal Growth

Glorin Santhosh
3 years ago
In his final days, Steve Jobs sent an email to himself. What It Said Was This
An email capturing Steve Jobs's philosophy.

Steve Jobs may have been the most inspired and driven entrepreneur.
He worked on projects because he wanted to leave a legacy.
Steve Jobs' final email to himself encapsulated his philosophy.
After his death from pancreatic cancer in October 2011, Laurene Powell Jobs released the email. He was 56.
Read: Steve Jobs by Walter Isaacson (#BestSeller)
The Email:
September 2010 Steve Jobs email:
“I grow little of the food I eat, and of the little I do grow, I do not breed or perfect the seeds.” “I do not make my own clothing. I speak a language I did not invent or refine,” he continued. “I did not discover the mathematics I use… I am moved by music I did not create myself.”
Jobs ended his email by reflecting on how others created everything he uses.
He wrote:
“When I needed medical attention, I was helpless to help myself survive.”
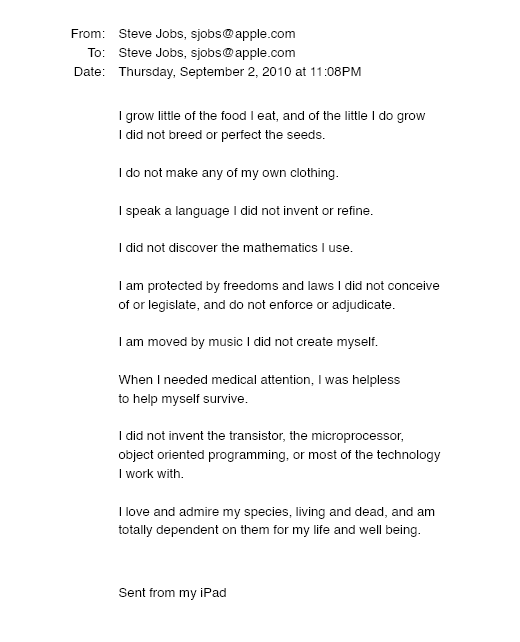
The Apple co-founder concluded by praising humanity.
“I did not invent the transistor, the microprocessor, object-oriented programming, or most of the technology I work with. I love and admire my species, living and dead, and am totally dependent on them for my life and well-being,” he concluded.
The email was made public as a part of the Steve Jobs Archive, a website that was launched in tribute to his legacy.
Steve Jobs' widow founded the internet archive. Apple CEO Tim Cook and former design leader Jony Ive were prominent guests.
Steve Jobs has always inspired because he shows how even the best can be improved.
High expectations were always there, and they were consistently met.
We miss him because he was one of the few with lifelong enthusiasm and persona.
Matthew Royse
3 years ago
Ten words and phrases to avoid in presentations
Don't say this in public!
Want to wow your audience? Want to deliver a successful presentation? Do you want practical takeaways from your presentation?
Then avoid these phrases.
Public speaking is difficult. People fear public speaking, according to research.
"Public speaking is people's biggest fear, according to studies. Number two is death. "Sounds right?" — Comedian Jerry Seinfeld
Yes, public speaking is scary. These words and phrases will make your presentation harder.
Using unnecessary words can weaken your message.
You may have prepared well for your presentation and feel confident. During your presentation, you may freeze up. You may blank or forget.
Effective delivery is even more important than skillful public speaking.
Here are 10 presentation pitfalls.
1. I or Me
Presentations are about the audience, not you. Replace "I or me" with "you, we, or us." Focus on your audience. Reward them with expertise and intriguing views about your issue.
Serve your audience actionable items during your presentation, and you'll do well. Your audience will have a harder time listening and engaging if you're self-centered.
2. Sorry if/for
Your presentation is fine. These phrases make you sound insecure and unprepared. Don't pressure the audience to tell you not to apologize. Your audience should focus on your presentation and essential messages.
3. Excuse the Eye Chart, or This slide's busy
Why add this slide if you're utilizing these phrases? If you don't like this slide, change it before presenting. After the presentation, extra data can be provided.
Don't apologize for unclear slides. Hide or delete a broken PowerPoint slide. If so, divide your message into multiple slides or remove the "business" slide.
4. Sorry I'm Nervous
Some think expressing yourself will win over the audience. Nerves are horrible. Even public speakers are nervous.
Nerves aren't noticeable. What's the point? Let the audience judge your nervousness. Please don't make this obvious.
5. I'm not a speaker or I've never done this before.
These phrases destroy credibility. People won't listen and will check their phones or computers.
Why present if you use these phrases?
Good speakers aren't necessarily public speakers. Be confident in what you say. When you're confident, many people will like your presentation.
6. Our Key Differentiators Are
Overused term. It's widely utilized. This seems "salesy," and your "important differentiators" are probably like a competitor's.
This statement has been diluted; say, "what makes us different is..."
7. Next Slide
Many slides or stories? Your presentation needs transitions. They help your viewers understand your argument.
You didn't transition well when you said "next slide." Think about organic transitions.
8. I Didn’t Have Enough Time, or I’m Running Out of Time
The phrase "I didn't have enough time" implies that you didn't care about your presentation. This shows the viewers you rushed and didn't care.
Saying "I'm out of time" shows poor time management. It means you didn't rehearse enough and plan your time well.
9. I've been asked to speak on
This phrase is used to emphasize your importance. This phrase conveys conceit.
When you say this sentence, you tell others you're intelligent, skilled, and appealing. Don't utilize this term; focus on your topic.
10. Moving On, or All I Have
These phrases don't consider your transitions or presentation's end. People recall a presentation's beginning and end.
How you end your discussion affects how people remember it. You must end your presentation strongly and use natural transitions.
Conclusion
10 phrases to avoid in a presentation. I or me, sorry if or sorry for, pardon the Eye Chart or this busy slide, forgive me if I appear worried, or I'm really nervous, and I'm not good at public speaking, I'm not a speaker, or I've never done this before.
Please don't use these phrases: next slide, I didn't have enough time, I've been asked to speak about, or that's all I have.
We shouldn't make public speaking more difficult than it is. We shouldn't exacerbate a difficult issue. Better public speakers avoid these words and phrases.
“Remember not only to say the right thing in the right place, but far more difficult still, to leave unsaid the wrong thing at the tempting moment.” — Benjamin Franklin, Founding Father
This is a summary. See the original post here.

Tim Denning
3 years ago
Read These Books on Personal Finance to Boost Your Net Worth
And retire sooner.
Books can make you filthy rich.
If you apply what you learn. In 2011, I was broke and had broken dreams.
Someone suggested I read finance books. One Up On Wall Street was his first recommendation.
Finance books were my crack.
I've read every money book since then. Some are good, but most stink.
These books will make you rich.
The Almanack of Naval Ravikant by Eric Jorgenson
This isn't a cliche book.
This book was inspired by a How to Get Rich tweet thread.
It’s one of the best tweets I’ve ever read.
Naval thinks differently. He nukes ordinary ideas. I've never heard better money advice.
Eric Jorgenson wrote a book about this tweet thread with Navals permission. A must-read, easy-to-digest book.
Best quote
Seek wealth, not money or status. Wealth is having assets that earn while you sleep. Money is how we transfer time and wealth. Status is your place in the social hierarchy — Naval
Morgan Housel's The Psychology of Money
Many finance books advise investing like a dunce.
They almost all peddle the buy an index fund BS. Different book.
It's about money-making psychology. Because any fool can get rich and drunk on their ego. Few can consistently make money.
Each chapter is short. A single-page chapter breaks all book publishing rules.
Best quote
Spending money to show people how much money you have is the fastest way to have less money — Morgan Housel
J.L. Collins' The Simple Path to Wealth
Most of the best money books were written by bloggers.
JL Collins blogs. This easy-to-read book was written for his daughter.
This book popularized the phrase F You Money. With enough money in your bank account and investment portfolio, you can say F You more.
A bad boss is an example. You can leave instead of enduring his wrath.
You can then sit at home and look for another job while financially secure. JL says its mind-freedom is powerful.
Best phrasing
You own the things you own and they in turn own you — J.L. Collins
Tony Robbins' Unshakeable
I like Tony. This book makes me sweaty.
Tony interviews the world's top financiers. He interviews people who rarely do so.
This book taught me all-weather portfolio. It's a way to invest in different asset classes in good, bad, recession, or depression times.
Look at it:
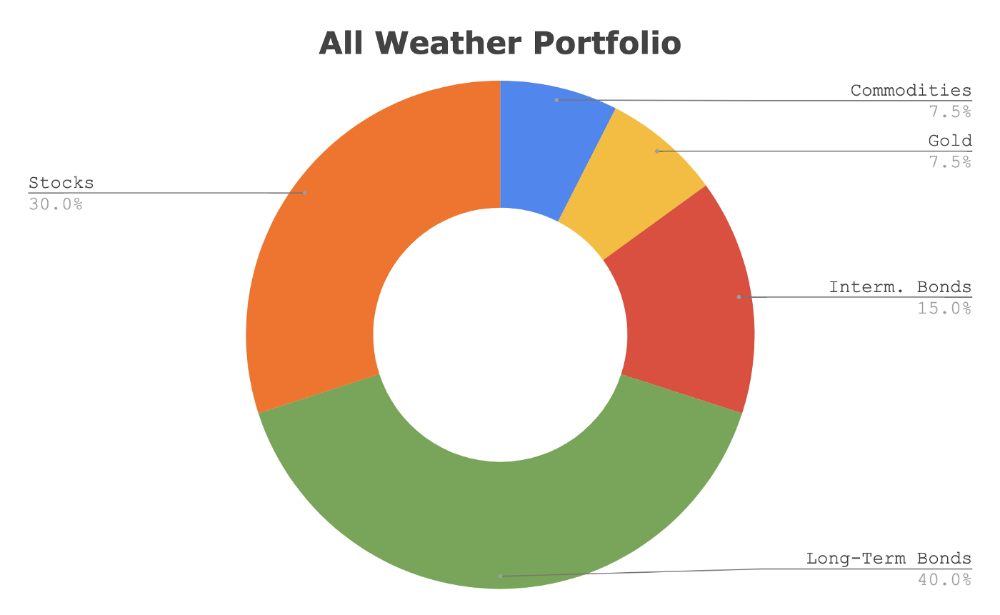
Investing isn’t about buying one big winner — that’s gambling. It’s about investing in a diversified portfolio of assets.
Best phrasing
The best opportunities come in times of maximum pessimism — Tony Robbins
Ben Graham's The Intelligent Investor
This book helped me distinguish between a spectator and an investor.
Spectators are those who shout that crypto, NFTs, or XYZ platform will die.
Tourists. They want attention and to say "I told you so." They make short-term and long-term predictions like fortunetellers. LOL. Idiots.
Benjamin Graham teaches smart investing. You'll buy a long-term asset. To be confident in recessions, use dollar-cost averaging.
Best phrasing
Those who do not remember the past are condemned to repeat it. — Benjamin Graham
The Napoleon Hill book Think and Grow Rich
This classic book introduced positive thinking to modern self-help.
Lazy pessimists can't become rich. No way.
Napoleon said, "Thoughts create reality."
No surprise that he discusses obsession and focus in this book. They are the fastest ways to make more money to invest in time and wealth-protecting assets.
Best phrasing
The starting point of all achievement is DESIRE. Keep this constantly in mind. Weak desire brings weak results, just as a small fire makes a small amount of heat — Napoleon Hill
Ramit Sethi's book I Will Teach You To Be Rich
This book is mostly good. The part about credit cards is trash.
Avoid credit card temptations. I don't care about their airline points.
This book teaches you to master money basics (that many people mess up) then automate it so your monkey brain doesn't ruin your financial future.
The book includes great negotiation tactics to help you make more money in less time.
Best quote
The 85 Percent Solution: Getting started is more important than becoming an expert — Ramit Sethi
David Bach's The Automatic Millionaire
You've probably met a six- or seven-figure earner who's broke. All their money goes to useless things like cars.
Money isn't as essential as what you do with it. David teaches how to automate your earnings for more money.
Compounding works once investing is automated. So you get rich.
His strategy eliminates luck and (almost) guarantees millionaire status.
Best phrasing
Every time you earn one dollar, make sure to pay yourself first — David Bach
Thomas J. Stanley's The Millionaire Next Door
Thomas defies the definition of rich.
He spends much of the book highlighting millionaire traits he's studied.
Rich people are quiet, so you wouldn't know they're wealthy. They don't earn much money or drive a BMW.
Thomas will give you the math to get started.
Best phrasing
I am not impressed with what people own. But I’m impressed with what they achieve. I’m proud to be a physician. Always strive to be the best in your field…. Don’t chase money. If you are the best in your field, money will find you. — Thomas J. Stanley
by Bill Perkins "Die With Zero"
Let’s end with one last book.
Bill's book angered many people. He says we spend too much time saving for retirement and die rich. That bank money is lost time.
Your grandkids could use the money. When children inherit money, they become lazy, entitled a-holes.
Bill wants us to spend our money on life-enhancing experiences. Stop saving money like monopoly monkeys.
Best phrasing
You should be focusing on maximizing your life enjoyment rather than on maximizing your wealth. Those are two very different goals. Money is just a means to an end: Having money helps you to achieve the more important goal of enjoying your life. But trying to maximize money actually gets in the way of achieving the more important goal — Bill Perkins
You might also like

Steve QJ
3 years ago
Putin's War On Reality
The dictator's playbook.
Stalin's successor, Nikita Khrushchev, delivered a speech titled "On The Cult Of Personality And Its Consequences" in 1956, three years after Stalin’s death.
It was Stalin's grave abuse of power that caused untold harm to our party.
Stalin acted not by persuasion, explanation, or patient cooperation, but by imposing his ideas and demanding absolute obedience. […]
See where Stalin's mania for greatness led? He had lost all sense of reality.
The speech, which was never made public, shook the Soviet Union and the Soviet Bloc. After Stalin's "cult of personality" was exposed as a lie, only reality remained.
As I've watched the nightmare unfold in Ukraine, I'm reminded of that question. Primarily by Putin's repeated denials.
His odd claim that Ukraine is run by drug addicts and Nazis (especially strange given that Volodymyr Zelenskyy, the Ukrainian president, is Jewish). Others attempt to portray Russia as liberators rather than occupiers. For example, he portrays Luhansk and Donetsk as plucky, newly independent states when they have been totalitarian statelets for 8 years.
Putin seemed to have lost all sense of reality.
Maybe that's why his remarks to an oligarchs' gathering stood out:
Everything is a desperate measure. They gave us no choice. We couldn't do anything about their security risks. […] They could have put the country in jeopardy.
This is almost certainly true from Putin's perspective. Even for Putin, a military invasion seems unlikely. So, what exactly is putting Russia's security in jeopardy? How could Ukraine's independence endanger Russia's existence?
The truth is the only thing that truly terrifies leaders like these.
Trump, the president of “alternative facts,” "and “fake news” praised Putin's fabricated justifications for the Ukraine invasion. Russia tightened news censorship as news of their losses came in. It's no accident that modern dictatorships like Russia (and China and North Korea) restrict citizens' access to information.
Controlling what people see, hear, and think is the simplest method. And Ukraine's recent efforts to join the European Union showed a country whose thoughts Putin couldn't control. With the Russian and Ukrainian peoples so close, he could not control their reality.
He appears to think this is a threat worth fighting NATO over.
It's easy to disown history's great dictators. By the magnitude of their harm. But the strategy they used is still in use today, albeit not to the same devastating effect.
The Kim dynasty in North Korea has ruled for 74 years, Putin has ruled Russia for 19 years (using loopholes and even rewriting the constitution).
“Politicians and diapers must be changed frequently,” said Mark Twain. "And for the same reason.”
When their egos are threatened, they sabre-rattle, as in Kim Jong-un and Donald Trump's famous spat about the size of their...ahem, “nuclear buttons”." Or Putin's threats of mutual destruction this weekend.
Most importantly, they have cult-like control over their followers.
When a leader whose power is built on lies feels he is losing control of the narrative, things like Trump's Jan. 6 meltdown and Putin's current actions in Ukraine are unavoidable.
Leaders who try to control their people's reality will have to die to keep the illusion alive.
Long version of this post available here

Mike Tarullo
3 years ago
Even In a Crazy Market, Hire the Best People: The "First Ten" Rules
Hiring is difficult, but you shouldn't compromise on team members. Or it may suggest you need to look beyond years in a similar role/function.
Every hire should be someone we'd want as one of our first ten employees.
If you hire such people, your team will adapt, initiate, and problem-solve, and your company will grow. You'll stay nimble even as you scale, and you'll learn from your colleagues.
If you only hire for a specific role or someone who can execute the job, you'll become a cluster of optimizers, and talent will depart for a more fascinating company. A startup is continually changing, therefore you want individuals that embrace it.
As a leader, establishing ideal conditions for talent and having a real ideology should be high on your agenda. You can't eliminate attrition, nor would you want to, but you can hire people who will become your company's leaders.
In my last four jobs I was employee 2, 5, 3, and 5. So while this is all a bit self serving, you’re the one reading my writing — and I have some experience with who works out in the first ten!
First, we'll examine what they do well (and why they're beneficial for startups), then what they don't, and how to hire them.
First 10 are:
Business partners: Because it's their company, they take care of whatever has to be done and have ideas about how to do it. You can rely on them to always put the success of the firm first because it is their top priority (company success is strongly connected with success for early workers). This approach will eventually take someone to leadership positions.
High Speed Learners: They process knowledge quickly and can reach 80%+ competency in a new subject matter rather quickly. A growing business that is successful tries new things frequently. We have all lost a lot of money and time on employees who follow the wrong playbook or who wait for someone else within the company to take care of them.
Autodidacts learn by trial and error, osmosis, networking with others, applying first principles, and reading voraciously (articles, newsletters, books, and even social media). Although teaching is wonderful, you won't have time.
Self-scaling: They figure out a means to deal with issues and avoid doing the grunt labor over the long haul, increasing their leverage. Great people don't keep doing the same thing forever; as they expand, they use automation and delegation to fill in their lower branches. This is a crucial one; even though you'll still adore them, you'll have to manage their scope or help them learn how to scale on their own.
Free Range: You can direct them toward objectives rather than specific chores. Check-ins can be used to keep them generally on course without stifling invention instead of giving them precise instructions because doing so will obscure their light.
When people are inspired, they bring their own ideas about what a firm can be and become animated during discussions about how to get there.
Novelty Seeking: They look for business and personal growth chances. Give them fresh assignments and new directions to follow around once every three months.
Here’s what the First Ten types may not be:
Domain specialists. When you look at their resumes, you'll almost certainly think they're unqualified. Fortunately, a few strategically positioned experts may empower a number of First Ten types by serving on a leadership team or in advising capacities.
Balanced. These people become very invested, and they may be vulnerable to many types of stress. You may need to assist them in managing their own stress and coaching them through obstacles. If you are reading this and work at Banza, I apologize for not doing a better job of supporting this. I need to be better at it.
Able to handle micromanagement with ease. People who like to be in charge will suppress these people. Good decision-making should be delegated to competent individuals. Generally speaking, if you wish to scale.
Great startup team members have versatility, learning, innovation, and energy. When we hire for the function, not the person, we become dull and staid. Could this person go to another department if needed? Could they expand two levels in a few years?
First Ten qualities and experience level may have a weak inverse association. People with 20+ years of experience who had worked at larger organizations wanted to try something new and had a growth mentality. College graduates may want to be told what to do and how to accomplish it so they can stay in their lane and do what their management asks.
Does the First Ten archetype sound right for your org? Cool, let’s go hiring. How will you know when you’ve found one?
They exhibit adaptive excellence, excelling at a variety of unrelated tasks. It could be hobbies or professional talents. This suggests that they will succeed in the next several endeavors they pursue.
Successful risk-taking is doing something that wasn't certain to succeed, sometimes more than once, and making it do so. It's an attitude.
Rapid Rise: They regularly change roles and get promoted. However, they don't leave companies when the going gets tough. Look for promotions at every stop and at least one position with three or more years of experience.
You can ask them:
Tell me about a time when you started from scratch or achieved success. What occurred en route? You might request a variety of tales from various occupations or even aspects of life. They ought to be energized by this.
What new skills have you just acquired? It is not required to be work-related. They must be able to describe it and unintentionally become enthusiastic about it.
Tell me about a moment when you encountered a challenge and had to alter your strategy. The core of a startup is reinventing itself when faced with obstacles.
Tell me about a moment when you eliminated yourself from a position at work. They've demonstrated they can permanently solve one issue and develop into a new one, as stated above.
Why do you want to leave X position or Y duty? These people ought to be moving forward, not backward, all the time. Instead, they will discuss what they are looking forward to visiting your location.
Any questions? Due to their inherent curiosity and desire to learn new things, they should practically never run out of questions. You can really tell if they are sufficiently curious at this point.
People who see their success as being the same as the success of the organization are the best-case team members, in any market. They’ll grow and change with the company, and always try to prioritize what matters. You’ll find yourself more energized by your work because you’re surrounded by others who are as well. Happy teambuilding!

Leonardo Castorina
3 years ago
How to Use Obsidian to Boost Research Productivity
Tools for managing your PhD projects, reading lists, notes, and inspiration.
As a researcher, you have to know everything. But knowledge is useless if it cannot be accessed quickly. An easy-to-use method of archiving information makes taking notes effortless and enjoyable.
As a PhD student in Artificial Intelligence, I use Obsidian (https://obsidian.md) to manage my knowledge.
The article has three parts:
- What is a note, how to organize notes, tags, folders, and links? This section is tool-agnostic, so you can use most of these ideas with any note-taking app.
- Instructions for using Obsidian, managing notes, reading lists, and useful plugins. This section demonstrates how I use Obsidian, my preferred knowledge management tool.
- Workflows: How to use Zotero to take notes from papers, manage multiple projects' notes, create MOCs with Dataview, and more. This section explains how to use Obsidian to solve common scientific problems and manage/maintain your knowledge effectively.
This list is not perfect or complete, but it is my current solution to problems I've encountered during my PhD. Please leave additional comments or contact me if you have any feedback. I'll try to update this article.
Throughout the article, I'll refer to your digital library as your "Obsidian Vault" or "Zettelkasten".
Other useful resources are listed at the end of the article.
1. Philosophy: Taking and organizing notes
Carl Sagan: “To make an apple pie from scratch, you must first create the universe.”
Before diving into Obsidian, let's establish a Personal Knowledge Management System and a Zettelkasten. You can skip to Section 2 if you already know these terms.
Niklas Luhmann, a prolific sociologist who wrote 400 papers and 70 books, inspired this section and much of Zettelkasten. Zettelkasten means “slip box” (or library in this article). His Zettlekasten had around 90000 physical notes, which can be found here.
There are now many tools available to help with this process. Obsidian's website has a good introduction section: https://publish.obsidian.md/hub/
Notes
We'll start with "What is a note?" Although it may seem trivial, the answer depends on the topic or your note-taking style. The idea is that a note is as “atomic” (i.e. You should read the note and get the idea right away.
The resolution of your notes depends on their detail. Deep Learning, for example, could be a general description of Neural Networks, with a few notes on the various architectures (eg. Recurrent Neural Networks, Convolutional Neural Networks etc..).
Limiting length and detail is a good rule of thumb. If you need more detail in a specific section of this note, break it up into smaller notes. Deep Learning now has three notes:
- Deep Learning
- Recurrent Neural Networks
- Convolutional Neural Networks
Repeat this step as needed until you achieve the desired granularity. You might want to put these notes in a “Neural Networks” folder because they are all about the same thing. But there's a better way:
#Tags and [[Links]] over /Folders/
The main issue with folders is that they are not flexible and assume that all notes in the folder belong to a single category. This makes it difficult to make connections between topics.
Deep Learning has been used to predict protein structure (AlphaFold) and classify images (ImageNet). Imagine a folder structure like this:
- /Proteins/
- Protein Folding
- /Deep Learning/
- /Proteins/
Your notes about Protein Folding and Convolutional Neural Networks will be separate, and you won't be able to find them in the same folder.
This can be solved in several ways. The most common one is to use tags rather than folders. A note can be grouped with multiple topics this way. Obsidian tags can also be nested (have subtags).
You can also link two notes together. You can build your “Knowledge Graph” in Obsidian and other note-taking apps like Obsidian.
My Knowledge Graph. Green: Biology, Red: Machine Learning, Yellow: Autoencoders, Blue: Graphs, Brown: Tags.
My Knowledge Graph and the note “Backrpropagation” and its links.
Backpropagation note and all its links
Why use Folders?
Folders help organize your vault as it grows. The main suggestion is to have few folders that "weakly" collect groups of notes or better yet, notes from different sources.
Among my Zettelkasten folders are:
My Zettelkasten's 5 folders
They usually gather data from various sources:
MOC: Map of Contents for the Zettelkasten.
Projects: Contains one note for each side-project of my PhD where I log my progress and ideas. Notes are linked to these.
Bio and ML: These two are the main content of my Zettelkasten and could theoretically be combined.
Papers: All my scientific paper notes go here. A bibliography links the notes. Zotero .bib file
Books: I make a note for each book I read, which I then split into multiple notes.
Keeping images separate from other files can help keep your main folders clean.
I will elaborate on these in the Workflow Section.
My general recommendation is to use tags and links instead of folders.
Maps of Content (MOC)
Making Tables of Contents is a good solution (MOCs).
These are notes that "signposts" your Zettelkasten library, directing you to the right type of notes. It can link to other notes based on common tags. This is usually done with a title, then your notes related to that title. As an example:
An example of a Machine Learning MOC generated with Dataview.
As shown above, my Machine Learning MOC begins with the basics. Then it's on to Variational Auto-Encoders. Not only does this save time, but it also saves scrolling through the tag search section.
So I keep MOCs at the top of my library so I can quickly find information and see my library. These MOCs are generated automatically using an Obsidian Plugin called Dataview (https://github.com/blacksmithgu/obsidian-dataview).
Ideally, MOCs could be expanded to include more information about the notes, their status, and what's left to do. In the absence of this, Dataview does a fantastic job at creating a good structure for your notes.
In the absence of this, Dataview does a fantastic job at creating a good structure for your notes.
2. Tools: Knowing Obsidian
Obsidian is my preferred tool because it is free, all notes are stored in Markdown format, and each panel can be dragged and dropped. You can get it here: https://obsidian.md/
Obsidian interface.
Obsidian is highly customizable, so here is my preferred interface:
The theme is customized from https://github.com/colineckert/obsidian-things
Alternatively, each panel can be collapsed, moved, or removed as desired. To open a panel later, click on the vertical "..." (bottom left of the note panel).
My interface is organized as follows:
How my Obsidian Interface is organized.
Folders/Search:
This is where I keep all relevant folders. I usually use the MOC note to navigate, but sometimes I use the search button to find a note.
Tags:
I use nested tags and look into each one to find specific notes to link.
cMenu:
Easy-to-use menu plugin cMenu (https://github.com/chetachiezikeuzor/cMenu-Plugin)
Global Graph:
The global graph shows all your notes (linked and unlinked). Linked notes will appear closer together. Zoom in to read each note's title. It's a bit overwhelming at first, but as your library grows, you get used to the positions and start thinking of new connections between notes.
Local Graph:
Your current note will be shown in relation to other linked notes in your library. When needed, you can quickly jump to another link and back to the current note.
Links:
Finally, an outline panel and the plugin Obsidian Power Search (https://github.com/aviral-batra/obsidian-power-search) allow me to search my vault by highlighting text.
Start using the tool and worry about panel positioning later. I encourage you to find the best use-case for your library.
Plugins
An additional benefit of using Obsidian is the large plugin library. I use several (Calendar, Citations, Dataview, Templater, Admonition):
Obsidian Calendar Plugin: https://github.com/liamcain
It organizes your notes on a calendar. This is ideal for meeting notes or keeping a journal.
Calendar addon from hans/obsidian-citation-plugin
Obsidian Citation Plugin: https://github.com/hans/
Allows you to cite papers from a.bib file. You can also customize your notes (eg. Title, Authors, Abstract etc..)
Plugin citation from hans/obsidian-citation-plugin
Obsidian Dataview: https://github.com/blacksmithgu/
A powerful plugin that allows you to query your library as a database and generate content automatically. See the MOC section for an example.
Allows you to create notes with specific templates like dates, tags, and headings.
Templater. Obsidian Admonition: https://github.com/valentine195/obsidian-admonition
Blocks allow you to organize your notes.
Plugin warning. Obsidian Admonition (valentine195)
There are many more, but this list should get you started.
3. Workflows: Cool stuff
Here are a few of my workflows for using obsidian for scientific research. This is a list of resources I've found useful for my use-cases. I'll outline and describe them briefly so you can skim them quickly.
3.1 Using Templates to Structure Notes
3.2 Free Note Syncing (Laptop, Phone, Tablet)
3.3 Zotero/Mendeley/JabRef -> Obsidian — Managing Reading Lists
3.4 Projects and Lab Books
3.5 Private Encrypted Diary
3.1 Using Templates to Structure Notes
Plugins: Templater and Dataview (optional).
To take effective notes, you must first make adding new notes as easy as possible. Templates can save you time and give your notes a consistent structure. As an example:
An example of a note using a template.
### [[YOUR MOC]]
# Note Title of your note
**Tags**::
**Links**::
The top line links to your knowledge base's Map of Content (MOC) (see previous sections). After the title, I add tags (and a link between the note and the tag) and links to related notes.
To quickly identify all notes that need to be expanded, I add the tag “#todo”. In the “TODO:” section, I list the tasks within the note.
The rest are notes on the topic.
Templater can help you create these templates. For new books, I use the following template:
### [[Books MOC]]
# Title
**Author**::
**Date::
**Tags::
**Links::
A book template example.
Using a simple query, I can hook Dataview to it.
dataview
table author as Author, date as “Date Finished”, tags as “Tags”, grade as “Grade”
from “4. Books”
SORT grade DESCENDING
using Dataview to query templates.
3.2 Free Note Syncing (Laptop, Phone, Tablet)
No plugins used.
One of my favorite features of Obsidian is the library's self-contained and portable format. Your folder contains everything (plugins included).
Ordinary folders and documents are available as well. There is also a “.obsidian” folder. This contains all your plugins and settings, so you can use it on other devices.
So you can use Google Drive, iCloud, or Dropbox for free as long as you sync your folder (note: your folder should be in your Cloud Folder).
For my iOS and macOS work, I prefer iCloud. You can also use the paid service Obsidian Sync.
3.3 Obsidian — Managing Reading Lists and Notes in Zotero/Mendeley/JabRef
Plugins: Quotes (required).
3.3 Zotero/Mendeley/JabRef -> Obsidian — Taking Notes and Managing Reading Lists of Scientific Papers
My preferred reference manager is Zotero, but this workflow should work with any reference manager that produces a .bib file. This file is exported to my cloud folder so I can access it from any platform.
My Zotero library is tagged as follows:
My reference manager's tags
For readings, I usually search for the tags “!!!” and “To-Read” and select a paper. Annotate the paper next (either on PDF using GoodNotes or on physical paper).
Then I make a paper page using a template in the Citations plugin settings:
An example of my citations template.
Create a new note, open the command list with CMD/CTRL + P, and find the Citations “Insert literature note content in the current pane” to see this lovely view.
Citation generated by the article https://doi.org/10.1101/2022.01.24.22269144
You can then convert your notes to digital. I found that transcribing helped me retain information better.
3.4 Projects and Lab Books
Plugins: Tweaker (required).
PhD students offering advice on thesis writing are common (read as regret). I started asking them what they would have done differently or earlier.
“Deep stuff Leo,” one person said. So my main issue is basic organization, losing track of my tasks and the reasons for them.
As a result, I'd go on other experiments that didn't make sense, and have to reverse engineer my logic for thesis writing. - PhD student now wise Postdoc
Time management requires planning. Keeping track of multiple projects and lab books is difficult during a PhD. How I deal with it:
- One folder for all my projects
- One file for each project
I use a template to create each project
### [[Projects MOC]]
# <% tp.file.title %>
**Tags**::
**Links**::
**URL**::
**Project Description**::## Notes:
### <% tp.file.last_modified_date(“dddd Do MMMM YYYY”) %>
#### Done:
#### TODO:
#### Notes
You can insert a template into a new note with CMD + P and looking for the Templater option.
I then keep adding new days with another template:
### <% tp.file.last_modified_date("dddd Do MMMM YYYY") %>
#### Done:
#### TODO:
#### Notes:
This way you can keep adding days to your project and update with reasonings and things you still have to do and have done. An example below:
Example of project note with timestamped notes.
3.5 Private Encrypted Diary
This is one of my favorite Obsidian uses.
Mini Diary's interface has long frustrated me. After the author archived the project, I looked for a replacement. I had two demands:
- It had to be private, and nobody had to be able to read the entries.
- Cloud syncing was required for editing on multiple devices.
Then I learned about encrypting the Obsidian folder. Then decrypt and open the folder with Obsidian. Sync the folder as usual.
Use CryptoMator (https://cryptomator.org/). Create an encrypted folder in Cryptomator for your Obsidian vault, set a password, and let it do the rest.
If you need a step-by-step video guide, here it is:
Conclusion
So, I hope this was helpful!
In the first section of the article, we discussed notes and note-taking techniques. We discussed when to use tags and links over folders and when to break up larger notes.
Then we learned about Obsidian, its interface, and some useful plugins like Citations for citing papers and Templater for creating note templates.
Finally, we discussed workflows and how to use Zotero to take notes from scientific papers, as well as managing Lab Books and Private Encrypted Diaries.
Thanks for reading and commenting :)
Read original post here