


How I made $160,000 from non-fiction books
I've sold over 40,000 non-fiction books on Amazon and made over $160,000 in six years while writing on the side.
I have a full-time job and three young sons; I can't spend 40 hours a week writing. This article describes my journey.
I write mainly tech books:
Thanks to my readers, many wrote positive evaluations. Several are bestsellers.
A few have been adopted by universities as textbooks:
My books' passive income allows me more time with my family.
Knowing I could quit my job and write full time gave me more confidence. And I find purpose in my work (i am in christian ministry).
I'm always eager to write. When work is a dread or something bad happens, writing gives me energy. Writing isn't scary. In fact, I can’t stop myself from writing!
Writing has also established my tech authority. Universities use my books, as I've said. Traditional publishers have asked me to write books.
These mindsets helped me become a successful nonfiction author:
1. You don’t have to be an Authority
Yes, I have computer science experience. But I'm no expert on my topics. Before authoring "Beginning Node.js, Express & MongoDB," my most profitable book, I had no experience with those topics. Node was a new server-side technology for me. Would that stop me from writing a book? It can. I liked learning a new technology. So I read the top three Node books, took the top online courses, and put them into my own book (which makes me know more than 90 percent of people already).
I didn't have to worry about using too much jargon because I was learning as I wrote. An expert forgets a beginner's hardship.
"The fellow learner can aid more than the master since he knows less," says C.S. Lewis. The problem he must explain is recent. The expert has forgotten.”
2. Solve a micro-problem (Niching down)
I didn't set out to write a definitive handbook. I found a market with several challenges and wrote one book. Ex:
- Instead of web development, what about web development using Angular?
- Instead of Blockchain, what about Blockchain using Solidity and React?
- Instead of cooking recipes, how about a recipe for a specific kind of diet?
- Instead of Learning math, what about Learning Singapore Math?
3. Piggy Backing Trends
The above topics may still be a competitive market. E.g. Angular, React. To stand out, include the latest technologies or trends in your book. Learn iOS 15 instead of iOS programming. Instead of personal finance, what about personal finance with NFTs.
Even though you're a newbie author, your topic is well-known.
4. Publish short books
My books are known for being direct. Many people like this:
Your reader will appreciate you cutting out the fluff and getting to the good stuff. A reader can finish and review your book.
Second, short books are easier to write. Instead of creating a 500-page book for $50 (which few will buy), write a 100-page book that answers a subset of the problem and sell it for less. (You make less, but that's another subject). At least it got published instead of languishing. Less time spent creating a book means less time wasted if it fails. Write a small-bets book portfolio like Daniel Vassallo!
Third, it's $2.99-$9.99 on Amazon (gets 70 percent royalties for ebooks). Anything less receives 35% royalties. $9.99 books have 20,000–30,000 words. If you write more and charge more over $9.99, you get 35% royalties. Why not make it a $9.99 book?
(This is the ebook version.) Paperbacks cost more. Higher royalties allow for higher prices.
5. Validate book idea
Amazon will tell you if your book concept, title, and related phrases are popular. See? Check its best-sellers list.
150,000 is preferable. It sells 2–3 copies daily. Consider your rivals. Profitable niches have high demand and low competition.
Don't be afraid of competitive niches. First, it shows high demand. Secondly, what are the ways you can undercut the completion? Better book? Or cheaper option? There was lots of competition in my NodeJS book's area. None received 4.5 stars or more. I wrote a NodeJS book. Today, it's a best-selling Node book.
What’s Next
So long. Part II follows. Meanwhile, I will continue to write more books!
Follow my journey on Twitter.
This post is a summary. Read full article here
More on Entrepreneurship/Creators

Aaron Dinin, PhD
3 years ago
There Are Two Types of Entrepreneurs in the World Make sure you are aware of your type!
Know why it's important.

The entrepreneur I was meeting with said, "I should be doing crypto, or maybe AI? Aren't those the hot spots? I should look there for a startup idea.”
I shook my head. Yes, they're exciting, but that doesn't mean they're best for you and your business.
“There are different types of entrepreneurs?” he asked.
I said "obviously." Two types, actually. Knowing what type of entrepreneur you are helps you build the right startup.
The two types of businesspeople
The best way for me to describe the two types of entrepreneurs is to start by telling you exactly the kinds of entrepreneurial opportunities I never get excited about: future opportunities.
In the early 1990s, my older brother showed me the World Wide Web and urged me to use it. Unimpressed, I returned to my Super Nintendo.
My roommate tried to get me to join Facebook as a senior in college. I remember thinking, This is dumb. Who'll use it?
In 2011, my best friend tried to convince me to buy bitcoin and I laughed.
Heck, a couple of years ago I had to buy a new car, and I never even considered buying something that didn’t require fossilized dinosaur bones.
I'm no visionary. I don't anticipate the future. I focus on the present.
This tendency makes me a problem-solving entrepreneur. I identify entrepreneurial opportunities by spotting flaws and/or inefficiencies in the world and devising solutions.
There are other ways to find business opportunities. Visionary entrepreneurs also exist. I don't mean visionary in the hyperbolic sense that implies world-changing impact. I mean visionary as an entrepreneur who identifies future technological shifts that will change how people work and live and create new markets.
Problem-solving and visionary entrepreneurs are equally good. But the two approaches to building companies are very different. Knowing the type of entrepreneur you are will help you build a startup that fits your worldview.
What is the distinction?
Let's use some simple hypotheticals to compare problem-solving and visionary entrepreneurship.
Imagine a city office building without nearby restaurants. Those office workers love to eat. Sometimes they'd rather eat out than pack a lunch. As an entrepreneur, you can solve the lack of nearby restaurants. You'd open a restaurant near that office, say a pizza parlor, and get customers because you solved the lack of nearby restaurants. Problem-solving entrepreneurship.
Imagine a new office building in a developing area with no residents or workers. In this scenario, a large office building is coming. The workers will need to eat then. As a visionary entrepreneur, you're excited about the new market and decide to open a pizzeria near the construction to meet demand.
Both possibilities involve the same product. You opened a pizzeria. How you launched that pizza restaurant and what will affect its success are different.
Why is the distinction important?
Let's say you opened a pizzeria near an office. You'll probably get customers. Because people are nearby and demand isn't being met, someone from a nearby building will stop in within the first few days of your pizzeria's grand opening. This makes solving the problem relatively risk-free. You'll get customers unless you're a fool.
The market you're targeting existed before you entered it, so you're not guaranteed success. This means people in that market solved the lack of nearby restaurants. Those office workers are used to bringing their own lunches. Why should your restaurant change their habits? Even when they eat out, they're used to traveling far. They've likely developed pizza preferences.
To be successful with your problem-solving startup, you must convince consumers to change their behavior, which is difficult.
Unlike opening a pizza restaurant near a construction site. Once the building opens, workers won't have many preferences or standardized food-getting practices. Your pizza restaurant can become the incumbent quickly. You'll be the first restaurant in the area, so you'll gain a devoted following that makes your food a routine.
Great, right? It's easier than changing people's behavior. The benefit comes with a risk. Opening a pizza restaurant near a construction site increases future risk. What if builders run out of money? No one moves in? What if the building's occupants are the National Association of Pizza Haters? Then you've opened a pizza restaurant next to pizza haters.
Which kind of businessperson are you?
This isn't to say one type of entrepreneur is better than another. Each type of entrepreneurship requires different skills.
As my simple examples show, a problem-solving entrepreneur must operate in markets with established behaviors and habits. To be successful, you must be able to teach a market a new way of doing things.
Conversely, the challenge of being a visionary entrepreneur is that you have to be good at predicting the future and getting in front of that future before other people.
Both are difficult in different ways. So, smart entrepreneurs don't just chase opportunities. Smart entrepreneurs pursue opportunities that match their skill sets.

Thomas Tcheudjio
3 years ago
If you don't crush these 3 metrics, skip the Series A.
I recently wrote about getting VCs excited about Marketplace start-ups. SaaS founders became envious!
Understanding how people wire tens of millions is the only Series A hack I recommend.
Few people understand the intellectual process behind investing.
VC is risk management.
Series A-focused VCs must cover two risks.
1. Market risk
You need a large market to cross a threshold beyond which you can build defensibilities. Series A VCs underwrite market risk.
They must see you have reached product-market fit (PMF) in a large total addressable market (TAM).
2. Execution risk
When evaluating your growth engine's blitzscaling ability, execution risk arises.
When investors remove operational uncertainty, they profit.
Series A VCs like businesses with derisked revenue streams. Don't raise unless you have a predictable model, pipeline, and growth.
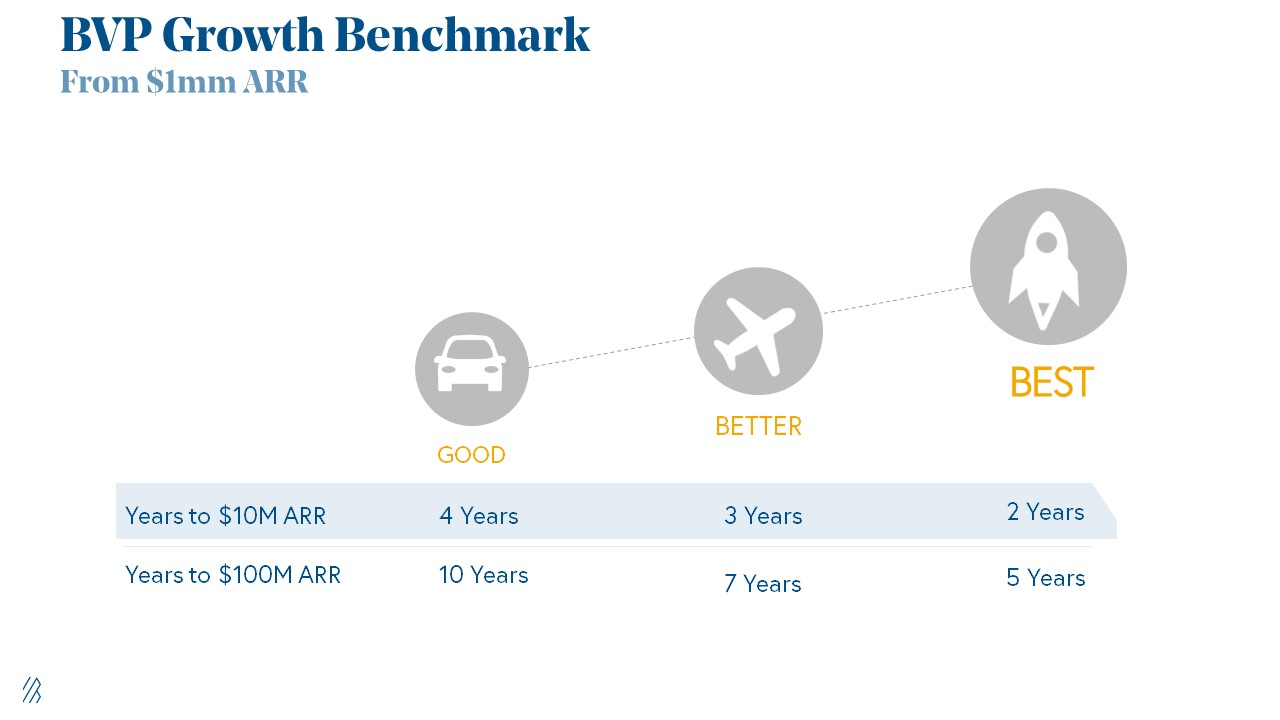
Please beat these 3 metrics before Series A:
Achieve $1.5m ARR in 12-24 months (Market risk)
Above 100% Net Dollar Retention. (Market danger)
Lead Velocity Rate supporting $10m ARR in 2–4 years (Execution risk)
Hit the 3 and you'll raise $10M in 4 months. Discussing 2/3 may take 6–7 months.
If none, don't bother raising and focus on becoming a capital-efficient business (Topics for other posts).
Let's examine these 3 metrics for the brave ones.
1. Lead Velocity Rate supporting €$10m ARR in 2 to 4 years
Last because it's the least discussed. LVR is the most reliable data when evaluating a growth engine, in my opinion.
SaaS allows you to see the future.
Monthly Sales and Sales Pipelines, two predictive KPIs, have poor data quality. Both are lagging indicators, and minor changes can cause huge modeling differences.
Analysts and Associates will trash your forecasts if they're based only on Monthly Sales and Sales Pipeline.
LVR, defined as month-over-month growth in qualified leads, is rock-solid. There's no lag. You can See The Future if you use Qualified Leads and a consistent formula and process to qualify them.
With this metric in your hand, scaling your company turns into an execution play on which VCs are able to perform calculations risk.
2. Above-100% Net Dollar Retention.
Net Dollar Retention is a better-known SaaS health metric than LVR.
Net Dollar Retention measures a SaaS company's ability to retain and upsell customers. Ask what $1 of net new customer spend will be worth in years n+1, n+2, etc.
Depending on the business model, SaaS businesses can increase their share of customers' wallets by increasing users, selling them more products in SaaS-enabled marketplaces, other add-ons, and renewing them at higher price tiers.
If a SaaS company's annualized Net Dollar Retention is less than 75%, there's a problem with the business.
Slack's ARR chart (below) shows how powerful Net Retention is. Layer chart shows how existing customer revenue grows. Slack's S1 shows 171% Net Dollar Retention for 2017–2019.

Slack S-1
3. $1.5m ARR in the last 12-24 months.
According to Point 9, $0.5m-4m in ARR is needed to raise a $5–12m Series A round.
Target at least what you raised in Pre-Seed/Seed. If you've raised $1.5m since launch, don't raise before $1.5m ARR.
Capital efficiency has returned since Covid19. After raising $2m since inception, it's harder to raise $1m in ARR.

P9's 2016-2021 SaaS Funding Napkin
In summary, less than 1% of companies VCs meet get funded. These metrics can help you win.
If there’s demand for it, I’ll do one on direct-to-consumer.
Cheers!

Antonio Neto
3 years ago
Should you skip the minimum viable product?
Are MVPs outdated and have no place in modern product culture?
Frank Robinson coined "MVP" in 2001. In the same year as the Agile Manifesto, the first Scrum experiment began. MVPs are old.
The concept was created to solve the waterfall problem at the time.
The market was still sour from the .com bubble. The tech industry needed a new approach. Product and Agile gained popularity because they weren't waterfall.
More than 20 years later, waterfall is dead as dead can be, but we are still talking about MVPs. Does that make sense?
What is an MVP?
Minimum viable product. You probably know that, so I'll be brief:
[…] The MVP fits your company and customer. It's big enough to cause adoption, satisfaction, and sales, but not bloated and risky. It's the product with the highest ROI/risk. […] — Frank Robinson, SyncDev
MVP is a complete product. It's not a prototype. It's your product's first iteration, which you'll improve. It must drive sales and be user-friendly.
At the MVP stage, you should know your product's core value, audience, and price. We are way deep into early adoption territory.
What about all the things that come before?
Modern product discovery
Eric Ries popularized the term with The Lean Startup in 2011. (Ries would work with the concept since 2008, but wide adoption came after the book was released).
Ries' definition of MVP was similar to Robinson's: "Test the market" before releasing anything. Ries never mentioned money, unlike Jobs. His MVP's goal was learning.
“Remove any feature, process, or effort that doesn't directly contribute to learning” — Eric Ries, The Lean Startup
Product has since become more about "what" to build than building it. What started as a learning tool is now a discovery discipline: fake doors, prototyping, lean inception, value proposition canvas, continuous interview, opportunity tree... These are cheap, effective learning tools.
Over time, companies realized that "maximum ROI divided by risk" started with discovery, not the MVP. MVPs are still considered discovery tools. What is the problem with that?
Time to Market vs Product Market Fit
Waterfall's Time to Market is its biggest flaw. Since projects are sliced horizontally rather than vertically, when there is nothing else to be done, it’s not because the product is ready, it’s because no one cares to buy it anymore.
MVPs were originally conceived as a way to cut corners and speed Time to Market by delivering more customer requests after they paid.
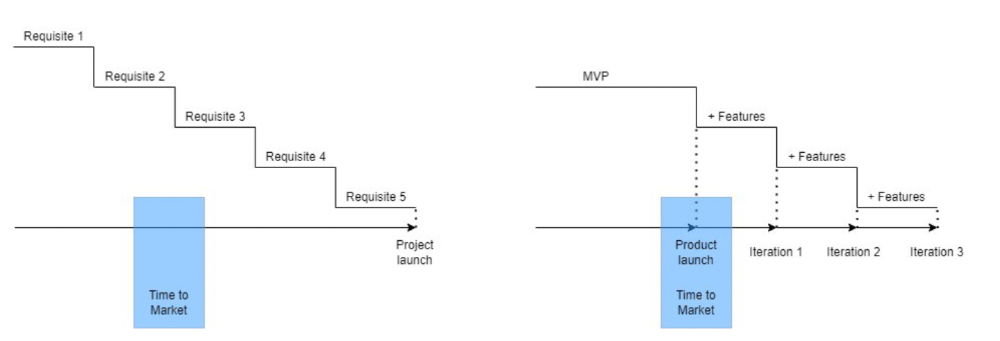
Original product development was waterfall-like.
Time to Market defines an optimal, specific window in which value should be delivered. It's impossible to predict how long or how often this window will be open.
Product Market Fit makes this window a "state." You don’t achieve Product Market Fit, you have it… and you may lose it.
Take, for example, Snapchat. They had a great time to market, but lost product-market fit later. They regained product-market fit in 2018 and have grown since.
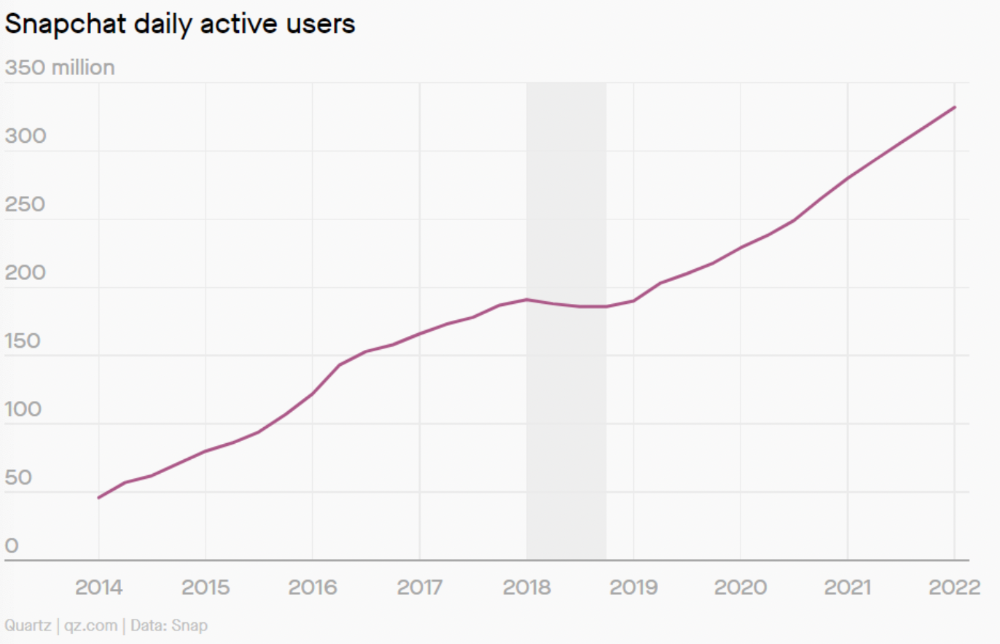
An MVP couldn't handle this. What should Snapchat do? Launch Snapchat 2 and see what the market was expecting differently from the last time? MVPs are a snapshot in time that may be wrong in two weeks.
MVPs are mini-projects. Instead of spending a lot of time and money on waterfall, you spend less but are still unsure of the results.
MVPs aren't always wrong. When releasing your first product version, consider an MVP.
Minimum viable product became less of a thing on its own and more interchangeable with Alpha Release or V.1 release over time.
Modern discovery technics are more assertive and predictable than the MVP, but clarity comes only when you reach the market.
MVPs aren't the starting point, but they're the best way to validate your product concept.
You might also like

mbvissers.eth
3 years ago
Why does every smart contract seem to implement ERC165?

ERC165 (or EIP-165) is a standard utilized by various open-source smart contracts like Open Zeppelin or Aavegotchi.
What's it? You must implement? Why do we need it? I'll describe the standard and answer any queries.
What is ERC165
ERC165 detects and publishes smart contract interfaces. Meaning? It standardizes how interfaces are recognized, how to detect if they implement ERC165, and how a contract publishes the interfaces it implements. How does it work?
Why use ERC165? Sometimes it's useful to know which interfaces a contract implements, and which version.
Identifying interfaces
An interface function's selector. This verifies an ABI function. XORing all function selectors defines an interface in this standard. The following code demonstrates.
// SPDX-License-Identifier: UNLICENCED
pragma solidity >=0.8.0 <0.9.0;

interface Solidity101 {
    function hello() external pure;
    function world(int) external pure;
}

contract Selector {
    function calculateSelector() public pure returns (bytes4) {
        Solidity101 i;
        return i.hello.selector ^ i.world.selector;
        // Returns 0xc6be8b58
    }

    function getHelloSelector() public pure returns (bytes4) {
        Solidity101 i;
        return i.hello.selector;
        // Returns 0x19ff1d21
    }

    function getWorldSelector() public pure returns (bytes4) {
        Solidity101 i;
        return i.world.selector;
        // Returns 0xdf419679
    }
}
This code isn't necessary to understand function selectors and how an interface's selector can be determined from the functions it implements.
Run that sample in Remix to see how interface function modifications affect contract function output.
Contracts publish their implemented interfaces.
We can identify interfaces. Now we must disclose the interfaces we're implementing. First, import IERC165 like so.
pragma solidity ^0.4.20;

interface ERC165 {
    /// @notice Query if a contract implements an interface
    /// @param interfaceID The interface identifier, as specified in ERC-165
    /// @dev Interface identification is specified in ERC-165.
    /// @return `true` if the contract implements `interfaceID` and
    ///  `interfaceID` is not 0xffffffff, `false` otherwise
    function supportsInterface(bytes4 interfaceID) external view returns (bool);
}
We still need to build this interface in our smart contract. ERC721 from OpenZeppelin is a good example.
// SPDX-License-Identifier: MIT
// OpenZeppelin Contracts (last updated v4.5.0) (token/ERC721/ERC721.sol)

pragma solidity ^0.8.0;

import "./IERC721.sol";
import "./extensions/IERC721Metadata.sol";
import "../../utils/introspection/ERC165.sol";
// ...

contract ERC721 is Context, ERC165, IERC721, IERC721Metadata {
  // ...

  function supportsInterface(bytes4 interfaceId) public view virtual override(ERC165, IERC165) returns (bool) {
    return
      interfaceId == type(IERC721).interfaceId ||
      interfaceId == type(IERC721Metadata).interfaceId ||
      super.supportsInterface(interfaceId);
  }

  // ...
}
I deleted unnecessary code. The smart contract imports ERC165, IERC721 and IERC721Metadata. The is keyword at smart contract declaration implements all three.
Kind (interface).
Note that type(interface).interfaceId returns the same as the interface selector.
We override supportsInterface in the smart contract to return a boolean that checks if interfaceId is the same as one of the implemented contracts.
Super.supportsInterface() calls ERC165 code. Checks if interfaceId is IERC165.
function supportsInterface(bytes4 interfaceId) public view virtual override returns (bool) {
    return interfaceId == type(IERC165).interfaceId;
}
So, if we run supportsInterface with an interfaceId, our contract function returns true if it's implemented and false otherwise. True for IERC721, IERC721Metadata, andIERC165.
Conclusion
I hope this post has helped you understand and use ERC165 and why it's employed.
Have a great day, thanks for reading!

Solomon Ayanlakin
3 years ago
Metrics for product management and being a good leader
Never design a product without explicit metrics and tracking tools.
Imagine driving cross-country without a dashboard. How do you know your school zone speed? Low gas? Without a dashboard, you can't monitor your car. You can't improve what you don't measure, as Peter Drucker said. Product managers must constantly enhance their understanding of their users, how they use their product, and how to improve it for optimum value. Customers will only pay if they consistently acquire value from your product.
I’m Solomon Ayanlakin. I’m a product manager at CredPal, a financial business that offers credit cards and Buy Now Pay Later services. Before falling into product management (like most PMs lol), I self-trained as a data analyst, using Alex the Analyst's YouTube playlists and DannyMas' virtual data internship. This article aims to help product managers, owners, and CXOs understand product metrics, give a methodology for creating them, and execute product experiments to enhance them.
☝🏽Introduction
Product metrics assist companies track product performance from the user's perspective. Metrics help firms decide what to construct (feature priority), how to build it, and the outcome's success or failure. To give the best value to new and existing users, track product metrics.
Why should a product manager monitor metrics?
to assist your users in having a "aha" moment
To inform you of which features are frequently used by users and which are not
To assess the effectiveness of a product feature
To aid in enhancing client onboarding and retention
To assist you in identifying areas throughout the user journey where customers are satisfied or dissatisfied
to determine the percentage of returning users and determine the reasons for their return
📈 What Metrics Ought a Product Manager to Monitor?
What indicators should a product manager watch to monitor product health? The metrics to follow change based on the industry, business stage (early, growth, late), consumer needs, and company goals. A startup should focus more on conversion, activation, and active user engagement than revenue growth and retention. The company hasn't found product-market fit or discovered what features drive customer value.
Depending on your use case, company goals, or business stage, here are some important product metric buckets:
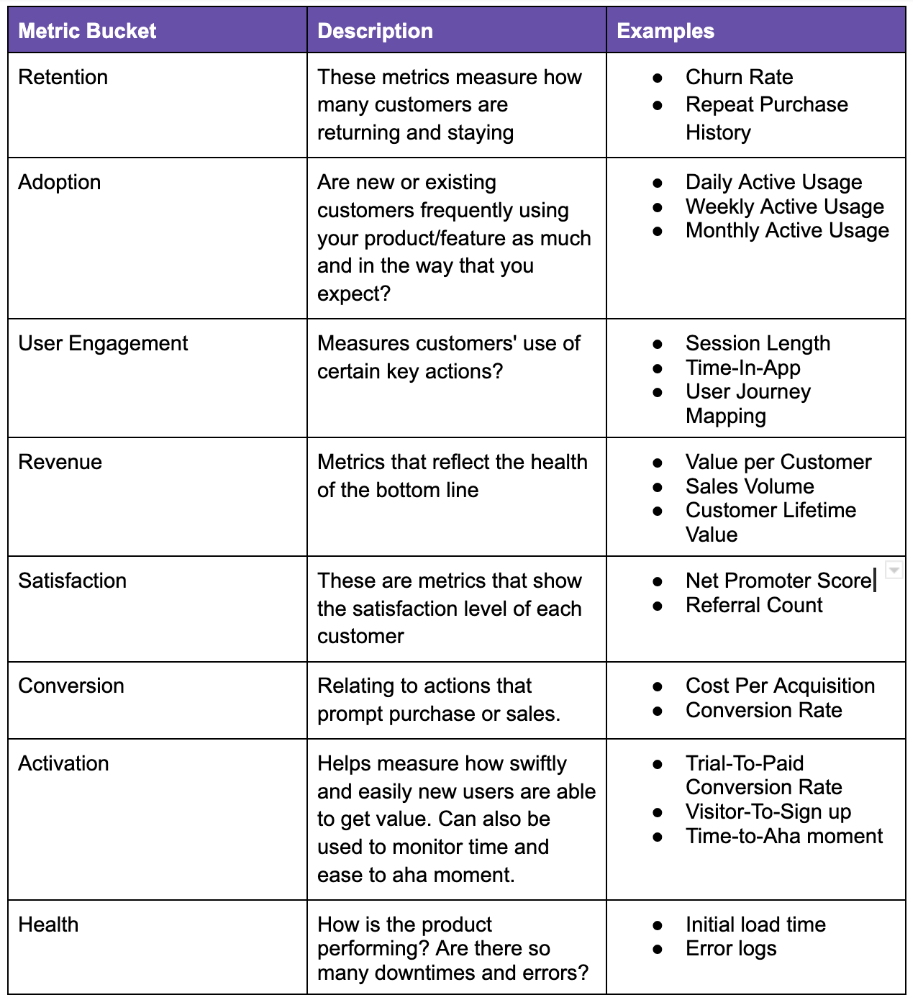
All measurements shouldn't be used simultaneously. It depends on your business goals and what value means for your users, then selecting what metrics to track to see if they get it.
Some KPIs are more beneficial to track, independent of industry or customer type. To prevent recording vanity metrics, product managers must clearly specify the types of metrics they should track. Here's how to segment metrics:
The North Star Metric, also known as the Focus Metric, is the indicator and aid in keeping track of the top value you provide to users.
Primary/Level 1 Metrics: These metrics should either add to the north star metric or be used to determine whether it is moving in the appropriate direction. They are metrics that support the north star metric.
These measures serve as leading indications for your north star and Level 2 metrics. You ought to have been aware of certain problems with your L2 measurements prior to the North star metric modifications.
North Star Metric
This is the key metric. A good north star metric measures customer value. It emphasizes your product's longevity. Many organizations fail to grow because they confuse north star measures with other indicators. A good focus metric should touch all company teams and be tracked forever. If a company gives its customers outstanding value, growth and success are inevitable. How do we measure this value?
A north star metric has these benefits:
Customer Obsession: It promotes a culture of customer value throughout the entire organization.
Consensus: Everyone can quickly understand where the business is at and can promptly make improvements, according to consensus.
Growth: It provides a tool to measure the company's long-term success. Do you think your company will last for a long time?
How can I pick a reliable North Star Metric?
Some fear a single metric. Ensure product leaders can objectively determine a north star metric. Your company's focus metric should meet certain conditions. Here are a few:
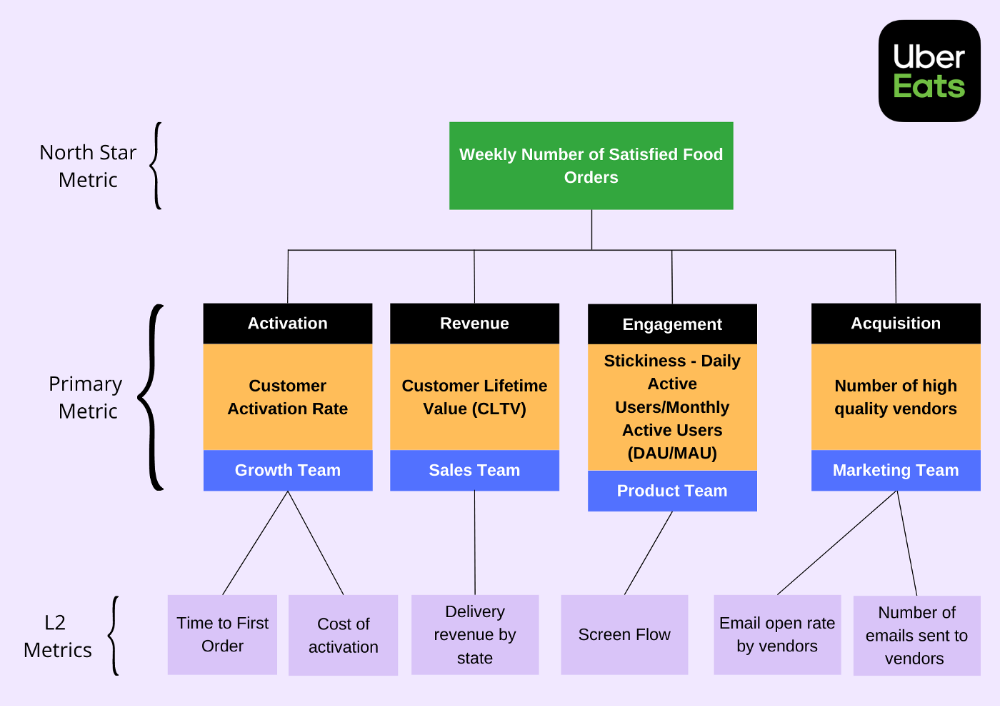
A good focus metric should reflect value and, as such, should be closely related to the point at which customers obtain the desired value from your product. For instance, the quick delivery to your home is a value proposition of UberEats. The value received from a delivery would be a suitable focal metric to use. While counting orders is alluring, the quantity of successfully completed positive review orders would make a superior north star statistic. This is due to the fact that a client who placed an order but received a defective or erratic delivery is not benefiting from Uber Eats. By tracking core value gain, which is the number of purchases that resulted in satisfied customers, we are able to track not only the total number of orders placed during a specific time period but also the core value proposition.
Focus metrics need to be quantifiable; they shouldn't only be feelings or states; they need to be actionable. A smart place to start is by counting how many times an activity has been completed.
A great focus metric is one that can be measured within predetermined time limits; otherwise, you are not measuring at all. The company can improve that measure more quickly by having time-bound focus metrics. Measuring and accounting for progress over set time periods is the only method to determine whether or not you are moving in the right path. You can then evaluate your metrics for today and yesterday. It's generally not a good idea to use a year as a time frame. Ideally, depending on the nature of your organization and the measure you are focusing on, you want to take into account on a daily, weekly, or monthly basis.
Everyone in the firm has the potential to affect it: A short glance at the well-known AAARRR funnel, also known as the Pirate Metrics, reveals that various teams inside the organization have an impact on the funnel. Ideally, the NSM should be impacted if changes are made to one portion of the funnel. Consider how the growth team in your firm is enhancing customer retention. This would have a good effect on the north star indicator because at this stage, a repeat client is probably being satisfied on a regular basis. Additionally, if the opposite were true and a client churned, it would have a negative effect on the focus metric.
It ought to be connected to the business's long-term success: The direction of sustainability would be indicated by a good north star metric. A company's lifeblood is product demand and revenue, so it's critical that your NSM points in the direction of sustainability. If UberEats can effectively increase the monthly total of happy client orders, it will remain in operation indefinitely.
Many product teams make the mistake of focusing on revenue. When the bottom line is emphasized, a company's goal moves from giving value to extracting money from customers. A happy consumer will stay and pay for your service. Customer lifetime value always exceeds initial daily, monthly, or weekly revenue.
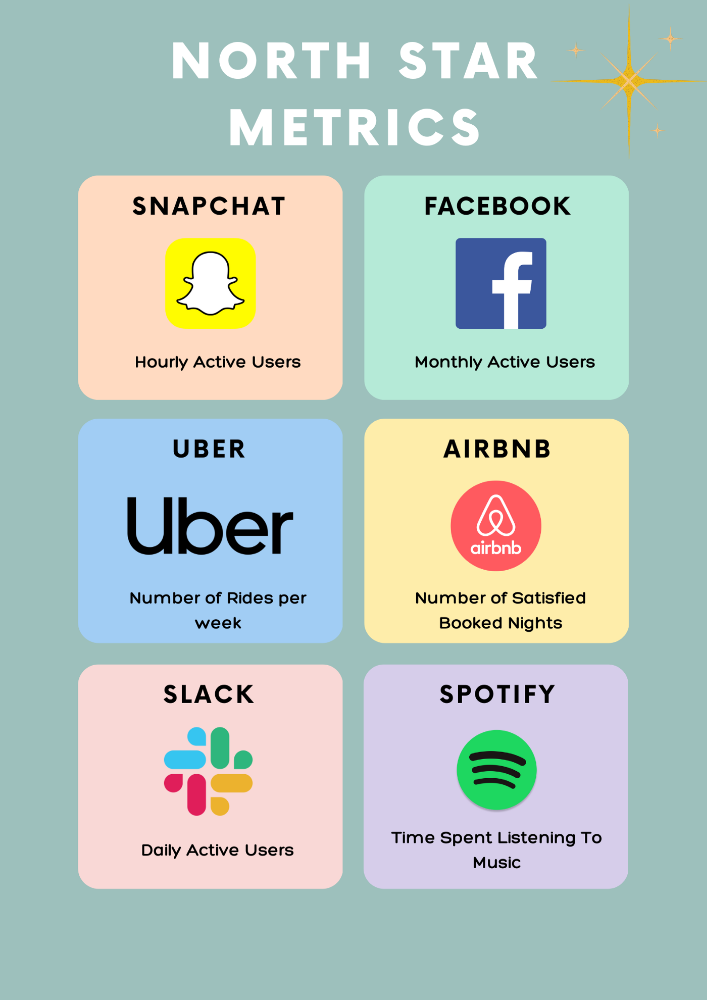
Great North Star Metrics Examples
🥇 Basic/L1 Metrics:
The NSM is broad and focuses on providing value for users, while the primary metric is product/feature focused and utilized to drive the focus metric or signal its health. The primary statistic is team-specific, whereas the north star metric is company-wide. For UberEats' NSM, the marketing team may measure the amount of quality food vendors who sign up using email marketing. With quality vendors, more orders will be satisfied. Shorter feedback loops and unambiguous team assignments make L1 metrics more actionable and significant in the immediate term.
🥈 Supporting L2 metrics:
These are supporting metrics to the L1 and focus metrics. Location, demographics, or features are examples of L1 metrics. UberEats' supporting metrics might be the number of sales emails sent to food vendors, the number of opens, and the click-through rate. Secondary metrics are low-level and evident, and they relate into primary and north star measurements. UberEats needs a high email open rate to attract high-quality food vendors. L2 is a leading sign for L1.
Where can I find product metrics?
How can I measure in-app usage and activity now that I know what metrics to track? Enter product analytics. Product analytics tools evaluate and improve product management parameters that indicate a product's health from a user's perspective.
Various analytics tools on the market supply product insight. From page views and user flows through A/B testing, in-app walkthroughs, and surveys. Depending on your use case and necessity, you may combine tools to see how users engage with your product. Gainsight, MixPanel, Amplitude, Google Analytics, FullStory, Heap, and Pendo are product tools.
This article isn't sponsored and doesn't market product analytics tools. When choosing an analytics tool, consider the following:
Tools for tracking your Focus, L1, and L2 measurements
Pricing
Adaptations to include external data sources and other products
Usability and the interface
Scalability
Security
An investment in the appropriate tool pays off. To choose the correct metrics to track, you must first understand your business need and what value means to your users. Metrics and analytics are crucial for any tech product's growth. It shows how your business is doing and how to best serve users.

Coinbase
4 years ago
10 Predictions for Web3 and the Cryptoeconomy for 2022
By Surojit Chatterjee, Chief Product Officer
2021 proved to be a breakout year for crypto with BTC price gaining almost 70% yoy, Defi hitting $150B in value locked, and NFTs emerging as a new category. Here’s my view through the crystal ball into 2022 and what it holds for our industry:
1. Eth scalability will improve, but newer L1 chains will see substantial growth — As we welcome the next hundred million users to crypto and Web3, scalability challenges for Eth are likely to grow. I am optimistic about improvements in Eth scalability with the emergence of Eth2 and many L2 rollups. Traction of Solana, Avalanche and other L1 chains shows that we’ll live in a multi-chain world in the future. We’re also going to see newer L1 chains emerge that focus on specific use cases such as gaming or social media.
2. There will be significant usability improvements in L1-L2 bridges — As more L1 networks gain traction and L2s become bigger, our industry will desperately seek improvements in speed and usability of cross-L1 and L1-L2 bridges. We’re likely to see interesting developments in usability of bridges in the coming year.
3. Zero knowledge proof technology will get increased traction — 2021 saw protocols like ZkSync and Starknet beginning to get traction. As L1 chains get clogged with increased usage, ZK-rollup technology will attract both investor and user attention. We’ll see new privacy-centric use cases emerge, including privacy-safe applications, and gaming models that have privacy built into the core. This may also bring in more regulator attention to crypto as KYC/AML could be a real challenge in privacy centric networks.
4. Regulated Defi and emergence of on-chain KYC attestation — Many Defi protocols will embrace regulation and will create separate KYC user pools. Decentralized identity and on-chain KYC attestation services will play key roles in connecting users’ real identity with Defi wallet endpoints. We’ll see more acceptance of ENS type addresses, and new systems from cross chain name resolution will emerge.
5. Institutions will play a much bigger role in Defi participation — Institutions are increasingly interested in participating in Defi. For starters, institutions are attracted to higher than average interest-based returns compared to traditional financial products. Also, cost reduction in providing financial services using Defi opens up interesting opportunities for institutions. However, they are still hesitant to participate in Defi. Institutions want to confirm that they are only transacting with known counterparties that have completed a KYC process. Growth of regulated Defi and on-chain KYC attestation will help institutions gain confidence in Defi.
6. Defi insurance will emerge — As Defi proliferates, it also becomes the target of security hacks. According to London-based firm Elliptic, total value lost by Defi exploits in 2021 totaled over $10B. To protect users from hacks, viable insurance protocols guaranteeing users’ funds against security breaches will emerge in 2022.
7. NFT Based Communities will give material competition to Web 2.0 social networks — NFTs will continue to expand in how they are perceived. We’ll see creator tokens or fan tokens take more of a first class seat. NFTs will become the next evolution of users’ digital identity and passport to the metaverse. Users will come together in small and diverse communities based on types of NFTs they own. User created metaverses will be the future of social networks and will start threatening the advertising driven centralized versions of social networks of today.
8. Brands will start actively participating in the metaverse and NFTs — Many brands are realizing that NFTs are great vehicles for brand marketing and establishing brand loyalty. Coca-Cola, Campbell’s, Dolce & Gabbana and Charmin released NFT collectibles in 2021. Adidas recently launched a new metaverse project with Bored Ape Yacht Club. We’re likely to see more interesting brand marketing initiatives using NFTs. NFTs and the metaverse will become the new Instagram for brands. And just like on Instagram, many brands may start as NFT native. We’ll also see many more celebrities jumping in the bandwagon and using NFTs to enhance their personal brand.
9. Web2 companies will wake up and will try to get into Web3 — We’re already seeing this with Facebook trying to recast itself as a Web3 company. We’re likely to see other big Web2 companies dipping their toes into Web3 and metaverse in 2022. However, many of them are likely to create centralized and closed network versions of the metaverse.
10. Time for DAO 2.0 — We’ll see DAOs become more mature and mainstream. More people will join DAOs, prompting a change in definition of employment — never receiving a formal offer letter, accepting tokens instead of or along with fixed salaries, and working in multiple DAO projects at the same time. DAOs will also confront new challenges in terms of figuring out how to do M&A, run payroll and benefits, and coordinate activities in larger and larger organizations. We’ll see a plethora of tools emerge to help DAOs execute with efficiency. Many DAOs will also figure out how to interact with traditional Web2 companies. We’re likely to see regulators taking more interest in DAOs and make an attempt to educate themselves on how DAOs work.
Thanks to our customers and the ecosystem for an incredible 2021. Looking forward to another year of building the foundations for Web3. Wagmi.