

More on Entrepreneurship/Creators

Jim Siwek
3 years ago
In 2022, can a lone developer be able to successfully establish a SaaS product?

In the early 2000s, I began developing SaaS. I helped launch an internet fax service that delivered faxes to email inboxes. Back then, it saved consumers money and made the procedure easier.
Google AdWords was young then. Anyone might establish a new website, spend a few hundred dollars on keywords, and see dozens of new paying clients every day. That's how we launched our new SaaS, and these clients stayed for years. Our early ROI was sky-high.
Changing times
The situation changed dramatically after 15 years. Our paid advertising cost $200-$300 for every new customer. Paid advertising takes three to four years to repay.
Fortunately, we still had tens of thousands of loyal clients. Good organic rankings gave us new business. We needed less sponsored traffic to run a profitable SaaS firm.
Is it still possible?
Since selling our internet fax firm, I've dreamed about starting a SaaS company. One I could construct as a lone developer and progressively grow a dedicated customer base, as I did before in a small team.
It seemed impossible to me. Solo startups couldn't afford paid advertising. SEO was tough. Even the worst SaaS startup ideas attracted VC funding. How could I compete with startups that could hire great talent and didn't need to make money for years (or ever)?
The One and Only Way to Learn
After years of talking myself out of SaaS startup ideas, I decided to develop and launch one. I needed to know if a solitary developer may create a SaaS app in 2022.
Thus, I did. I invented webwriter.ai, an AI-powered writing tool for website content, from hero section headlines to blog posts, this year. I soft-launched an MVP in July.
Considering the Issue
Now that I've developed my own fully capable SaaS app for site builders and developers, I wonder if it's still possible. Can webwriter.ai be successful?
I know webwriter.ai's proposal is viable because Jasper.ai and Grammarly are also AI-powered writing tools. With competition comes validation.
To Win, Differentiate
To compete with well-funded established brands, distinguish to stand out to a portion of the market. So I can speak directly to a target user, unlike larger competition.
I created webwriter.ai to help web builders and designers produce web content rapidly. This may be enough differentiation for now.
Budget-Friendly Promotion
When paid search isn't an option, we get inventive. There are more tools than ever to promote a new website.
Organic Results
on social media (Twitter, Instagram, TikTok, LinkedIn)
Marketing with content that is compelling
Link Creation
Listings in directories
references made in blog articles and on other websites
Forum entries
The Beginning of the Journey
As I've labored to construct my software, I've pondered a new mantra. Not sure where that originated from, but I like it. I'll live by it and teach my kids:
“Do the work.”

Keagan Stokoe
3 years ago
Generalists Create Startups; Specialists Scale Them
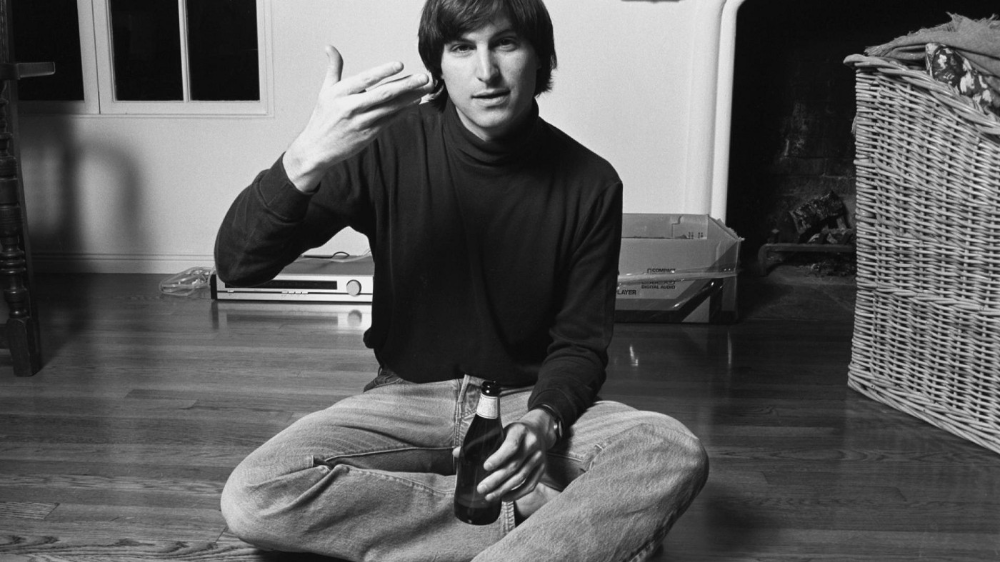
There’s a funny part of ‘Steve Jobs’ by Walter Isaacson where Jobs says that Bill Gates was more a copier than an innovator:
“Bill is basically unimaginative and has never invented anything, which is why I think he’s more comfortable now in philanthropy than technology. He just shamelessly ripped off other people’s ideas….He’d be a broader guy if he had dropped acid once or gone off to an ashram when he was younger.”
Gates lacked flavor. Nobody ever got excited about a Microsoft launch, despite their good products. Jobs had the world's best product taste. Apple vs. Microsoft.
A CEO's core job functions are all driven by taste: recruiting, vision, and company culture all require good taste. Depending on the type of company you want to build, know where you stand between Microsoft and Apple.
How can you improve your product judgment? How to acquire taste?
Test and refine
Product development follows two parallel paths: the ‘customer obsession’ path and the ‘taste and iterate’ path.
The customer obsession path involves solving customer problems. Lean Startup frameworks show you what to build at each step.
Taste-and-iterate doesn't involve the customer. You iterate internally and rely on product leaders' taste and judgment.
Creative Selection by Ken Kocienda explains this method. In Creative Selection, demos are iterated and presented to product leaders. Your boss presents to their boss, and so on up to Steve Jobs. If you have good product taste, you can be a panelist.
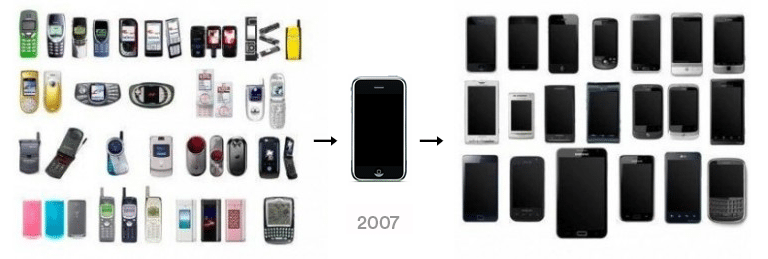
The iPhone follows this path. Before seeing an iPhone, consumers couldn't want one. Customer obsession wouldn't have gotten you far because iPhone buyers didn't know they wanted one.
In The Hard Thing About Hard Things, Ben Horowitz writes:
“It turns out that is exactly what product strategy is all about — figuring out the right product is the innovator’s job, not the customer’s job. The customer only knows what she thinks she wants based on her experience with the current product. The innovator can take into account everything that’s possible, but often must go against what she knows to be true. As a result, innovation requires a combination of knowledge, skill, and courage.“
One path solves a problem the customer knows they have, and the other doesn't. Instead of asking a person what they want, observe them and give them something they didn't know they needed.
It's much harder. Apple is the world's most valuable company because it's more valuable. It changes industries permanently.
If you want to build superior products, use the iPhone of your industry.
How to Improve Your Taste
I. Work for a company that has taste.
People with the best taste in products, markets, and people are rewarded for building great companies. Tasteful people know quality even when they can't describe it. Taste isn't writable. It's feel-based.
Moving into a community that's already doing what you want to do may be the best way to develop entrepreneurial taste. Most company-building knowledge is tacit.
Joining a company you want to emulate allows you to learn its inner workings. It reveals internal patterns intuitively. Many successful founders come from successful companies.
Consumption determines taste. Excellence will refine you. This is why restauranteurs visit the world's best restaurants and serious painters visit Paris or New York. Joining a company with good taste is beneficial.
2. Possess a wide range of interests
“Edwin Land of Polaroid talked about the intersection of the humanities and science. I like that intersection. There’s something magical about that place… The reason Apple resonates with people is that there’s a deep current of humanity in our innovation. I think great artists and great engineers are similar, in that they both have a desire to express themselves.” — Steve Jobs
I recently discovered Edwin Land. Jobs modeled much of his career after Land's. It makes sense that Apple was inspired by Land.
A Triumph of Genius: Edwin Land, Polaroid, and the Kodak Patent War notes:
“Land was introverted in person, but supremely confident when he came to his ideas… Alongside his scientific passions, lay knowledge of art, music, and literature. He was a cultured person growing even more so as he got older, and his interests filtered into the ethos of Polaroid.”
Founders' philosophies shape companies. Jobs and Land were invested. It showed in the products their companies made. Different. His obsession was spreading Microsoft software worldwide. Microsoft's success is why their products are bland and boring.
Experience is important. It's probably why startups are built by generalists and scaled by specialists.
Jobs combined design, typography, storytelling, and product taste at Apple. Some of the best original Mac developers were poets and musicians. Edwin Land liked broad-minded people, according to his biography. Physicist-musicians or physicist-photographers.
Da Vinci was a master of art, engineering, architecture, anatomy, and more. He wrote and drew at the same desk. His genius is remembered centuries after his death. Da Vinci's statue would stand at the intersection of humanities and science.
We find incredibly creative people here. Superhumans. Designers, creators, and world-improvers. These are the people we need to navigate technology and lead world-changing companies. Generalists lead.

SAHIL SAPRU
3 years ago
Growth tactics that grew businesses from 1 to 100
Everyone wants a scalable startup.
Innovation helps launch a startup. The secret to a scalable business is growth trials (from 1 to 100).
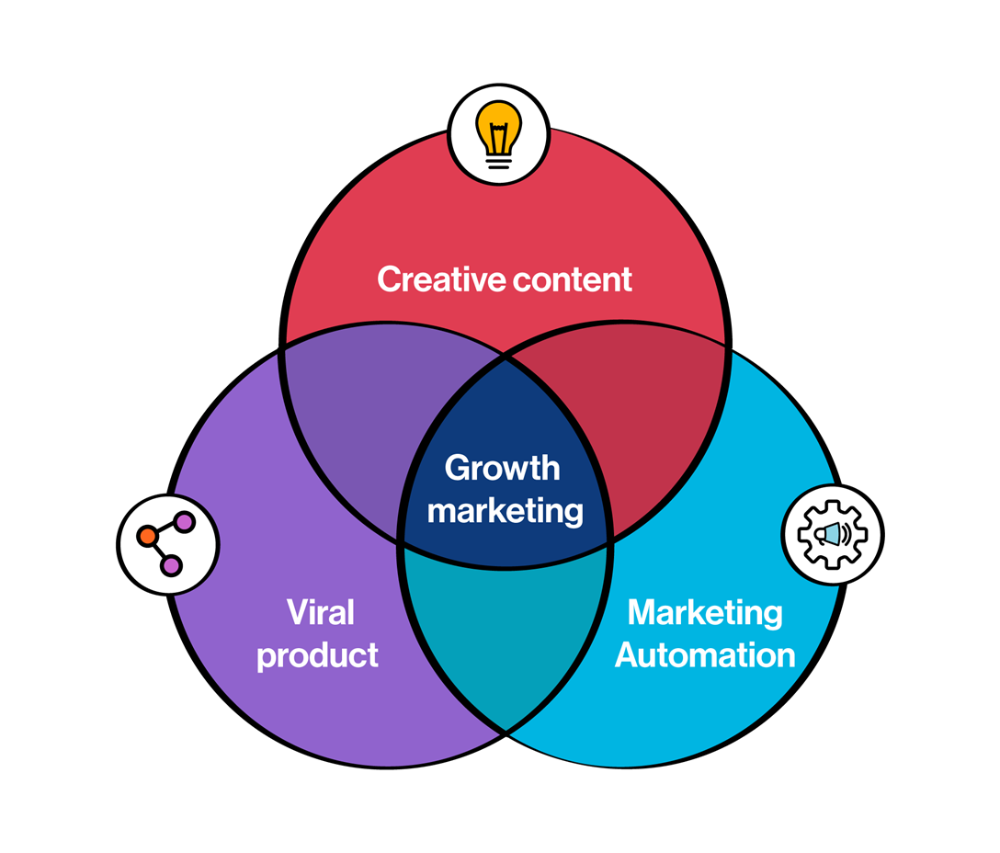
Growth marketing combines marketing and product development for long-term growth.
Today, I'll explain growth hacking strategies popular startups used to scale.
1/ A Facebook user's social value is proportional to their friends.
Facebook built its user base using content marketing and paid ads. Mark and his investors feared in 2007 when Facebook's growth stalled at 90 million users.
Chamath Palihapitiya was brought in by Mark.
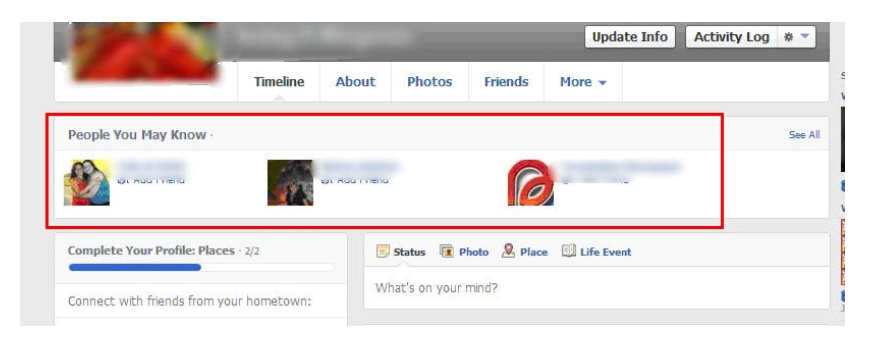
The team tested SEO keywords and MAU chasing. The growth team introduced “people you may know”
This feature reunited long-lost friends and family. Casual users became power users as the retention curve flattened.
Growth Hack Insights: With social network effect the value of your product or platform increases exponentially if you have users you know or can relate with.
2/ Airbnb - Focus on your value propositions
Airbnb nearly failed in 2009. The company's weekly revenue was $200 and they had less than 2 months of runway.
Enter Paul Graham. The team noticed a pattern in 40 listings. Their website's property photos sucked.
Why?
Because these photos were taken with regular smartphones. Users didn't like the first impression.
Graham suggested traveling to New York to rent a camera, meet with property owners, and replace amateur photos with high-resolution ones.
A week later, the team's weekly revenue doubled to $400, indicating they were on track.
Growth Hack Insights: When selling an “online experience” ensure that your value proposition is aesthetic enough for users to enjoy being associated with them.

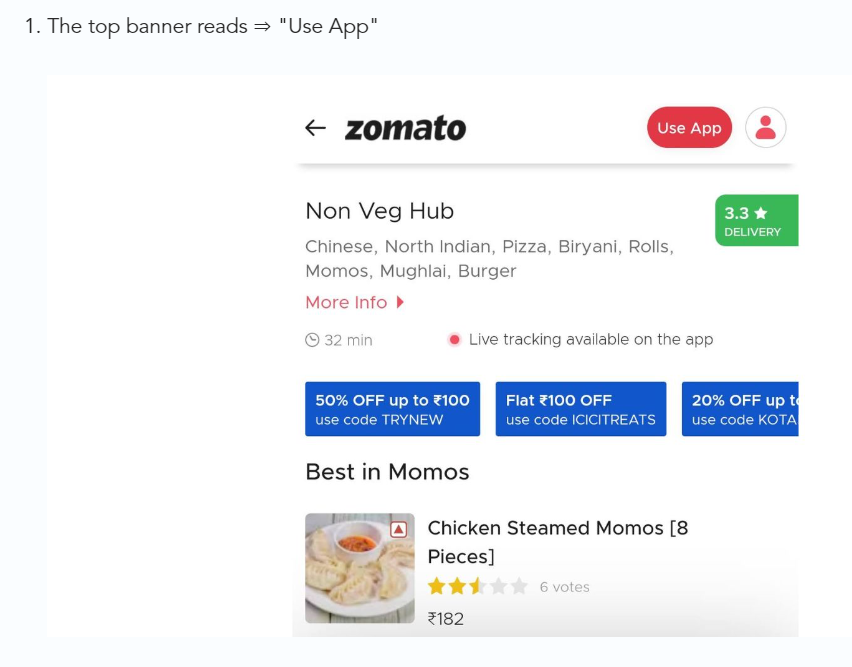
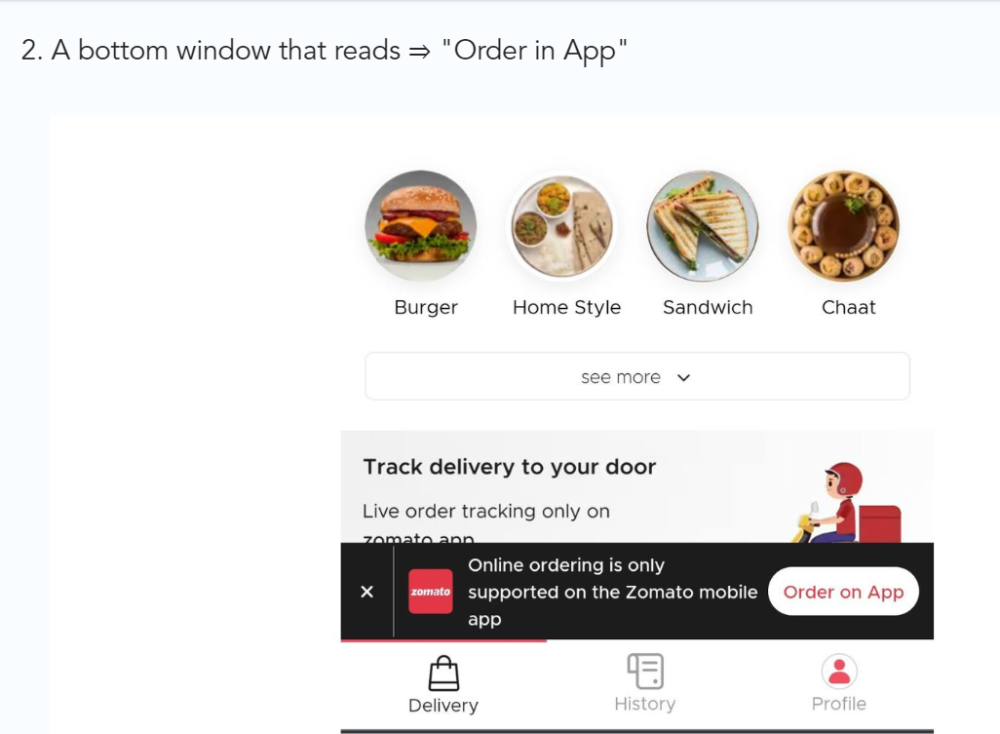
3/ Zomato - A company's smartphone push ensured growth.
Zomato delivers food. User retention was a challenge for the founders. Indian food customers are notorious for switching brands at the drop of a hat.
Zomato wanted users to order food online and repeat orders throughout the week.
Zomato created an attractive website with “near me” keywords for SEO indexing.
Zomato gambled to increase repeat orders. They only allowed mobile app food orders.
Zomato thought mobile apps were stickier. Product innovations in search/discovery/ordering or marketing campaigns like discounts/in-app notifications/nudges can improve user experience.
Zomato went public in 2021 after users kept ordering food online.
Growth Hack Insights: To improve user retention try to build platforms that build user stickiness. Your product and marketing team will do the rest for them.
4/ Hotmail - Signaling helps build premium users.
Ever sent or received an email or tweet with a sign — sent from iPhone?
Hotmail did it first! One investor suggested Hotmail add a signature to every email.
Overnight, thousands joined the company. Six months later, the company had 1 million users.
When serving an existing customer, improve their social standing. Signaling keeps the top 1%.
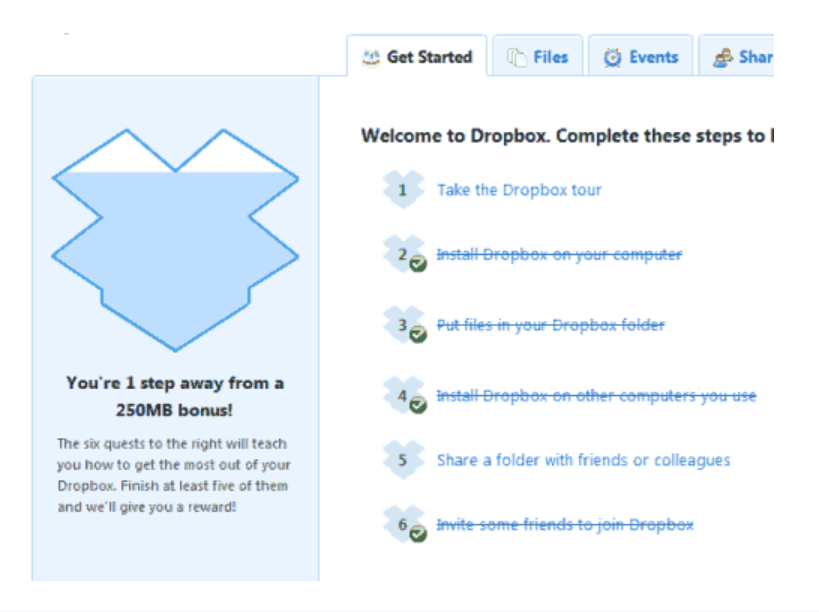
5/ Dropbox - Respect loyal customers
Dropbox is a company that puts people over profits. The company prioritized existing users.
Dropbox rewarded loyal users by offering 250 MB of free storage to anyone who referred a friend. The referral hack helped Dropbox get millions of downloads in its first few months.
Growth Hack Insights: Think of ways to improve the social positioning of your end-user when you are serving an existing customer. Signaling goes a long way in attracting the top 1% to stay.
These experiments weren’t hacks. Hundreds of failed experiments and user research drove these experiments. Scaling up experiments is difficult.
Contact me if you want to grow your startup's user base.
You might also like

Jack Burns
3 years ago
Here's what to expect from NASA Artemis 1 and why it's significant.
NASA's Artemis 1 mission will help return people to the Moon after a half-century break. The mission is a shakedown cruise for NASA's Space Launch System and Orion Crew Capsule.
The spaceship will visit the Moon, deploy satellites, and enter orbit. NASA wants to practice operating the spacecraft, test the conditions people will face on the Moon, and ensure a safe return to Earth.
We asked Jack Burns, a space scientist at the University of Colorado Boulder and former member of NASA's Presidential Transition Team, to describe the mission, explain what the Artemis program promises for space exploration, and reflect on how the space program has changed in the half-century since humans last set foot on the moon.
What distinguishes Artemis 1 from other rockets?
Artemis 1 is the Space Launch System's first launch. NASA calls this a "heavy-lift" vehicle. It will be more powerful than Apollo's Saturn V, which transported people to the Moon in the 1960s and 1970s.
It's a new sort of rocket system with two strap-on solid rocket boosters from the space shuttle. It's a mix of the shuttle and Saturn V.
The Orion Crew Capsule will be tested extensively. It'll spend a month in the high-radiation Moon environment. It will also test the heat shield, which protects the capsule and its occupants at 25,000 mph. The heat shield must work well because this is the fastest capsule descent since Apollo.
This mission will also carry miniature Moon-orbiting satellites. These will undertake vital precursor science, including as examining further into permanently shadowed craters where scientists suspect there is water and measuring the radiation environment to see long-term human consequences.
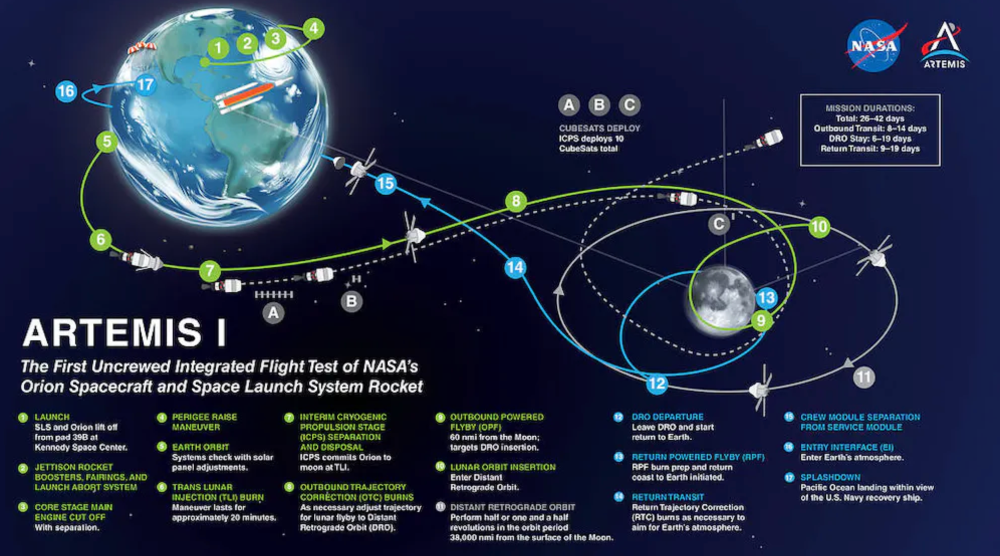
Artemis 1 will launch, fly to the Moon, place satellites, orbit it, return to Earth, and splash down in the ocean. NASA.
What's Artemis's goal? What launches are next?
The mission is a first step toward Artemis 3, which will lead to the first human Moon missions since 1972. Artemis 1 is unmanned.
Artemis 2 will have astronauts a few years later. Like Apollo 8, it will be an orbital mission that circles the Moon and returns. The astronauts will orbit the Moon longer and test everything with a crew.
Eventually, Artemis 3 will meet with the SpaceX Starship on the Moon's surface and transfer people. Orion will stay in orbit while the lunar Starship lands astronauts. They'll go to the Moon's south pole to investigate the water ice there.
Artemis is reminiscent of Apollo. What's changed in 50 years?
Kennedy wanted to beat the Soviets to the Moon with Apollo. The administration didn't care much about space flight or the Moon, but the goal would place America first in space and technology.
You live and die by the sword if you do that. When the U.S. reached the Moon, it was over. Russia lost. We planted flags and did science experiments. Richard Nixon canceled the program after Apollo 11 because the political goals were attained.
Large rocket with two boosters between two gates
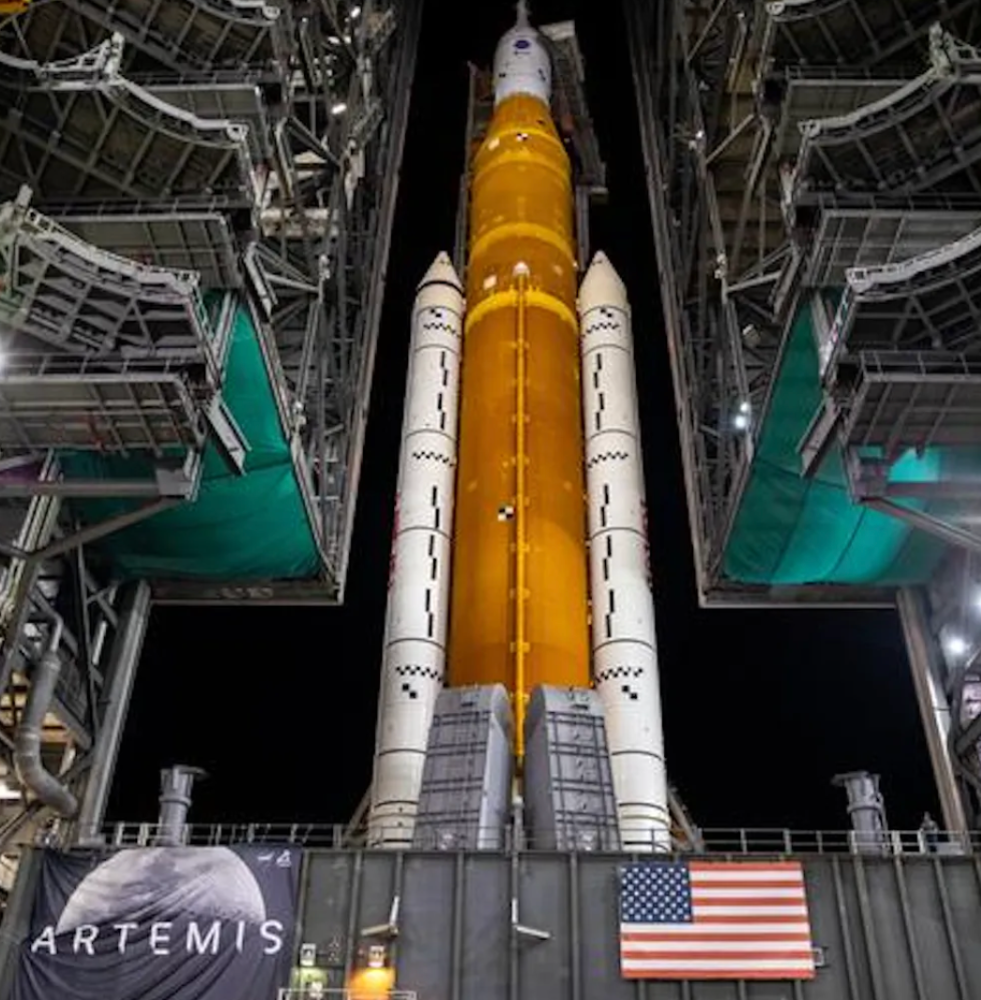
NASA's new Space Launch System is brought to a launchpad. NASA
50 years later... It's quite different. We're not trying to beat the Russians, Chinese, or anyone else, but to begin sustainable space exploration.
Artemis has many goals. It includes harnessing in-situ resources like water ice and lunar soil to make food, fuel, and building materials.
SpaceX is part of this first journey to the Moon's surface, therefore the initiative is also helping to develop a lunar and space economy. NASA doesn't own the Starship but is buying seats for astronauts. SpaceX will employ Starship to transport cargo, private astronauts, and foreign astronauts.
Fifty years of technology advancement has made getting to the Moon cheaper and more practical, and computer technology allows for more advanced tests. 50 years of technological progress have changed everything. Anyone with enough money can send a spacecraft to the Moon, but not humans.
Commercial Lunar Payload Services engages commercial companies to develop uncrewed Moon landers. We're sending a radio telescope to the Moon in January. Even 10 years ago, that was impossible.
Since humans last visited the Moon 50 years ago, technology has improved greatly.
What other changes does Artemis have in store?
The government says Artemis 3 will have at least one woman and likely a person of color.
I'm looking forward to seeing more diversity so young kids can say, "Hey, there's an astronaut that looks like me. I can do this. I can be part of the space program.”

Florian Wahl
3 years ago
An Approach to Product Strategy
I've been pondering product strategy and how to articulate it. Frameworks helped guide our thinking.
If your teams aren't working together or there's no clear path to victory, your product strategy may not be well-articulated or communicated (if you have one).
Before diving into a product strategy's details, it's important to understand its role in the bigger picture — the pieces that move your organization forward.
the overall picture
A product strategy is crucial, in my opinion. It's part of a successful product or business. It's the showpiece.
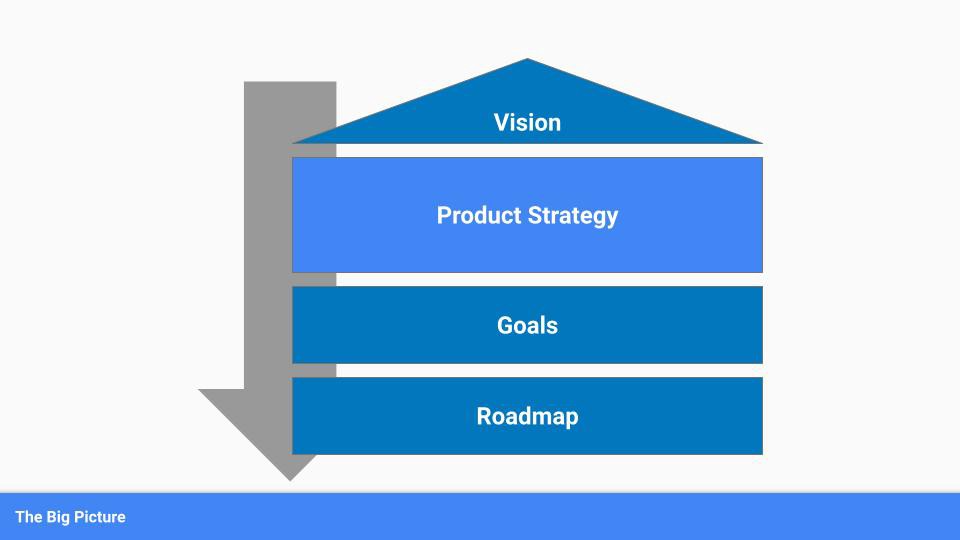
To simplify, we'll discuss four main components:
Vision
Product Management
Goals
Roadmap
Vision
Your company's mission? Your company/product in 35 years? Which headlines?
The vision defines everything your organization will do in the long term. It shows how your company impacted the world. It's your organization's rallying cry.
An ambitious but realistic vision is needed.
Without a clear vision, your product strategy may be inconsistent.
Product Management
Our main subject. Product strategy connects everything. It fulfills the vision.
In Part 2, we'll discuss product strategy.
Goals
This component can be goals, objectives, key results, targets, milestones, or whatever goal-tracking framework works best for your organization.
These product strategy metrics will help your team prioritize strategies and roadmaps.
Your company's goals should be unified. This fuels success.
Roadmap
The roadmap is your product strategy's timeline. It provides a prioritized view of your team's upcoming deliverables.
A roadmap is time-bound and includes measurable goals for your company. Your team's steps and capabilities for executing product strategy.
If your team has trouble prioritizing or defining a roadmap, your product strategy or vision is likely unclear.
Formulation of a Product Strategy
Now that we've discussed where your product strategy fits in the big picture, let's look at a framework.
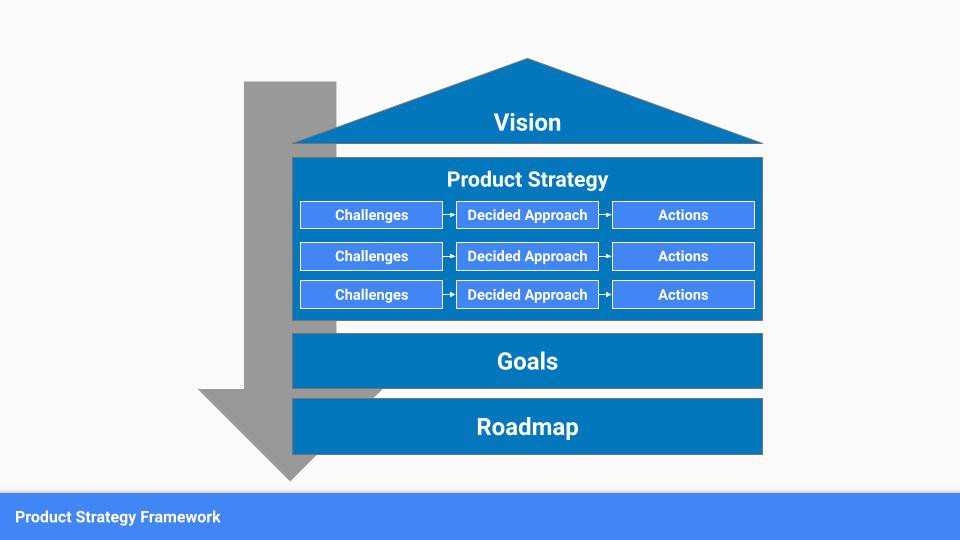
A product strategy should include challenges, an approach, and actions.
Challenges
First, analyze the problems/situations you're solving. It can be customer- or company-focused.
The analysis should explain the problems and why they're important. Try to simplify the situation and identify critical aspects.
Some questions:
What issues are we attempting to resolve?
What obstacles—internal or otherwise—are we attempting to overcome?
What is the opportunity, and why should we pursue it, in your opinion?
Decided Method
Second, describe your approach. This can be a set of company policies for handling the challenge. It's the overall approach to the first part's analysis.
The approach can be your company's bets, the solutions you've found, or how you'll solve the problems you've identified.
Again, these questions can help:
What is the value that we hope to offer to our clients?
Which market are we focusing on first?
What makes us stand out? Our benefit over rivals?
Actions
Third, identify actions that result from your approach. Second-part actions should be these.
Coordinate these actions. You may need to add products or features to your roadmap, acquire new capabilities through partnerships, or launch new marketing campaigns. Whatever fits your challenges and strategy.
Final questions:
What skills do we need to develop or obtain?
What is the chosen remedy? What are the main outputs?
What else ought to be added to our road map?
Put everything together
… and iterate!
Strategy isn't one-and-done. Changes occur. Economies change. Competitors emerge. Customer expectations change.
One unexpected event can make strategies obsolete quickly. Muscle it. Review, evaluate, and course-correct your strategies with your teams. Quarterly works. In a new or unstable industry, more often.

Karo Wanner
3 years ago
This is how I started my Twitter account.
My 12-day results look good.
Twitter seemed for old people and politicians.
I thought the platform would die soon like Facebook.
The platform's growth stalled around 300m users between 2015 and 2019.
In 2020, Twitter grew and now has almost 400m users.
Niharikaa Kaur Sodhi built a business on Twitter while I was away, despite its low popularity.
When I read about the success of Twitter users in the past 2 years, I created an account and a 3-month strategy.
I'll see if it's worth starting Twitter in 2022.
Late or perfect? I'll update you. Track my Twitter growth. You can find me here.
My Twitter Strategy
My Twitter goal is to build a community and recruit members for Mindful Monday.
I believe mindfulness is the only way to solve problems like poverty, inequality, and the climate crisis.
The power of mindfulness is my mission.
Mindful Monday is your weekly reminder to live in the present moment. I send mindfulness tips every Monday.
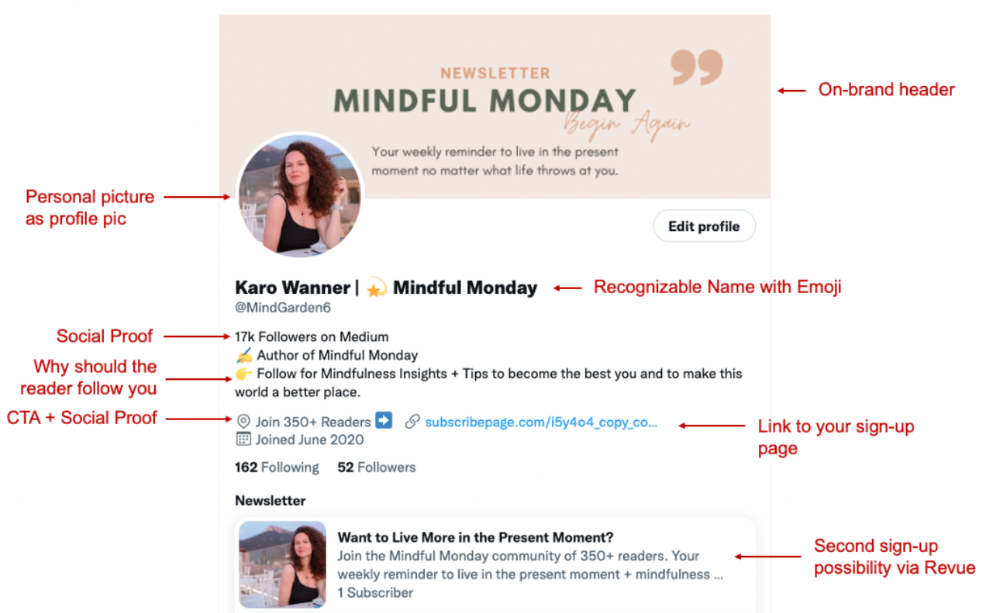
My Twitter profile promotes Mindful Monday and encourages people to join.
What I paid attention to:
I designed a brand-appropriate header to promote Mindful Monday.
Choose a profile picture. People want to know who you are.
I added my name as I do on Medium, Instagram, and emails. To stand out and be easily recognized, add an emoji if appropriate. Add what you want to be known for, such as Health Coach, Writer, or Newsletter.
People follow successful, trustworthy people. Describe any results you have. This could be views, followers, subscribers, or major news outlets. Create!
Tell readers what they'll get by following you. Can you help?
Add CTA to your profile. Your Twitter account's purpose. Give instructions. I placed my sign-up link next to the CTA to promote Mindful Monday. Josh Spector recommended this. (Thanks! Bonus tip: If you don't want the category to show in your profile, e.g. Entrepreneur, go to edit profile, edit professional profile, and choose 'Other'
Here's my Twitter:
I'm no expert, but I tried. Please share any additional Twitter tips and suggestions in the comments.
To hide your Revue newsletter subscriber count:
Join Revue. Select 'Hide Subscriber Count' in Account settings > Settings > Subscriber Count. Voila!
How frequently should you tweet?
1 to 20 Tweets per day, but consistency is key.
Stick to a daily tweet limit. Start with less and be consistent than the opposite.
I tweet 3 times per day. That's my comfort zone. Larger accounts tweet 5–7 times daily.
Do what works for you and that is the right amount.
Twitter is a long-term game, so plan your tweets for a year.
How to Batch Your Tweets?
Sunday batchs.
Sunday evenings take me 1.5 hours to create all my tweets for the week.
Use a word document and write down your posts. Podcasts, books, my own articles inspire me.
When I have a good idea or see a catchy Tweet, I take a screenshot.
To not copy but adapt.
Two pillars support my content:
(90% ~ 29 tweets per week) Inspirational quotes, mindfulness tips, zen stories, mistakes, myths, book recommendations, etc.
(10% 2 tweets per week) I share how I grow Mindful Monday with readers. This pillar promotes MM and behind-the-scenes content.
Second, I schedule all my Tweets using TweetDeck. I tweet at 7 a.m., 5 p.m., and 6 p.m.
Include Twitter Threads in your content strategy
Tweets are blog posts. In your first tweet, you include a headline, then tweet your content.
That’s how you create a series of connected Tweets.
What’s the point? You have more room to convince your reader you're an expert.
Add a call-to-action to your thread.
Follow for more like this
Newsletter signup (share your link)
Ask for retweet
One thread per week is my goal.
I'll schedule threads with Typefully. In the free version, you can schedule one Tweet, but that's fine.
Pin a thread to the top of your profile if it leads to your newsletter. So new readers see your highest-converting content first.
Tweet Medium posts
I also tweet Medium articles.
I schedule 1 weekly repost for 5 weeks after each publication. I share the same article daily for 5 weeks.
Every time I tweet, I include a different article quote, so even if the link is the same, the quote adds value.
Engage Other Experts
When you first create your account, few people will see it. Normal.
If you comment on other industry accounts, you can reach their large audience.
First, you need 50 to 100 followers. Here's my beginner tip.
15 minutes a day or when I have downtime, I comment on bigger accounts in my niche.
My 12-Day Results
Now let's look at the first data.
I had 32 followers on March 29. 12 followers in 11 days. I have 52 now.
Not huge, but growing rapidly.
Let's examine impressions/views.
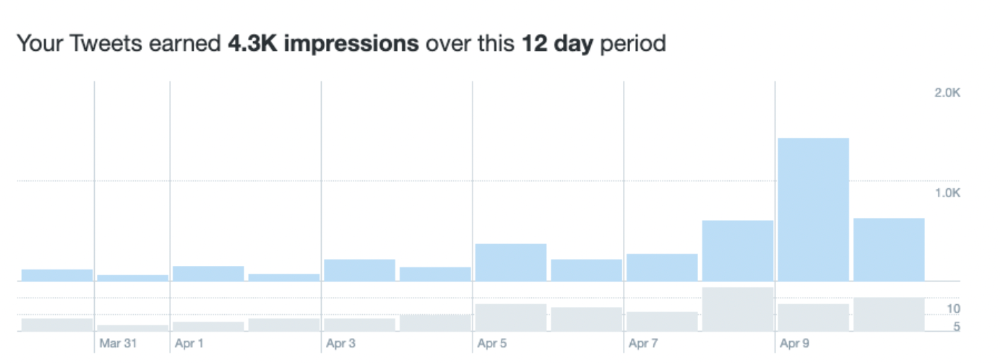
As a newbie, I gained 4,300 impressions/views in 12 days. On Medium, I got fewer views.
The 1,6k impressions per day spike comes from a larger account I mentioned the day before. First, I was shocked to see the spike and unsure of its origin.
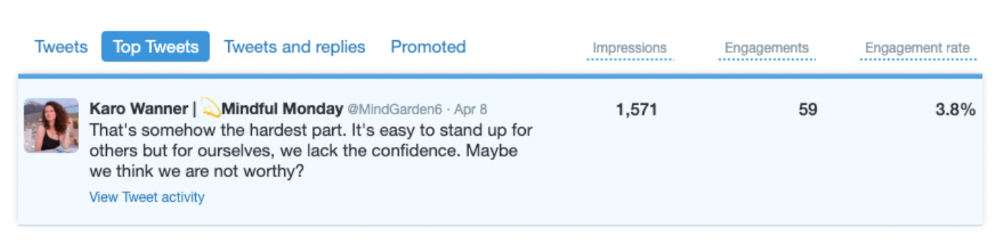
These results are promising given the effort required to be consistent on Twitter.
Let's see how my journey progresses. I'll keep you posted.
Tweeters, Does this content strategy make sense? What's wrong? Comment below.
Let's support each other on Twitter. Here's me.
Which Twitter strategy works for you in 2022?
This post is a summary. Read the full article here