


More on Leadership

Aniket
3 years ago
Yahoo could have purchased Google for $1 billion
Let's see this once-dominant IT corporation crumble.

What's the capital of Kazakhstan? If you don't know the answer, you can probably find it by Googling. Google Search returned results for Nur-Sultan in 0.66 seconds.
Google is the best search engine I've ever used. Did you know another search engine ruled the Internet? I'm sure you guessed Yahoo!
Google's friendly UI and wide selection of services make it my top choice. Let's explore Yahoo's decline.
Yahoo!
YAHOO stands for Yet Another Hierarchically Organized Oracle. Jerry Yang and David Filo established Yahoo.
Yahoo is primarily a search engine and email provider. It offers News and an advertising platform. It was a popular website in 1995 that let people search the Internet directly. Yahoo began offering free email in 1997 by acquiring RocketMail.
According to a study, Yahoo used Google Search Engine technology until 2000 and then developed its own in 2004.
Yahoo! rejected buying Google for $1 billion
Larry Page and Sergey Brin, Google's founders, approached Yahoo in 1998 to sell Google for $1 billion so they could focus on their studies. Yahoo denied the offer, thinking it was overvalued at the time.
Yahoo realized its error and offered Google $3 billion in 2002, but Google demanded $5 billion since it was more valuable. Yahoo thought $5 billion was overpriced for the existing market.
In 2022, Google is worth $1.56 Trillion.
What happened to Yahoo!
Yahoo refused to buy Google, and Google's valuation rose, making a purchase unfeasible.
Yahoo started losing users when Google launched Gmail. Google's UI was far cleaner than Yahoo's.
Yahoo offered $1 billion to buy Facebook in July 2006, but Zuckerberg and the board sought $1.1 billion. Yahoo rejected, and Facebook's valuation rose, making it difficult to buy.
Yahoo was losing users daily while Google and Facebook gained many. Google and Facebook's popularity soared. Yahoo lost value daily.
Microsoft offered $45 billion to buy Yahoo in February 2008, but Yahoo declined. Microsoft increased its bid to $47 billion after Yahoo said it was too low, but Yahoo rejected it. Then Microsoft rejected Yahoo’s 10% bid increase in May 2008.
In 2015, Verizon bought Yahoo for $4.5 billion, and Apollo Global Management bought 90% of Yahoo's shares for $5 billion in May 2021. Verizon kept 10%.
Yahoo's opportunity to acquire Google and Facebook could have been a turning moment. It declined Microsoft's $45 billion deal in 2008 and was sold to Verizon for $4.5 billion in 2015. Poor decisions and lack of vision caused its downfall. Yahoo's aim wasn't obvious and it didn't stick to a single domain.
Hence, a corporation needs a clear vision and a leader who can see its future.
Liked this article? Join my tech and programming newsletter here.

Sean Bloomfield
3 years ago
How Jeff Bezos wins meetings over

We've all been there: You propose a suggestion to your team at a meeting, and most people appear on board, but a handful or small minority aren't. How can we achieve collective buy-in when we need to go forward but don't know how to deal with some team members' perceived intransigence?
Steps:
Investigate the divergent opinions: Begin by sincerely attempting to comprehend the viewpoint of your disagreeing coworkers. Maybe it makes sense to switch horses in the middle of the race. Have you completely overlooked a blind spot, such as a political concern that could arise as an unexpected result of proceeding? This is crucial to ensure that the person or people feel heard as well as to advance the goals of the team. Sometimes all individuals need is a little affirmation before they fully accept your point of view.
It says a lot about you as a leader to be someone who always lets the perceived greatest idea win, regardless of the originating channel, if after studying and evaluating you see the necessity to align with the divergent position.
If, after investigation and assessment, you determine that you must adhere to the original strategy, we go to Step 2.
2. Disagree and Commit: Jeff Bezos, CEO of Amazon, has had this experience, and Julie Zhuo describes how he handles it in her book The Making of a Manager.
It's OK to disagree when the team is moving in the right direction, but it's not OK to accidentally or purposefully damage the team's efforts because you disagree. Let the team know your opinion, but then help them achieve company goals even if they disagree. Unknown. You could be wrong in today's ever-changing environment.
So next time you have a team member who seems to be dissenting and you've tried the previous tactics, you may ask the individual in the meeting I understand you but I don't want us to leave without you on board I need your permission to commit to this approach would you give us your commitment?

Alison Randel
3 years ago
Raising the Bar on Your 1:1s

Managers spend much time in 1:1s. Most team members meet with supervisors regularly. 1:1s can help create relationships and tackle tough topics. Few appreciate the 1:1 format's potential. Most of the time, that potential is spent on small talk, surface-level updates, and ranting (Ugh, the marketing team isn’t stepping up the way I want them to).
What if you used that time to have deeper conversations and important insights? What if change was easy?
This post introduces a new 1:1 format to help you dive deeper, faster, and develop genuine relationships without losing impact.
A 1:1 is a chat, you would assume. Why use structure to talk to a coworker? Go! I know how to talk to people. I can write. I've always written. Also, This article was edited by Zoe.
Before you discard something, ask yourself if there's a good reason not to try anything new. Is the 1:1 only a talk, or do you want extra benefits? Try the steps below to discover more.
I. Reflection (5 minutes)
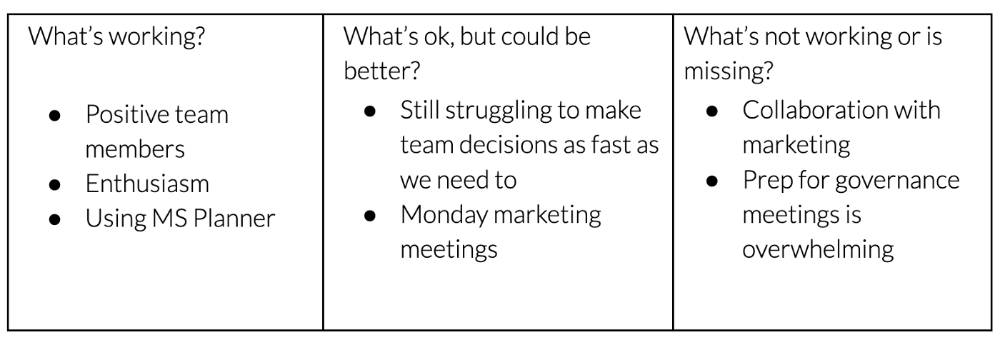
Context-free, broad comments waste time and are useless. Instead, give team members 5 minutes to write these 3 prompts.
What's effective?
What is decent but could be improved?
What is broken or missing?
Why these? They encourage people to be honest about all their experiences. Answering these questions helps people realize something isn't working. These prompts let people consider what's working.
Why take notes? Because you get more in less time. Will you feel awkward sitting quietly while your coworker writes? Probably. Persevere. Multi-task. Take a break from your afternoon meeting marathon. Any awkwardness will pay off.
What happens? After a few minutes of light conversation, create a template like the one given here and have team members fill in their replies. You can pre-share the template (with the caveat that this isn’t meant to take much prep time). Do this with your coworker: Answer the prompts. Everyone can benefit from pondering and obtaining guidance.
This step's output.
Part II: Talk (10-20 minutes)
Most individuals can explain what they see but not what's behind an answer. You don't like a meeting. Why not? Marketing partnership is difficult. What makes working with them difficult? I don't recommend slandering coworkers. Consider how your meetings, decisions, and priorities make work harder. The excellent stuff too. You want to know what's humming so you can reproduce the magic.
First, recognize some facts.
Real power dynamics exist. To encourage individuals to be honest, you must provide a safe environment and extend clear invites. Even then, it may take a few 1:1s for someone to feel secure enough to go there in person. It is part of your responsibility to admit that it is normal.
Curiosity and self-disclosure are crucial. Most leaders have received training to present themselves as the authorities. However, you will both benefit more from the dialogue if you can be open and honest about your personal experience, ask questions out of real curiosity, and acknowledge the pertinent sacrifices you're making as a leader.
Honesty without bias is difficult and important. Due to concern for the feelings of others, people frequently hold back. Or if they do point anything out, they do so in a critical manner. The key is to be open and unapologetic about what you observe while not presuming that your viewpoint is correct and that of the other person is incorrect.
Let's go into some prompts (based on genuine conversations):
“What do you notice across your answers?”
“What about the way you/we/they do X, Y, or Z is working well?”
“ Will you say more about item X in ‘What’s not working?’”
“I’m surprised there isn’t anything about Z. Why is that?”
“All of us tend to play some role in maintaining certain patterns. How might you/we be playing a role in this pattern persisting?”
“How might the way we meet, make decisions, or collaborate play a role in what’s currently happening?”
Consider the preceding example. What about the Monday meeting isn't working? Why? or What about the way we work with marketing makes collaboration harder? Remember to share your honest observations!
Third section: observe patterns (10-15 minutes)
Leaders desire to empower their people but don't know how. We also have many preconceptions about what empowerment means to us and how it works. The next phase in this 1:1 format will assist you and your team member comprehend team power and empowerment. This understanding can help you support and shift your team member's behavior, especially where you disagree.
How to? After discussing the stated responses, ask each team member what they can control, influence, and not control. Mark their replies. You can do the same, adding colors where you disagree.
This step's output.
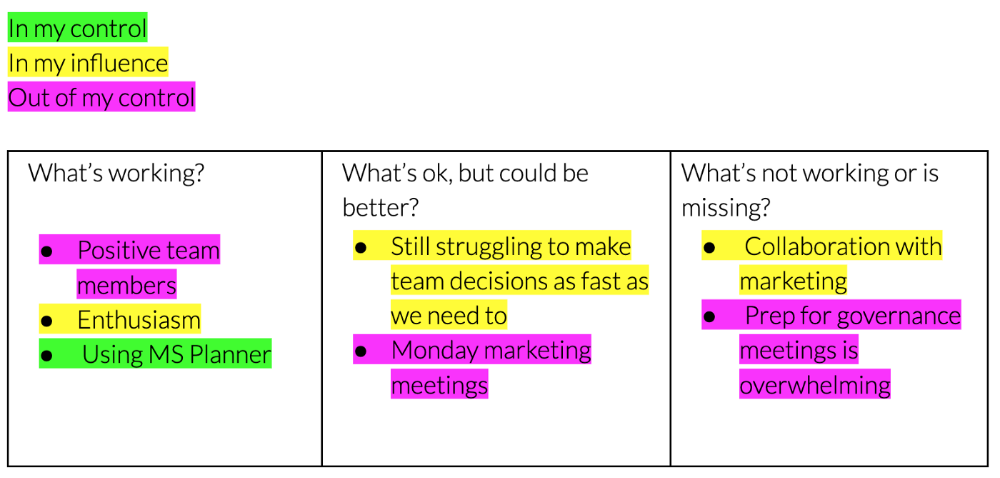
Next, consider the color constellation. Discuss these questions:
Is one color much more prevalent than the other? Why, if so?
Are the colors for the "what's working," "what's fine," and "what's not working" categories clearly distinct? Why, if so?
Do you have any disagreements? If yes, specifically where does your viewpoint differ? What activities do you object to? (Remember, there is no right or wrong in this. Give explicit details and ask questions with curiosity.)
Example: Based on the colors, you can ask, Is the marketing meeting's quality beyond your control? Were our marketing partners consulted? Are there any parts of team decisions we can control? We can't control people, but have we explored another decision-making method? How can we collaborate and generate governance-related information to reduce work, even if the requirement for prep can't be eliminated?
Consider the top one or two topics for this conversation. No 1:1 can cover everything, and that's OK. Focus on the present.
Part IV: Determine the next step (5 minutes)
Last, examine what this conversation means for you and your team member. It's easy to think we know the next moves when we don't.
Like what? You and your teammate answer these questions.
What does this signify moving ahead for me? What can I do to change this? Make requests, for instance, and see how people respond before thinking they won't be responsive.
What demands do I have on other people or my partners? What should I do first? E.g. Make a suggestion to marketing that we hold a monthly retrospective so we can address problems and exchange input more frequently. Include it on the meeting's agenda for next Monday.
Close the 1:1 by sharing what you noticed about the chat. Observations? Learn anything?
Yourself, you, and the 1:1
As a leader, you either reinforce or disrupt habits. Try this template if you desire greater ownership, empowerment, or creativity. Consider how you affect surrounding dynamics. How can you expect others to try something new in high-stakes scenarios, like meetings with cross-functional partners or senior stakeholders, if you won't? How can you expect deep thought and relationship if you don't encourage it in 1:1s? What pattern could this new format disrupt or reinforce?
Fight reluctance. First attempts won't be ideal, and that's OK. You'll only learn by trying.
You might also like

Sam Hickmann
3 years ago
What is this Fed interest rate everybody is talking about that makes or breaks the stock market?
The Federal Funds Rate (FFR) is the target interest rate set by the Federal Reserve System (Fed)'s policy-making body (FOMC). This target is the rate at which the Fed suggests commercial banks borrow and lend their excess reserves overnight to each other.
The FOMC meets 8 times a year to set the target FFR. This is supposed to promote economic growth. The overnight lending market sets the actual rate based on commercial banks' short-term reserves. If the market strays too far, the Fed intervenes.
Banks must keep a certain percentage of their deposits in a Federal Reserve account. A bank's reserve requirement is a percentage of its total deposits. End-of-day bank account balances averaged over two-week reserve maintenance periods are used to determine reserve requirements.
If a bank expects to have end-of-day balances above what's needed, it can lend the excess to another institution.
The FOMC adjusts interest rates based on economic indicators that show inflation, recession, or other issues that affect economic growth. Core inflation and durable goods orders are indicators.
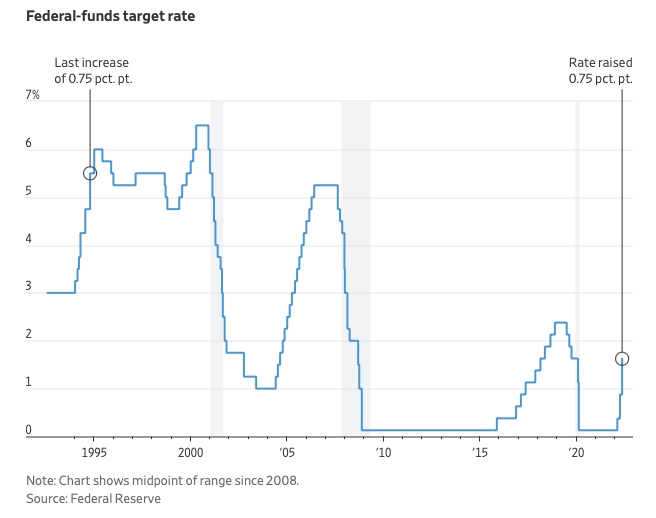
In response to economic conditions, the FFR target has changed over time. In the early 1980s, inflation pushed it to 20%. During the Great Recession of 2007-2009, the rate was slashed to 0.15 percent to encourage growth.
Inflation picked up in May 2022 despite earlier rate hikes, prompting today's 0.75 percent point increase. The largest increase since 1994. It might rise to around 3.375% this year and 3.1% by the end of 2024.

Alana Rister, Ph.D.
3 years ago
Don't rely on lessons you learned with a small audience.
My growth-killing mistake

When you initially start developing your audience, you need guidance.
What does my audience like? What do they not like? How can I grow more?
When I started writing two years ago, I inquired daily. Taking cues from your audience to develop more valuable content is a good concept, but it's simple to let them destroy your growth.
A small audience doesn't represent the full picture.
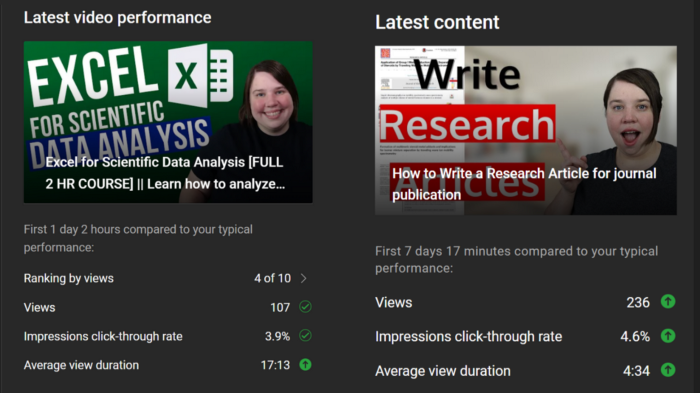
When I had fewer than 100 YouTube subscribers, I tried several video styles and topics. I looked to my audience for what to preserve and what to change.
If my views, click-through rate, or average view % dropped, that topic or style was awful. Avoiding that style helped me grow.
Vlogs, talking head videos on writing, and long-form tutorials didn't fare well.
Since I was small, I've limited the types of films I make. I have decided to make my own videos.
Surprisingly, the videos I avoided making meet or exceed my views, CTR, and audience retention.
A limited audience can't tell you what your tribe wants. Therefore, limiting your innovation will prohibit you from reaching the right audience. Finding them may take longer.
Large Creators Experience The Same Issue
In the last two years, I've heard Vanessa Lau and Cathrin Manning say they felt pigeonholed into generating videos they didn't want to do.
Why does this happen over and over again?
Once you have a popular piece of content, your audience will grow. So when you publish inconsistent material, fewer of your new audience will view it. You interpret the drop in views as a sign that your audience doesn't want the content, so you stop making it.
Repeat this procedure a few times, and you'll create stuff you're not passionate about because you're frightened to publish it.
How to Manage Your Creativity and Audience Development
I'm not recommending you generate random content.
Instead of feeling trapped by your audience, you can cultivate a diverse audience.
Create quality material on a range of topics and styles as you improve. Be creative until you get 100 followers. Look for comments on how to improve your article.
If you observe trends in the types of content that expand your audience, focus 50-75% of your material on those trends. Allow yourself to develop 25% non-performing material.
This method can help you expand your audience faster with your primary trends and like all your stuff. Slowly, people will find 25% of your material, which will boost its performance.
How to Expand Your Audience Without Having More Limited Content
Follow these techniques to build your audience without feeling confined.
Don't think that you need restrict yourself to what your limited audience prefers.
Don't let the poor performance of your desired material demotivate you.
You shouldn't restrict the type of content you publish or the themes you cover when you have less than 100 followers.
When your audience expands, save 25% of your content for your personal interests, regardless of how well it does.

1eth1da
3 years ago
6 Rules to build a successful NFT Community in 2022

Too much NFT, Discord, and shitposting.
How do you choose?
How do you recruit more members to join your NFT project?
In 2021, a successful NFT project required:
Monkey/ape artwork
Twitter and Discord bot-filled
Roadmap overpromise
Goal was quick cash.
2022 and the years after will change that.
These are 6 Rules for a Strong NFT Community in 2022:
THINK LONG TERM
This relates to roadmap planning. Hype and dumb luck may drive NFT projects (ahem, goblins) but rarely will your project soar.
Instead, consider sustainability.
Plan your roadmap based on your team's abilities.
Do what you're already doing, but with NFTs, make it bigger and better.
You shouldn't copy a project's roadmap just because it was profitable.
This will lead to over-promising, team burnout, and an RUG NFT project.
OFFER VALUE
Building a great community starts with giving.
Why are musicians popular?
Because they offer entertainment for everyone, a random person becomes a fan, and more fans become a cult.
That's how you should approach your community.
TEAM UP
A great team helps.
An NFT project could have 3 or 2 people.
Credibility trumps team size.
Make sure your team can answer community questions, resolve issues, and constantly attend to them.
Don't overwork and burn out.
Your community will be able to recognize that you are trying too hard and give up on the project.
BUILD A GREAT PRODUCT
Bored Ape Yacht Club altered the NFT space.
Cryptopunks transformed NFTs.
Many others did, including Okay Bears.
What made them that way?
Because they answered a key question.
What is my NFT supposed to be?
Before planning art, this question must be answered.
NFTs can't be just jpegs.
What does it represent?
Is it a Metaverse-ready project?
What blockchain are you going to be using and why?
Set some ground rules for yourself. This helps your project's direction.
These questions will help you and your team set a direction for blockchain, NFT, and Web3 technology.
EDUCATE ON WEB3
The more the team learns about Web3 technology, the more they can offer their community.
Think tokens, metaverse, cross-chain interoperability and more.
BUILD A GREAT COMMUNITY
Several projects mistreat their communities.
They treat their community like "customers" and try to sell them NFT.
Providing Whitelists and giveaways aren't your only community-building options.
Think bigger.
Consider them family and friends, not wallets.
Consider them fans.
These are some tips to start your NFT project.