


What The Hell Is A Crypto Punk?
We are Crypto Punks, and we are changing your world.
A “Crypto Punk” is a new generation of entrepreneurs who value individual liberty and collective value creation and co-creation through decentralization. While many Crypto Punks were born and raised in a digital world, some of the early pioneers in the crypto space are from the Oregon Trail generation. They were born to an analog world, but grew up simultaneously alongside the birth of home computing, the Internet, and mobile computing.
A Crypto Punk’s world view is not the same as previous generations. By the time most Crypto Punks were born everything from fiat currency, the stock market, pharmaceuticals, the Internet, to advanced operating systems and microprocessing were already present or emerging. Crypto Punks were born into pre-existing conditions and systems of control, not governed by logic or reason but by greed, corporatism, subversion, bureaucracy, censorship, and inefficiency.
All Systems Are Human Made
Crypto Punks understand that all systems were created by people and that previous generations did not have access to information technologies that we have today. This is why Crypto Punks have different values than their parents, and value liberty, decentralization, equality, social justice, and freedom over wealth, money, and power. They understand that the only path forward is to work together to build new and better systems that make the old world order obsolete.
Unlike the original cypher punks and cyber punks, Crypto Punks are a new iteration or evolution of these previous cultures influenced by cryptography, blockchain technology, crypto economics, libertarianism, holographics, democratic socialism, and artificial intelligence. They are tasked with not only undoing the mistakes of previous generations, but also innovating and creating new ways of solving complex problems with advanced technology and solutions.
Where Crypto Punks truly differ is in their understanding that computer systems can exist for more than just engagement and entertainment, but actually improve the human condition by automating bureaucracy and inefficiency by creating more efficient economic incentives and systems.
Crypto Punks Value Transparency and Do Not Trust Flawed, Unequal, and Corrupt Systems
Crypto Punks have a strong distrust for inherently flawed and corrupt systems. This why Crypto Punks value transparency, free speech, privacy, and decentralization. As well as arguably computer systems over human powered systems.
Crypto Punks are the children of the Great Recession, and will never forget the economic corruption that still enslaves younger generations.
Crypto Punks were born to think different, and raised by computers to view reality through an LED looking glass. They will not surrender to the flawed systems of economic wage slavery, inequality, censorship, and subjection. They will literally engineer their own unstoppable financial systems and trade in cryptography over fiat currency merely to prove that belief systems are more powerful than corruption.
Crypto Punks are here to help achieve freedom from world governments, corporations and bankers who monetizine our data to control our lives.
Crypto Punks Decentralize
Despite all the evils of the world today, Crypto Punks know they have the power to create change. This is why Crypto Punks are optimistic about the future despite all the indicators that humanity is destined for failure.
Crypto Punks believe in systems that prioritize people and the planet above profit. Even so, Crypto Punks still believe in capitalistic systems, but only capitalistic systems that incentivize good behaviors that do not violate the common good for the sake of profit.
Cyber Punks Are Co-Creators
We are Crypto Punks, and we will build a better world for all of us. For the true price of creation is not in US dollars, but through working together as equals to replace the unequal and corrupt greedy systems of previous generations.
Where they have failed, Crypto Punks will succeed. Not because we want to, but because we have to. The world we were born into is so corrupt and its systems so flawed and unequal we were never given a choice.
We have to be the change we seek.
We are Crypto Punks.
Either help us, or get out of our way.
Are you a Crypto Punk?
More on Web3 & Crypto

ANDREW SINGER
3 years ago
Crypto seen as the ‘future of money’ in inflation-mired countries
Crypto as the ‘future of money' in inflation-stricken nations
Citizens of devalued currencies “need” crypto. “Nice to have” in the developed world.
According to Gemini's 2022 Global State of Crypto report, cryptocurrencies “evolved from what many considered a niche investment into an established asset class” last year.
More than half of crypto owners in Brazil (51%), Hong Kong (51%), and India (54%), according to the report, bought cryptocurrency for the first time in 2021.
The study found that inflation and currency devaluation are powerful drivers of crypto adoption, especially in emerging market (EM) countries:
“Respondents in countries that have seen a 50% or greater devaluation of their currency against the USD over the last decade were more than 5 times as likely to plan to purchase crypto in the coming year.”
Between 2011 and 2021, the real lost 218 percent of its value against the dollar, and 45 percent of Brazilians surveyed by Gemini said they planned to buy crypto in 2019.
The rand (South Africa's currency) has fallen 103 percent in value over the last decade, second only to the Brazilian real, and 32 percent of South Africans expect to own crypto in the coming year. Mexico and India, the third and fourth highest devaluation countries, followed suit.
Compared to the US dollar, Hong Kong and the UK currencies have not devalued in the last decade. Meanwhile, only 5% and 8% of those surveyed in those countries expressed interest in buying crypto.
What can be concluded? Noah Perlman, COO of Gemini, sees various crypto use cases depending on one's location.
‘Need to have' investment in countries where the local currency has devalued against the dollar, whereas in the developed world it is still seen as a ‘nice to have'.
Crypto as money substitute
As an adjunct professor at New York University School of Law, Winston Ma distinguishes between an asset used as an inflation hedge and one used as a currency replacement.
Unlike gold, he believes Bitcoin (BTC) is not a “inflation hedge”. They acted more like growth stocks in 2022. “Bitcoin correlated more closely with the S&P 500 index — and Ether with the NASDAQ — than gold,” he told Cointelegraph. But in the developing world, things are different:
“Inflation may be a primary driver of cryptocurrency adoption in emerging markets like Brazil, India, and Mexico.”
According to Justin d'Anethan, institutional sales director at the Amber Group, a Singapore-based digital asset firm, early adoption was driven by countries where currency stability and/or access to proper banking services were issues. Simply put, he said, developing countries want alternatives to easily debased fiat currencies.
“The larger flows may still come from institutions and developed countries, but the actual users may come from places like Lebanon, Turkey, Venezuela, and Indonesia.”
“Inflation is one of the factors that has and continues to drive adoption of Bitcoin and other crypto assets globally,” said Sean Stein Smith, assistant professor of economics and business at Lehman College.
But it's only one factor, and different regions have different factors, says Stein Smith. As a “instantaneously accessible, traceable, and cost-effective transaction option,” investors and entrepreneurs increasingly recognize the benefits of crypto assets. Other places promote crypto adoption due to “potential capital gains and returns”.
According to the report, “legal uncertainty around cryptocurrency,” tax questions, and a general education deficit could hinder adoption in Asia Pacific and Latin America. In Africa, 56% of respondents said more educational resources were needed to explain cryptocurrencies.
Not only inflation, but empowering our youth to live better than their parents without fear of failure or allegiance to legacy financial markets or products, said Monica Singer, ConsenSys South Africa lead. Also, “the issue of cash and remittances is huge in Africa, as is the issue of social grants.”
Money's future?
The survey found that Brazil and Indonesia had the most cryptocurrency ownership. In each country, 41% of those polled said they owned crypto. Only 20% of Americans surveyed said they owned cryptocurrency.
These markets are more likely to see cryptocurrencies as the future of money. The survey found:
“The majority of respondents in Latin America (59%) and Africa (58%) say crypto is the future of money.”
Brazil (66%), Nigeria (63%), Indonesia (61%), and South Africa (57%). Europe and Australia had the fewest believers, with Denmark at 12%, Norway at 15%, and Australia at 17%.
Will the Ukraine conflict impact adoption?
The poll was taken before the war. Will the devastating conflict slow global crypto adoption growth?
With over $100 million in crypto donations directly requested by the Ukrainian government since the war began, Stein Smith says the war has certainly brought crypto into the mainstream conversation.
“This real-world demonstration of decentralized money's power could spur wider adoption, policy debate, and increased use of crypto as a medium of exchange.”
But the war may not affect all developing nations. “The Ukraine war has no impact on African demand for crypto,” Others loom larger. “Yes, inflation, but also a lack of trust in government in many African countries, and a young demographic very familiar with mobile phones and the internet.”
A major success story like Mpesa in Kenya has influenced the continent and may help accelerate crypto adoption. Creating a plan when everyone you trust fails you is directly related to the African spirit, she said.
On the other hand, Ma views the Ukraine conflict as a sort of crisis check for cryptocurrencies. For those in emerging markets, the Ukraine-Russia war has served as a “stress test” for the cryptocurrency payment rail, he told Cointelegraph.
“These emerging markets may see the greatest future gains in crypto adoption.”
Inflation and currency devaluation are persistent global concerns. In such places, Bitcoin and other cryptocurrencies are now seen as the “future of money.” Not in the developed world, but that could change with better regulation and education. Inflation and its impact on cash holdings are waking up even Western nations.
Read original post here.

Max Parasol
4 years ago
What the hell is Web3 anyway?
"Web 3.0" is a trendy buzzword with a vague definition. Everyone agrees it has to do with a blockchain-based internet evolution, but what is it?
Yet, the meaning and prospects for Web3 have become hot topics in crypto communities. Big corporations use the term to gain a foothold in the space while avoiding the negative connotations of “crypto.”
But it can't be evaluated without a definition.
Among those criticizing Web3's vagueness is Cobie:
“Despite the dominie's deluge of undistinguished think pieces, nobody really agrees on what Web3 is. Web3 is a scam, the future, tokenizing the world, VC exit liquidity, or just another name for crypto, depending on your tribe.
“Even the crypto community is split on whether Bitcoin is Web3,” he adds.
The phrase was coined by an early crypto thinker, and the community has had years to figure out what it means. Many ideologies and commercial realities have driven reverse engineering.
Web3 is becoming clearer as a concept. It contains ideas. It was probably coined by Ethereum co-founder Gavin Wood in 2014. His definition of Web3 included “trustless transactions” as part of its tech stack. Wood founded the Web3 Foundation and the Polkadot network, a Web3 alternative future.
The 2013 Ethereum white paper had previously allowed devotees to imagine a DAO, for example.
Web3 now has concepts like decentralized autonomous organizations, sovereign digital identity, censorship-free data storage, and data divided by multiple servers. They intertwine discussions about the “Web3” movement and its viability.
These ideas are linked by Cobie's initial Web3 definition. A key component of Web3 should be “ownership of value” for one's own content and data.
Noting that “late-stage capitalism greedcorps that make you buy a fractionalized micropayment NFT on Cardano to operate your electric toothbrush” may build the new web, he notes that “crypto founders are too rich to care anymore.”
Very Important
Many critics of Web3 claim it isn't practical or achievable. Web3 critics like Moxie Marlinspike (creator of sslstrip and Signal/TextSecure) can never see people running their own servers. Early in January, he argued that protocols are more difficult to create than platforms.
While this is true, some projects, like the file storage protocol IPFS, allow users to choose which jurisdictions their data is shared between.
But full decentralization is a difficult problem. Suhaza, replying to Moxie, said:
”People don't want to run servers... Companies are now offering API access to an Ethereum node as a service... Almost all DApps interact with the blockchain using Infura or Alchemy. In fact, when a DApp uses a wallet like MetaMask to interact with the blockchain, MetaMask is just calling Infura!
So, here are the questions: Web3: Is it a go? Is it truly decentralized?
Web3 history is shaped by Web2 failure.
This is the story of how the Internet was turned upside down...
Then came the vision. Everyone can create content for free. Decentralized open-source believers like Tim Berners-Lee popularized it.
Real-world data trade-offs for content creation and pricing.
A giant Wikipedia page married to a giant Craig's List. No ads, no logins, and a private web carve-up. For free usage, you give up your privacy and data to the algorithmic targeted advertising of Web 2.
Our data is centralized and savaged by giant corporations. Data localization rules and geopolitical walls like China's Great Firewall further fragment the internet.
The decentralized Web3 reflects Berners-original Lee's vision: "No permission is required from a central authority to post anything... there is no central controlling node and thus no single point of failure." Now he runs Solid, a Web3 data storage startup.
So Web3 starts with decentralized servers and data privacy.
Web3 begins with decentralized storage.
Data decentralization is a key feature of the Web3 tech stack. Web2 has closed databases. Large corporations like Facebook, Google, and others go to great lengths to collect, control, and monetize data. We want to change it.
Amazon, Google, Microsoft, Alibaba, and Huawei, according to Gartner, currently control 80% of the global cloud infrastructure market. Web3 wants to change that.
Decentralization enlarges power structures by giving participants a stake in the network. Users own data on open encrypted networks in Web3. This area has many projects.
Apps like Filecoin and IPFS have led the way. Data is replicated across multiple nodes in Web3 storage providers like Filecoin.
But the new tech stack and ideology raise many questions.
Giving users control over their data
According to Ryan Kris, COO of Verida, his “Web3 vision” is “empowering people to control their own data.”
Verida targets SDKs that address issues in the Web3 stack: identity, messaging, personal storage, and data interoperability.
A big app suite? “Yes, but it's a frontier technology,” he says. They are currently building a credentialing system for decentralized health in Bermuda.
By empowering individuals, how will Web3 create a fairer internet? Kris, who has worked in telecoms, finance, cyber security, and blockchain consulting for decades, admits it is difficult:
“The viability of Web3 raises some good business questions,” he adds. “How can users regain control over centralized personal data? How are startups motivated to build products and tools that support this transition? How are existing Web2 companies encouraged to pivot to a Web3 business model to compete with market leaders?
Kris adds that new technologies have regulatory and practical issues:
"On storage, IPFS is great for redundantly sharing public data, but not designed for securing private personal data. It is not controlled by the users. When data storage in a specific country is not guaranteed, regulatory issues arise."
Each project has varying degrees of decentralization. The diehards say DApps that use centralized storage are no longer “Web3” companies. But fully decentralized technology is hard to build.
Web2.5?
Some argue that we're actually building Web2.5 businesses, which are crypto-native but not fully decentralized. This is vital. For example, the NFT may be on a blockchain, but it is linked to centralized data repositories like OpenSea. A server failure could result in data loss.
However, according to Apollo Capital crypto analyst David Angliss, OpenSea is “not exactly community-led”. Also in 2021, much to the chagrin of crypto enthusiasts, OpenSea tried and failed to list on the Nasdaq.
This is where Web2.5 is defined.
“Web3 isn't a crypto segment. “Anything that uses a blockchain for censorship resistance is Web3,” Angliss tells us.
“Web3 gives users control over their data and identity. This is not possible in Web2.”
“Web2 is like feudalism, with walled-off ecosystems ruled by a few. For example, an honest user owned the Instagram account “Meta,” which Facebook rebranded and then had to make up a reason to suspend. Not anymore with Web3. If I buy ‘Ethereum.ens,' Ethereum cannot take it away from me.”
Angliss uses OpenSea as a Web2.5 business example. Too decentralized, i.e. censorship resistant, can be unprofitable for a large company like OpenSea. For example, OpenSea “enables NFT trading”. But it also stopped the sale of stolen Bored Apes.”
Web3 (or Web2.5, depending on the context) has been described as a new way to privatize internet.
“Being in the crypto ecosystem doesn't make it Web3,” Angliss says. The biggest risk is centralized closed ecosystems rather than a growing Web3.
LooksRare and OpenDAO are two community-led platforms that are more decentralized than OpenSea. LooksRare has even been “vampire attacking” OpenSea, indicating a Web3 competitor to the Web2.5 NFT king could find favor.
The addition of a token gives these new NFT platforms more options for building customer loyalty. For example, OpenSea charges a fee that goes nowhere. Stakeholders of LOOKS tokens earn 100% of the trading fees charged by LooksRare on every basic sale.
Maybe Web3's time has come.
So whose data is it?
Continuing criticisms of Web3 platforms' decentralization may indicate we're too early. Users want to own and store their in-game assets and NFTs on decentralized platforms like the Metaverse and play-to-earn games. Start-ups like Arweave, Sia, and Aleph.im propose an alternative.
To be truly decentralized, Web3 requires new off-chain models that sidestep cloud computing and Web2.5.
“Arweave and Sia emerged as formidable competitors this year,” says the Messari Report. They seek to reduce the risk of an NFT being lost due to a data breach on a centralized server.
Aleph.im, another Web3 cloud competitor, seeks to replace cloud computing with a service network. It is a decentralized computing network that supports multiple blockchains by retrieving and encrypting data.
“The Aleph.im network provides a truly decentralized alternative where it is most needed: storage and computing,” says Johnathan Schemoul, founder of Aleph.im. For reasons of consensus and security, blockchains are not designed for large storage or high-performance computing.
As a result, large data sets are frequently stored off-chain, increasing the risk for centralized databases like OpenSea
Aleph.im enables users to own digital assets using both blockchains and off-chain decentralized cloud technologies.
"We need to go beyond layer 0 and 1 to build a robust decentralized web. The Aleph.im ecosystem is proving that Web3 can be decentralized, and we intend to keep going.”
Aleph.im raised $10 million in mid-January 2022, and Ubisoft uses its network for NFT storage. This is the first time a big-budget gaming studio has given users this much control.
It also suggests Web3 could work as a B2B model, even if consumers aren't concerned about “decentralization.” Starting with gaming is common.
Can Tokenomics help Web3 adoption?
Web3 consumer adoption is another story. The average user may not be interested in all this decentralization talk. Still, how much do people value privacy over convenience? Can tokenomics solve the privacy vs. convenience dilemma?
Holon Global Investments' Jonathan Hooker tells us that human internet behavior will change. “Do you own Bitcoin?” he asks in his Web3 explanation. How does it feel to own and control your own sovereign wealth? Then:
“What if you could own and control your data like Bitcoin?”
“The business model must find what that person values,” he says. Putting their own health records on centralized systems they don't control?
“How vital are those medical records to that person at a critical time anywhere in the world? Filecoin and IPFS can help.”
Web3 adoption depends on NFT storage competition. A free off-chain storage of NFT metadata and assets was launched by Filecoin in April 2021.
Denationalization and blockchain technology have significant implications for data ownership and compensation for lending, staking, and using data.
Tokenomics can change human behavior, but many people simply sign into Web2 apps using a Facebook API without hesitation. Our data is already owned by Google, Baidu, Tencent, and Facebook (and its parent company Meta). Is it too late to recover?
Maybe. “Data is like fruit, it starts out fresh but ages,” he says. "Big Tech's data on us will expire."
Web3 founder Kris agrees with Hooker that “value for data is the issue, not privacy.” People accept losing their data privacy, so tokenize it. People readily give up data, so why not pay for it?
"Personalized data offering is valuable in personalization. “I will sell my social media data but not my health data.”
Purists and mass consumer adoption struggle with key management.
Others question data tokenomics' optimism. While acknowledging its potential, Box founder Aaron Levie questioned the viability of Web3 models in a Tweet thread:
“Why? Because data almost always works in an app. A product and APIs that moved quickly to build value and trust over time.”
Levie contends that tokenomics may complicate matters. In addition to community governance and tokenomics, Web3 ideals likely add a new negotiation vector.
“These are hard problems about human coordination, not software or blockchains,”. Using a Facebook API is simple. The business model and user interface are crucial.
For example, the crypto faithful have a common misconception about logging into Web3. It goes like this: Web 1 had usernames and passwords. Web 2 uses Google, Facebook, or Twitter APIs, while Web 3 uses your wallet. Pay with Ethereum on MetaMask, for example.
But Levie is correct. Blockchain key management is stressed in this meme. Even seasoned crypto enthusiasts have heart attacks, let alone newbies.
Web3 requires a better user experience, according to Kris, the company's founder. “How does a user recover keys?”
And at this point, no solution is likely to be completely decentralized. So Web3 key management can be improved. ”The moment someone loses control of their keys, Web3 ceases to exist.”
That leaves a major issue for Web3 purists. Put this one in the too-hard basket.
Is 2022 the Year of Web3?
Web3 must first solve a number of issues before it can be mainstreamed. It must be better and cheaper than Web2.5, or have other significant advantages.
Web3 aims for scalability without sacrificing decentralization protocols. But decentralization is difficult and centralized services are more convenient.
Ethereum co-founder Vitalik Buterin himself stated recently"
This is why (centralized) Binance to Binance transactions trump Ethereum payments in some places because they don't have to be verified 12 times."
“I do think a lot of people care about decentralization, but they're not going to take decentralization if decentralization costs $8 per transaction,” he continued.
“Blockchains need to be affordable for people to use them in mainstream applications... Not for 2014 whales, but for today's users."
For now, scalability, tokenomics, mainstream adoption, and decentralization believers seem to be holding Web3 hostage.
Much like crypto's past.
But stay tuned.

Vitalik
4 years ago
An approximate introduction to how zk-SNARKs are possible (part 1)
You can make a proof for the statement "I know a secret number such that if you take the word ‘cow', add the number to the end, and SHA256 hash it 100 million times, the output starts with 0x57d00485aa". The verifier can verify the proof far more quickly than it would take for them to run 100 million hashes themselves, and the proof would also not reveal what the secret number is.
In the context of blockchains, this has 2 very powerful applications: Perhaps the most powerful cryptographic technology to come out of the last decade is general-purpose succinct zero knowledge proofs, usually called zk-SNARKs ("zero knowledge succinct arguments of knowledge"). A zk-SNARK allows you to generate a proof that some computation has some particular output, in such a way that the proof can be verified extremely quickly even if the underlying computation takes a very long time to run. The "ZK" part adds an additional feature: the proof can keep some of the inputs to the computation hidden.
You can make a proof for the statement "I know a secret number such that if you take the word ‘cow', add the number to the end, and SHA256 hash it 100 million times, the output starts with 0x57d00485aa". The verifier can verify the proof far more quickly than it would take for them to run 100 million hashes themselves, and the proof would also not reveal what the secret number is.
In the context of blockchains, this has two very powerful applications:
- Scalability: if a block takes a long time to verify, one person can verify it and generate a proof, and everyone else can just quickly verify the proof instead
- Privacy: you can prove that you have the right to transfer some asset (you received it, and you didn't already transfer it) without revealing the link to which asset you received. This ensures security without unduly leaking information about who is transacting with whom to the public.
But zk-SNARKs are quite complex; indeed, as recently as in 2014-17 they were still frequently called "moon math". The good news is that since then, the protocols have become simpler and our understanding of them has become much better. This post will try to explain how ZK-SNARKs work, in a way that should be understandable to someone with a medium level of understanding of mathematics.
Why ZK-SNARKs "should" be hard
Let us take the example that we started with: we have a number (we can encode "cow" followed by the secret input as an integer), we take the SHA256 hash of that number, then we do that again another 99,999,999 times, we get the output, and we check what its starting digits are. This is a huge computation.
A "succinct" proof is one where both the size of the proof and the time required to verify it grow much more slowly than the computation to be verified. If we want a "succinct" proof, we cannot require the verifier to do some work per round of hashing (because then the verification time would be proportional to the computation). Instead, the verifier must somehow check the whole computation without peeking into each individual piece of the computation.
One natural technique is random sampling: how about we just have the verifier peek into the computation in 500 different places, check that those parts are correct, and if all 500 checks pass then assume that the rest of the computation must with high probability be fine, too?
Such a procedure could even be turned into a non-interactive proof using the Fiat-Shamir heuristic: the prover computes a Merkle root of the computation, uses the Merkle root to pseudorandomly choose 500 indices, and provides the 500 corresponding Merkle branches of the data. The key idea is that the prover does not know which branches they will need to reveal until they have already "committed to" the data. If a malicious prover tries to fudge the data after learning which indices are going to be checked, that would change the Merkle root, which would result in a new set of random indices, which would require fudging the data again... trapping the malicious prover in an endless cycle.
But unfortunately there is a fatal flaw in naively applying random sampling to spot-check a computation in this way: computation is inherently fragile. If a malicious prover flips one bit somewhere in the middle of a computation, they can make it give a completely different result, and a random sampling verifier would almost never find out.
It only takes one deliberately inserted error, that a random check would almost never catch, to make a computation give a completely incorrect result.
If tasked with the problem of coming up with a zk-SNARK protocol, many people would make their way to this point and then get stuck and give up. How can a verifier possibly check every single piece of the computation, without looking at each piece of the computation individually? There is a clever solution.
see part 2
You might also like
Dmytro Spilka
3 years ago
Why NFTs Have a Bright Future Away from Collectible Art After Punks and Apes

After a crazy second half of 2021 and significant trade volumes into 2022, the market for NFT artworks like Bored Ape Yacht Club, CryptoPunks, and Pudgy Penguins has begun a sharp collapse as market downturns hit token values.
DappRadar data shows NFT monthly sales have fallen below $1 billion since June 2021. OpenSea, the world's largest NFT exchange, has seen sales volume decline 75% since May and is trading like July 2021.
Prices of popular non-fungible tokens have also decreased. Bored Ape Yacht Club (BAYC) has witnessed volume and sales drop 63% and 15%, respectively, in the past month.
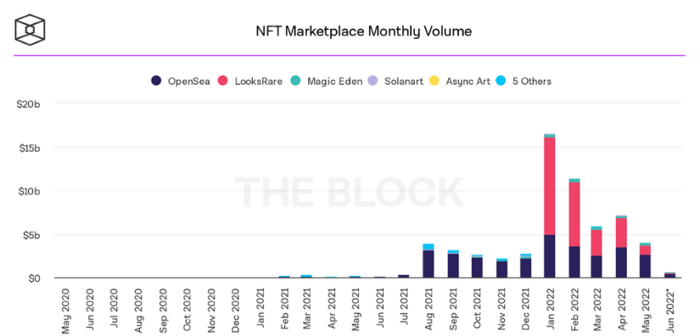
BeInCrypto analysis shows market decline. May 2022 cryptocurrency marketplace volume was $4 billion, according to a news platform. This is a sharp drop from April's $7.18 billion.
OpenSea, a big marketplace, contributed $2.6 billion, while LooksRare, Magic Eden, and Solanart also contributed.
NFT markets are digital platforms for buying and selling tokens, similar stock trading platforms. Although some of the world's largest exchanges offer NFT wallets, most users store their NFTs on their favorite marketplaces.
In January 2022, overall NFT sales volume was $16.57 billion, with LooksRare contributing $11.1 billion. May 2022's volume was $12.57 less than January, a 75% drop, and June's is expected to be considerably smaller.
A World Based on Utility
Despite declines in NFT trading volumes, not all investors are negative on NFTs. Although there are uncertainties about the sustainability of NFT-based art collections, there are fewer reservations about utility-based tokens and their significance in technology's future.
In June, business CEO Christof Straub said NFTs may help artists monetize unreleased content, resuscitate catalogs, establish deeper fan connections, and make processes more efficient through technology.
We all know NFTs can't be JPEGs. Straub noted that NFT music rights can offer more equitable rewards to musicians.
Music NFTs are here to stay if they have real value, solve real problems, are trusted and lawful, and have fair and sustainable business models.
NFTs can transform numerous industries, including music. Market opinion is shifting towards tokens with more utility than the social media artworks we're used to seeing.
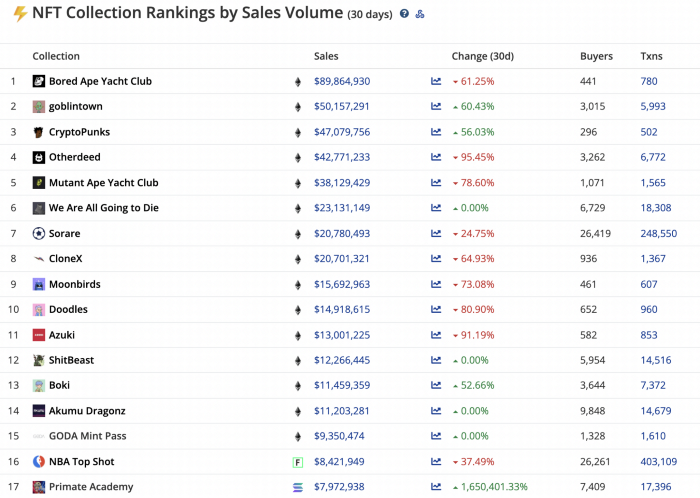
While the major NFT names remain dominant in terms of volume, new utility-based initiatives are emerging as top 20 collections.
Otherdeed, Sorare, and NBA Top Shot are NFT-based games that rank above Bored Ape Yacht Club and Cryptopunks.
Users can switch video NFTs of basketball players in NBA Top Shot. Similar efforts are emerging in the non-fungible landscape.
Sorare shows how NFTs can support a new way of playing fantasy football, where participants buy and swap trading cards to create a 5-player team that wins rewards based on real-life performances.
Sorare raised 579.7 million in one of Europe's largest Series B financing deals in September 2021. Recently, the platform revealed plans to expand into Major League Baseball.
Strong growth indications suggest a promising future for NFTs. The value of art-based collections like BAYC and CryptoPunks may be questioned as markets become diluted by new limited collections, but the potential for NFTs to become intrinsically linked to tangible utility like online gaming, music and art, and even corporate reward schemes shows the industry has a bright future.

Shawn Mordecai
3 years ago
The Apple iPhone 14 Pill is Easier to Swallow
Is iPhone's Dynamic Island invention or a marketing ploy?
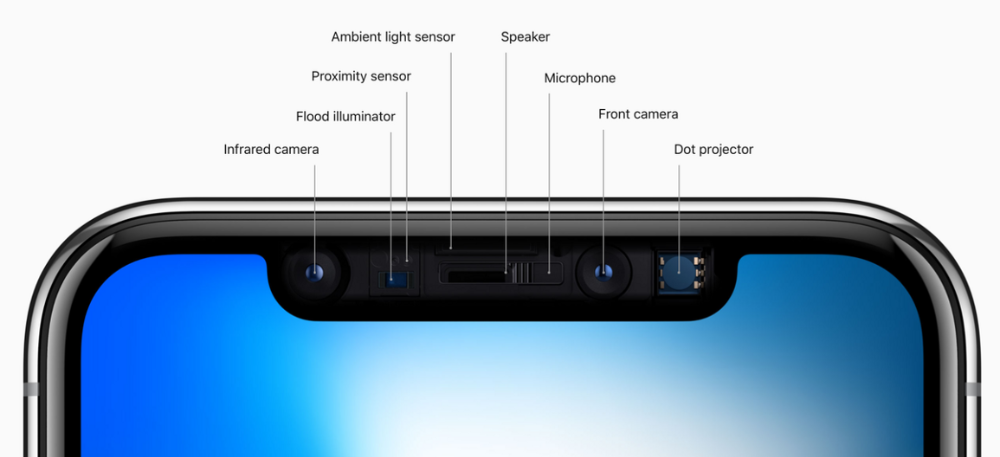
First of all, why the notch?
When Apple debuted the iPhone X with the notch, some were surprised, confused, and amused by the goof. Let the Brits keep the new meaning of top-notch.
Apple removed the bottom home button to enhance screen space. The tides couldn't overtake part of the top. This section contained sensors, a speaker, a microphone, and cameras for facial recognition. A town resisted Apple's new iPhone design.
From iPhone X to 13, the notch has gotten smaller. We expected this as technology and engineering progressed, but we hated the notch. Apple approved. They attached it to their other gadgets.
Apple accepted, owned, and ran with the iPhone notch, it has become iconic (or infamous); and that’s intentional.
The Island Where Apple Is
Apple needs to separate itself, but they know how to do it well. The iPhone 14 Pro finally has us oohing and aahing. Life-changing, not just higher pixel density or longer battery.
Dynamic Island turned a visual differentiation into great usefulness, which may not be life-changing. Apple always welcomes the controversy, whether it's $700 for iMac wheels, no charging block with a new phone, or removing the headphone jack.
Apple knows its customers will be loyal, even if they're irritated. Their odd design choices often cause controversy. It's calculated that people blog, review, and criticize Apple's products. We accept what works for them.
While the competition zigs, Apple zags. Sometimes they zag too hard and smash into a wall, but we talk about it anyways, and that’s great publicity for them.
Getting Dependent on the drug
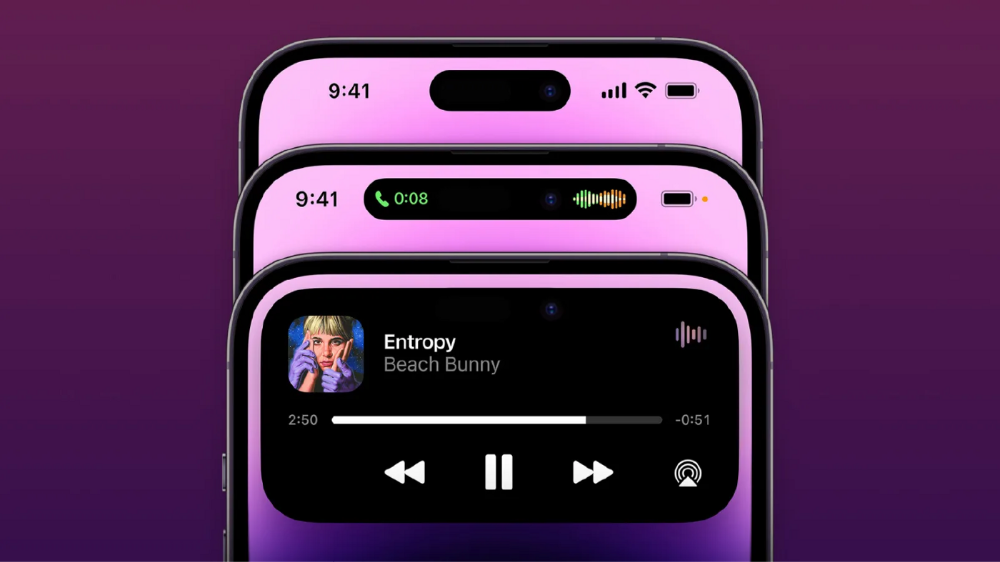
The notch became a crop. Dynamic Island's design is helpful, intuitive, elegant, and useful. It increases iPhone usability, productivity (slightly), and joy. No longer unsightly.
The medication helps with multitasking. It's a compact version of the iPhone's Live Activities lock screen function. Dynamic Island enhances apps and activities with visual effects and animations whether you engage with it or not. As you use the pill, its usefulness lessens. It lowers user notifications and consolidates them with live and permanent feeds, delivering quick app statuses. It uses the black pixels on the iPhone 14's display, which looked like a poor haircut.

The pill may be a gimmick to entice customers to use more Apple products and services. Apps may promote to their users like a live billboard.
Be prepared to get a huge dose of Dynamic Island’s “pill” like you never had before with the notch. It might become so satisfying and addicting to use, that every interaction with it will become habit-forming, and you’re going to forget that it ever existed.
WARNING: A Few Potential Side Effects
Vision blurred Dynamic Island's proximity to the front-facing camera may leave behind grease that blurs photos. Before taking a selfie, wipe the camera clean.
Strained thumb To fully use Dynamic Island, extend your thumb's reach 6.7 inches beyond your typical, comfortable range.
Happiness, contentment The Dynamic Island may enhance Endorphins and Dopamine. Multitasking, interactions, animations, and haptic feedback make you want to use this function again and again.
Motion-sickness Dynamic Island's motions and effects may make some people dizzy. If you can disable animations, you can avoid motion sickness.
I'm not a doctor, therefore they aren't established adverse effects.
Does Dynamic Island Include Multiple Tasks?
Dynamic Islands is a placebo for multitasking. Apple might have compromised on iPhone multitasking. It won't make you super productive, but it's a step up.

iPhone is primarily for personal use, like watching videos, messaging friends, sending money to friends, calling friends about the money you were supposed to send them, taking 50 photos of the same leaf, investing in crypto, driving for Uber because you lost all your money investing in crypto, listening to music and hailing an Uber from a deserted crop field because while you were driving for Uber your passenger stole your car and left you stranded, so you used Apple’s new SOS satellite feature to message your friend, who still didn’t receive their money, to hail you an Uber; now you owe them more money… karma?
We won't be watching videos on iPhones while perusing 10,000-row spreadsheets anytime soon. True multitasking and productivity aren't priorities for Apple's iPhone. Apple doesn't to preserve the iPhone's experience. Like why there's no iPad calculator. Apple doesn't want iPad users to do math, but isn't essential for productivity?
Digressing.
Apple will block certain functions so you must buy and use their gadgets and services, immersing yourself in their ecosystem and dictating how to use their goods.
Dynamic Island is a poor man’s multi-task for iPhone, and that’s fine it works for most iPhone users. For substantial productivity Apple prefers you to get an iPad or a MacBook. That’s part of the reason for restrictive features on certain Apple devices, but sometimes it’s based on principles to preserve the integrity of the product, according to Apple’s definition.
Is Apple using deception?
Dynamic Island may be distracting you from a design decision. The answer is kind of. Elegant distraction
When you pull down a smartphone webpage to refresh it or minimize an app, you get seamless animations. It's not simply because it appears better; it's due to iPhone and smartphone processing speeds. Such limits reduce the system's response to your activity, slowing the experience. Designers and developers use animations and effects to distract us from the time lag (most of the time) and sometimes because it looks cooler and smoother.
Dynamic Island makes apps more useable and interactive. It shows system states visually. Turn signal audio and visual cues, voice assistance, physical and digital haptic feedbacks, heads-up displays, fuel and battery level gauges, and gear shift indicators helped us overcome vehicle design problems.
Dynamic Island is a wonderfully delightful (and temporary) solution to a design “problem” until Apple or other companies can figure out a way to sink the cameras under the smartphone screen.

Apple Has Returned to Being an Innovative & Exciting Company
Now Apple's products are exciting. Next, bring back real Apple events, not pre-recorded demos.
Dynamic Island integrates hardware and software. What will this new tech do? How would this affect device use? Or is it just hype?
Dynamic Island may be an insignificant improvement to the iPhone, but it sure is promising for the future of bridging the human and computer interaction gap.

Alison Randel
3 years ago
Raising the Bar on Your 1:1s

Managers spend much time in 1:1s. Most team members meet with supervisors regularly. 1:1s can help create relationships and tackle tough topics. Few appreciate the 1:1 format's potential. Most of the time, that potential is spent on small talk, surface-level updates, and ranting (Ugh, the marketing team isn’t stepping up the way I want them to).
What if you used that time to have deeper conversations and important insights? What if change was easy?
This post introduces a new 1:1 format to help you dive deeper, faster, and develop genuine relationships without losing impact.
A 1:1 is a chat, you would assume. Why use structure to talk to a coworker? Go! I know how to talk to people. I can write. I've always written. Also, This article was edited by Zoe.
Before you discard something, ask yourself if there's a good reason not to try anything new. Is the 1:1 only a talk, or do you want extra benefits? Try the steps below to discover more.
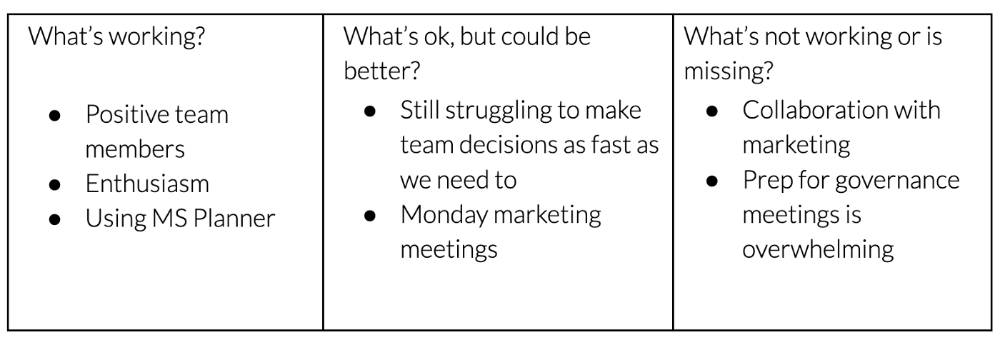
I. Reflection (5 minutes)
Context-free, broad comments waste time and are useless. Instead, give team members 5 minutes to write these 3 prompts.
What's effective?
What is decent but could be improved?
What is broken or missing?
Why these? They encourage people to be honest about all their experiences. Answering these questions helps people realize something isn't working. These prompts let people consider what's working.
Why take notes? Because you get more in less time. Will you feel awkward sitting quietly while your coworker writes? Probably. Persevere. Multi-task. Take a break from your afternoon meeting marathon. Any awkwardness will pay off.
What happens? After a few minutes of light conversation, create a template like the one given here and have team members fill in their replies. You can pre-share the template (with the caveat that this isn’t meant to take much prep time). Do this with your coworker: Answer the prompts. Everyone can benefit from pondering and obtaining guidance.
This step's output.
Part II: Talk (10-20 minutes)
Most individuals can explain what they see but not what's behind an answer. You don't like a meeting. Why not? Marketing partnership is difficult. What makes working with them difficult? I don't recommend slandering coworkers. Consider how your meetings, decisions, and priorities make work harder. The excellent stuff too. You want to know what's humming so you can reproduce the magic.
First, recognize some facts.
Real power dynamics exist. To encourage individuals to be honest, you must provide a safe environment and extend clear invites. Even then, it may take a few 1:1s for someone to feel secure enough to go there in person. It is part of your responsibility to admit that it is normal.
Curiosity and self-disclosure are crucial. Most leaders have received training to present themselves as the authorities. However, you will both benefit more from the dialogue if you can be open and honest about your personal experience, ask questions out of real curiosity, and acknowledge the pertinent sacrifices you're making as a leader.
Honesty without bias is difficult and important. Due to concern for the feelings of others, people frequently hold back. Or if they do point anything out, they do so in a critical manner. The key is to be open and unapologetic about what you observe while not presuming that your viewpoint is correct and that of the other person is incorrect.
Let's go into some prompts (based on genuine conversations):
“What do you notice across your answers?”
“What about the way you/we/they do X, Y, or Z is working well?”
“ Will you say more about item X in ‘What’s not working?’”
“I’m surprised there isn’t anything about Z. Why is that?”
“All of us tend to play some role in maintaining certain patterns. How might you/we be playing a role in this pattern persisting?”
“How might the way we meet, make decisions, or collaborate play a role in what’s currently happening?”
Consider the preceding example. What about the Monday meeting isn't working? Why? or What about the way we work with marketing makes collaboration harder? Remember to share your honest observations!
Third section: observe patterns (10-15 minutes)
Leaders desire to empower their people but don't know how. We also have many preconceptions about what empowerment means to us and how it works. The next phase in this 1:1 format will assist you and your team member comprehend team power and empowerment. This understanding can help you support and shift your team member's behavior, especially where you disagree.
How to? After discussing the stated responses, ask each team member what they can control, influence, and not control. Mark their replies. You can do the same, adding colors where you disagree.
This step's output.
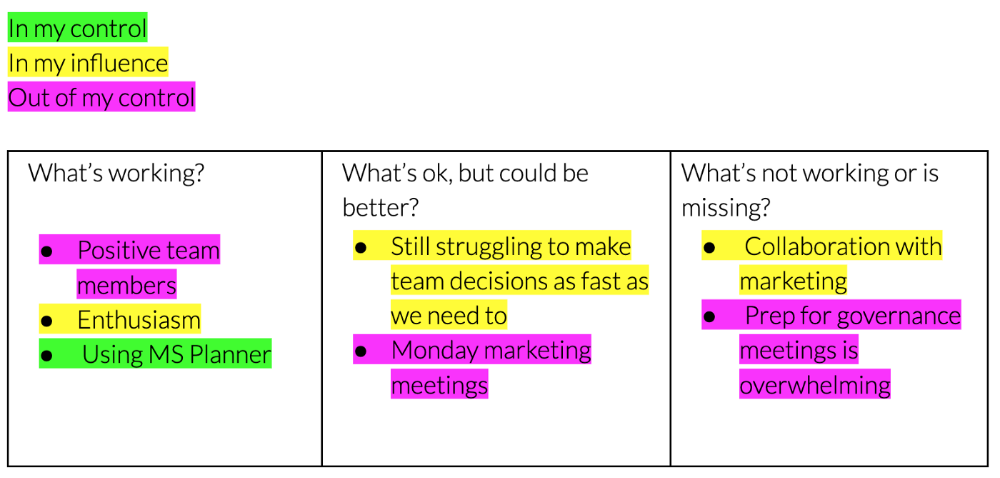
Next, consider the color constellation. Discuss these questions:
Is one color much more prevalent than the other? Why, if so?
Are the colors for the "what's working," "what's fine," and "what's not working" categories clearly distinct? Why, if so?
Do you have any disagreements? If yes, specifically where does your viewpoint differ? What activities do you object to? (Remember, there is no right or wrong in this. Give explicit details and ask questions with curiosity.)
Example: Based on the colors, you can ask, Is the marketing meeting's quality beyond your control? Were our marketing partners consulted? Are there any parts of team decisions we can control? We can't control people, but have we explored another decision-making method? How can we collaborate and generate governance-related information to reduce work, even if the requirement for prep can't be eliminated?
Consider the top one or two topics for this conversation. No 1:1 can cover everything, and that's OK. Focus on the present.
Part IV: Determine the next step (5 minutes)
Last, examine what this conversation means for you and your team member. It's easy to think we know the next moves when we don't.
Like what? You and your teammate answer these questions.
What does this signify moving ahead for me? What can I do to change this? Make requests, for instance, and see how people respond before thinking they won't be responsive.
What demands do I have on other people or my partners? What should I do first? E.g. Make a suggestion to marketing that we hold a monthly retrospective so we can address problems and exchange input more frequently. Include it on the meeting's agenda for next Monday.
Close the 1:1 by sharing what you noticed about the chat. Observations? Learn anything?
Yourself, you, and the 1:1
As a leader, you either reinforce or disrupt habits. Try this template if you desire greater ownership, empowerment, or creativity. Consider how you affect surrounding dynamics. How can you expect others to try something new in high-stakes scenarios, like meetings with cross-functional partners or senior stakeholders, if you won't? How can you expect deep thought and relationship if you don't encourage it in 1:1s? What pattern could this new format disrupt or reinforce?
Fight reluctance. First attempts won't be ideal, and that's OK. You'll only learn by trying.