


Improving collaboration with the Six Thinking Hats
Six Thinking Hats was written by Dr. Edward de Bono. "Six Thinking Hats" and parallel thinking allow groups to plan thinking processes in a detailed and cohesive way, improving collaboration.
Fundamental ideas
In order to develop strategies for thinking about specific issues, the method assumes that the human brain thinks in a variety of ways that can be intentionally challenged. De Bono identifies six brain-challenging directions. In each direction, the brain brings certain issues into conscious thought (e.g. gut instinct, pessimistic judgement, neutral facts). Some may find wearing hats unnatural, uncomfortable, or counterproductive.
The example of "mismatch" sensitivity is compelling. In the natural world, something out of the ordinary may be dangerous. This mode causes negative judgment and critical thinking.
Colored hats represent each direction. Putting on a colored hat symbolizes changing direction, either literally or metaphorically. De Bono first used this metaphor in his 1971 book "Lateral Thinking for Management" to describe a brainstorming framework. These metaphors allow more complete and elaborate thought separation. Six thinking hats indicate ideas' problems and solutions.
Similarly, his CoRT Thinking Programme introduced "The Five Stages of Thinking" method in 1973.
| HAT | OVERVIEW | TECHNIQUE |
|---|---|---|
| BLUE | "The Big Picture" & Managing | CAF (Consider All Factors); FIP (First Important Priorities) |
| WHITE | "Facts & Information" | Information |
| RED | "Feelings & Emotions" | Emotions and Ego |
| BLACK | "Negative" | PMI (Plus, Minus, Interesting); Evaluation |
| YELLOW | "Positive" | PMI |
| GREEN | "New Ideas" | Concept Challenge; Yes, No, Po |
Strategies and programs
After identifying the six thinking modes, programs can be created. These are groups of hats that encompass and structure the thinking process. Several of these are included in the materials for franchised six hats training, but they must often be adapted. Programs are often "emergent," meaning the group plans the first few hats and the facilitator decides what to do next.
The group agrees on how to think, then thinks, then evaluates the results and decides what to do next. Individuals or groups can use sequences (and indeed hats). Each hat is typically used for 2 minutes at a time, although an extended white hat session is common at the start of a process to get everyone on the same page. The red hat is recommended to be used for a very short period to get a visceral gut reaction – about 30 seconds, and in practice often takes the form of dot-voting.
| ACTIVITY | HAT SEQUENCE |
|---|---|
| Initial Ideas | Blue, White, Green, Blue |
| Choosing between alternatives | Blue, White, (Green), Yellow, Black, Red, Blue |
| Identifying Solutions | Blue, White, Black, Green, Blue |
| Quick Feedback | Blue, Black, Green, Blue |
| Strategic Planning | Blue, Yellow, Black, White, Blue, Green, Blue |
| Process Improvement | Blue, White, White (Other People's Views), Yellow, Black, Green, Red, Blue |
| Solving Problems | Blue, White, Green, Red, Yellow, Black, Green, Blue |
| Performance Review | Blue, Red, White, Yellow, Black, Green, Blue |
Use
Speedo's swimsuit designers reportedly used the six thinking hats. "They used the "Six Thinking Hats" method to brainstorm, with a green hat for creative ideas and a black one for feasibility.
Typically, a project begins with extensive white hat research. Each hat is used for a few minutes at a time, except the red hat, which is limited to 30 seconds to ensure an instinctive gut reaction, not judgement. According to Malcolm Gladwell's "blink" theory, this pace improves thinking.
De Bono believed that the key to a successful Six Thinking Hats session was focusing the discussion on a particular approach. A meeting may be called to review and solve a problem. The Six Thinking Hats method can be used in sequence to explore the problem, develop a set of solutions, and choose a solution through critical examination.
Everyone may don the Blue hat to discuss the meeting's goals and objectives. The discussion may then shift to Red hat thinking to gather opinions and reactions. This phase may also be used to determine who will be affected by the problem and/or solutions. The discussion may then shift to the (Yellow then) Green hat to generate solutions and ideas. The discussion may move from White hat thinking to Black hat thinking to develop solution set criticisms.
Because everyone is focused on one approach at a time, the group is more collaborative than if one person is reacting emotionally (Red hat), another is trying to be objective (White hat), and another is critical of the points which emerge from the discussion (Black hat). The hats help people approach problems from different angles and highlight problem-solving flaws.
(Edited)
More on Leadership

William Anderson
3 years ago
When My Remote Leadership Skills Took Off
4 Ways To Manage Remote Teams & Employees
The wheels hit the ground as I landed in Rochester.
Our six-person satellite office was now part of my team.
Their manager only reported to me the day before, but I had my ticket booked ahead of time.
I had managed remote employees before but this was different. Engineers dialed into headquarters for every meeting.
So when I learned about the org chart change, I knew a strong first impression would set the tone for everything else.
I was either their boss, or their boss's boss, and I needed them to know I was committed.
Managing a fleet of satellite freelancers or multiple offices requires treating others as more than just a face behind a screen.
You must comprehend each remote team member's perspective and daily interactions.
The good news is that you can start using these techniques right now to better understand and elevate virtual team members.
1. Make Visits To Other Offices
If budgeted, visit and work from offices where teams and employees report to you. Only by living alongside them can one truly comprehend their problems with communication and other aspects of modern life.
2. Have Others Come to You
• Having remote, distributed, or satellite employees and teams visit headquarters every quarter or semi-quarterly allows the main office culture to rub off on them.
When remote team members visit, more people get to meet them, which builds empathy.
If you can't afford to fly everyone, at least bring remote managers or leaders. Hopefully they can resurrect some culture.
3. Weekly Work From Home
No home office policy?
Make one.
WFH is a team-building, problem-solving, and office-viewing opportunity.
For dial-in meetings, I started working from home on occasion.
It also taught me which teams “forget” or “skip” calls.
As a remote team member, you experience all the issues first hand.
This isn't as accurate for understanding teams in other offices, but it can be done at any time.
4. Increase Contact Even If It’s Just To Chat
Don't underestimate office banter.
Sometimes it's about bonding and trust, other times it's about business.
If you get all this information in real-time, please forward it.
Even if nothing critical is happening, call remote team members to check in and chat.
I guarantee that building relationships and rapport will increase both their job satisfaction and yours.

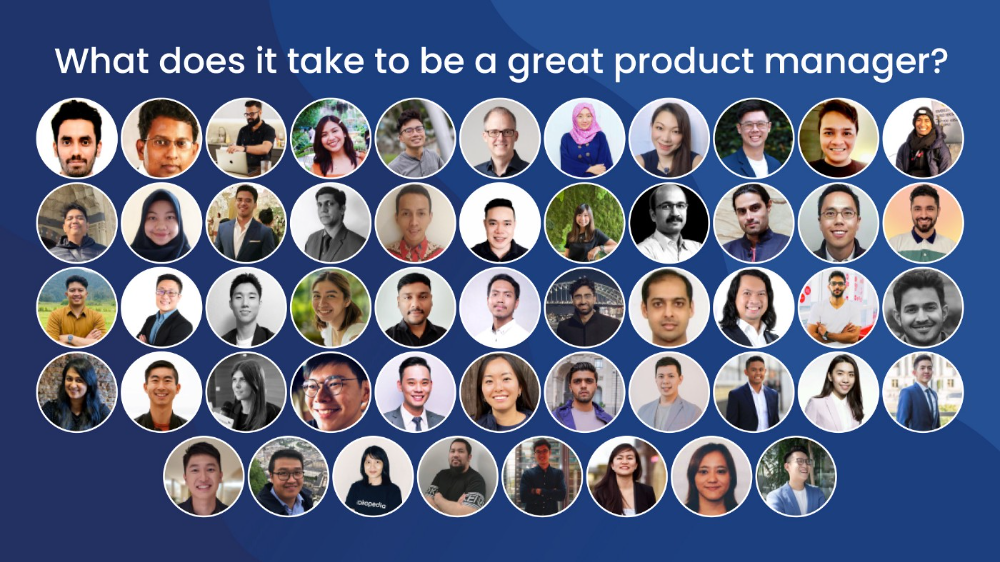
Looi Qin En
3 years ago
I polled 52 product managers to find out what qualities make a great Product Manager
Great technology opens up an universe of possibilities.
Need a friend? WhatsApp, Telegram, Slack, etc.
Traveling? AirBnB, Expedia, Google Flights, etc.
Money transfer? Use digital banking, e-wallet, or crypto applications
Products inspire us. How do we become great?
I asked product managers in my network:
What does it take to be a great product manager?
52 product managers from 40+ prominent IT businesses in Southeast Asia responded passionately. Many of the PMs I've worked with have built fantastic products, from unicorns (Lazada, Tokopedia, Ovo) to incumbents (Google, PayPal, Experian, WarnerMedia) to growing (etaily, Nium, Shipper).
TL;DR:
Soft talents are more important than hard skills. Technical expertise was hardly ever stressed by product managers, and empathy was mentioned more than ten times. Janani from Xendit expertly recorded the moment. A superb PM must comprehend that their empathy for the feelings of their users must surpass all logic and data.
Constant attention to the needs of the user. Many people concur that the closer a PM gets to their customer/user, the more likely it is that the conclusion will be better. There were almost 30 references to customers and users. Focusing on customers has the advantage because it is hard to overshoot, as Rajesh from Lazada puts it best.
Setting priorities is invaluable. Prioritization is essential because there are so many problems that a PM must deal with every day. My favorite quotation on this is from Rakuten user Yee Jie. Viki, A competent product manager extinguishes fires. A good product manager lets things burn and then prioritizes.
This summary isn't enough to capture what excellent PMs claim it requires. Read below!
What qualities make a successful product manager?
Themed quotes are alphabetized by author.
Embrace your user/customer
Aeriel Dela Paz, Rainmaking Venture Architect, ex-GCash Product Head
Great PMs know what customers need even when they don’t say it directly. It’s about reading between the lines and going through the numbers to address that need.
Anders Nordahl, OrkestraSCS's Product Manager
Understanding the vision of your customer is as important as to get the customer to buy your vision
Angel Mendoza, MetaverseGo's Product Head
Most people think that to be a great product manager, you must have technical know-how. It’s textbook and I do think it is helpful to some extent, but for me the secret sauce is EMPATHY — the ability to see and feel things from someone else’s perspective. You can’t create a solution without deeply understanding the problem.
Senior Product Manager, Tokopedia
Focus on delivering value and helping people (consumer as well as colleague) and everything else will follow
Darren Lau, Deloitte Digital's Head of Customer Experience
Start with the users, and work backwards. Don’t have a solution looking for a problem
Darryl Tan, Grab Product Manager
I would say that a great product manager is able to identify the crucial problems to solve through strong user empathy and synthesis of insights
Diego Perdana, Kitalulus Senior Product Manager
I think to be a great product manager you need to be obsessed with customer problems and most important is solve the right problem with the right solution
Senior Product Manager, AirAsia
Lot of common sense + Customer Obsession. The most important role of a Product manager is to bring clarity of a solution. Your product is good if it solves customer problems. Your product is great if it solves an eco-system problem and disrupts the business in a positive way.
Edward Xie, Mastercard Managing Consultant, ex-Shopee Product Manager
Perfect your product, but be prepared to compromise for right users
AVP Product, Shipper
For me, a great product manager need to be rational enough to find the business opportunities while obsessing the customers.
Janani Gopalakrishnan is a senior product manager of a stealth firm.
While as a good PM it’s important to be data-driven, to be a great PM one needs to understand that their empathy for their users’ emotions must exceed all logic and data. Great PMs also make these product discussions thrive within the team by intently listening to all the members thoughts and influence the team’s skin in the game positively.
Director, Product Management, Indeed
Great product managers put their users first. They discover problems that matter most to their users and inspire their team to find creative solutions.
Grab's Senior Product Manager Lakshay Kalra
Product management is all about finding and solving most important user problems
Quipper's Mega Puji Saraswati
First of all, always remember the value of “user first” to solve what user really needs (the main problem) for guidance to arrange the task priority and develop new ideas. Second, ownership. Treat the product as your “2nd baby”, and the team as your “2nd family”. Third, maintain a good communication, both horizontally and vertically. But on top of those, always remember to have a work — life balance, and know exactly the priority in life :)
Senior Product Manager, Prosa.AI Miswanto Miswanto
A great Product Manager is someone who can be the link between customer needs with the readiness and flexibility of the team. So that it can provide, build, and produce a product that is useful and helps the community to carry out their daily activities. And He/She can improve product quality ongoing basis or continuous to help provide solutions for users or our customer.
Lead Product Manager, Tokopedia, Oriza Wahyu Utami
Be a great listener, be curious and be determined. every great product manager have the ability to listen the pain points and understand the problems, they are always curious on the users feedback, and they also very determined to look for the solutions that benefited users and the business.
99 Group CPO Rajesh Sangati
The advantage of focusing on customers: it’s impossible to overshoot
Ray Jang, founder of Scenius, formerly of ByteDance
The difference between good and great product managers is that great product managers are willing to go the unsexy and unglamorous extra mile by rolling up their sleeves and ironing out all minutiae details of the product such that when the user uses the product, they can’t help but say “This was made for me.”
BCG Digital Ventures' Sid Narayanan
Great product managers ensure that what gets built and shipped is at the intersection of what creates value for the customer and for the business that’s building the product…often times, especially in today’s highly liquid funding environment, the unit economics, aka ensuring that what gets shipped creates value for the business and is sustainable, gets overlooked
Stephanie Brownlee, BCG Digital Ventures Product Manager
There is software in the world that does more harm than good to people and society. Great Product Managers build products that solve problems not create problems
Experiment constantly
Delivery Hero's Abhishek Muralidharan
Embracing your failure is the key to become a great Product Manager
DeliveryHero's Anuraag Burman
Product Managers should be thick skinned to deal with criticism and the stomach to take risk and face failures.
DataSpark Product Head Apurva Lawale
Great product managers enjoy the creative process with their team to deliver intuitive user experiences to benefit users.
Dexter Zhuang, Xendit Product Manager
The key to creating winning products is building what customers want as quickly as you can — testing and learning along the way.
PayPal's Jay Ko
To me, great product managers always remain relentlessly curious. They are empathetic leaders and problem solvers that glean customer insights into building impactful products
Home Credit Philippines' Jedd Flores
Great Product Managers are the best dreamers; they think of what can be possible for the customers, for the company and the positive impact that it will have in the industry that they’re part of
Set priorities first, foremost, foremost.
HBO Go Product Manager Akshay Ishwar
Good product managers strive to balance the signal to noise ratio, Great product managers know when to turn the dials for each up exactly
Zuellig Pharma's Guojie Su
Have the courage to say no. Managing egos and request is never easy and rejecting them makes it harder but necessary to deliver the best value for the customers.
Ninja Van's John Prawira
(1) PMs should be able to ruthlessly prioritize. In order to be effective, PMs should anchor their product development process with their north stars (success metrics) and always communicate with a purpose. (2) User-first when validating assumptions. PMs should validate assumptions early and often to manage risk when leading initiatives with a focus on generating the highest impact to solving a particular user pain-point. We can’t expect a product/feature launch to be perfect (there might be bugs or we might not achieve our success metric — which is where iteration comes in), but we should try our best to optimize on user-experience earlier on.
Nium Product Manager Keika Sugiyama
I’d say a great PM holds the ability to balance ruthlessness and empathy at the same time. It’s easier said than done for sure!
ShopBack product manager Li Cai
Great product managers are like great Directors of movies. They do not create great products/movies by themselves. They deliver it by Defining, Prioritising, Energising the team to deliver what customers love.
Quincus' Michael Lim
A great product manager, keeps a pulse on the company’s big picture, identifies key problems, and discerns its rightful prioritization, is able to switch between the macro perspective to micro specifics, and communicates concisely with humility that influences naturally for execution
Mathieu François-Barseghian, SVP, Citi Ventures
“You ship your org chart”. This is Conway’s Law short version (1967!): the fundamental socio-technical driver behind innovation successes (Netflix) and failures (your typical bank). The hype behind micro-services is just another reflection of Conway’s Law
Mastercard's Regional Product Manager Nikhil Moorthy
A great PM should always look to build products which are scalable & viable , always keep the end consumer journey in mind. Keeping things simple & having a MVP based approach helps roll out products faster. One has to test & learn & then accordingly enhance / adapt, these are key to success
Rendy Andi, Tokopedia Product Manager
Articulate a clear vision and the path to get there, Create a process that delivers the best results and Be serious about customers.
Senior Product Manager, DANA Indonesia
Own the problem, not the solution — Great PMs are outstanding problem preventers. Great PMs are discerning about which problems to prevent, which problems to solve, and which problems not to solve
Tat Leong Seah, LionsBot International Senior UX Engineer, ex-ViSenze Product Manager
Prioritize outcomes for your users, not outputs of your system” or more succinctly “be agile in delivering value; not features”
Senior Product Manager, Rakuten Viki
A good product manager puts out fires. A great product manager lets fires burn and prioritize from there
acquire fundamental soft skills
Oracle NetSuite's Astrid April Dominguez
Personally, i believe that it takes grit, empathy, and optimistic mindset to become a great PM
Ovo Lead Product Manager Boy Al Idrus
Contrary to popular beliefs, being a great product manager doesn’t have anything to do with technicals, it sure plays a part but most important weapons are: understanding pain points of users, project management, sympathy in leadership and business critical skills; these 4 aspects would definitely help you to become a great product manager.
PwC Product Manager Eric Koh
Product managers need to be courageous to be successful. Courage is required to dive deep, solving big problems at its root and also to think far and dream big to achieve bold visions for your product
Ninja Van's Product Director
In my opinion the two most important ingredients to become a successful product manager is: 1. Strong critical thinking 2. Strong passion for the work. As product managers, we typically need to solve very complex problems where the answers are often very ambiguous. The work is tough and at times can be really frustrating. The 2 ingredients I mentioned earlier will be critical towards helping you to slowly discover the solution that may become a game changer.
PayPal's Lead Product Manager
A great PM has an eye of a designer, the brain of an engineer and the tongue of a diplomat
Product Manager Irene Chan
A great Product Manager is able to think like a CEO of the company. Visionary with Agile Execution in mind
Isabella Yamin, Rakuten Viki Product Manager
There is no one model of being a great product person but what I’ve observed from people I’ve had the privilege working with is an overflowing passion for the user problem, sprinkled with a knack for data and negotiation
Google product manager Jachin Cheng
Great product managers start with abundant intellectual curiosity and grow into a classic T-shape. Horizontally: generalists who range widely, communicate fluidly and collaborate easily cross-functionally, connect unexpected dots, and have the pulse both internally and externally across users, stakeholders, and ecosystem players. Vertically: deep product craftsmanship comes from connecting relentless user obsession with storytelling, business strategy with detailed features and execution, inspiring leadership with risk mitigation, and applying the most relevant tools to solving the right problems.
Jene Lim, Experian's Product Manager
3 Cs and 3 Rs. Critical thinking , Customer empathy, Creativity. Resourcefulness, Resilience, Results orientation.
Nirenj George, Envision Digital's Security Product Manager
A great product manager is someone who can lead, collaborate and influence different stakeholders around the product vision, and should be able to execute the product strategy based on customer insights, as well as take ownership of the product roadmap to create a greater impact on customers.
Grab's Lead Product Manager
Product Management is a multi-dimensional role that looks very different across each product team so each product manager has different challenges to deal with but what I have found common among great product managers is ability to create leverage through their efforts to drive outsized impacts for their products. This leverage is built using data with intuition, building consensus with stakeholders, empowering their teams and focussed efforts on needle moving work.
NCS Product Manager Umar Masagos
To be a great product manager, one must master both the science and art of Product Management. On one hand, you need have a strong understanding of the tools, metrics and data you need to drive your product. On the other hand, you need an in-depth understanding of your organization, your target market and target users, which is often the more challenging aspect to master.
M1 product manager Wei Jiao Keong
A great product manager is multi-faceted. First, you need to have the ability to see the bigger picture, yet have a keen eye for detail. Secondly, you are empathetic and is able to deliver products with exceptional user experience while being analytical enough to achieve business outcomes. Lastly, you are highly resourceful and independent yet comfortable working cross-functionally.
Yudha Utomo, ex-Senior Product Manager, Tokopedia
A great Product Manager is essentially an effective note-taker. In order to achieve the product goals, It is PM’s job to ensure objective has been clearly conveyed, efforts are assessed, and tasks are properly tracked and managed. PM can do this by having top-notch documentation skills.

Caspar Mahoney
3 years ago
Changing Your Mindset From a Project to a Product
Product game mindsets? How do these vary from Project mindset?

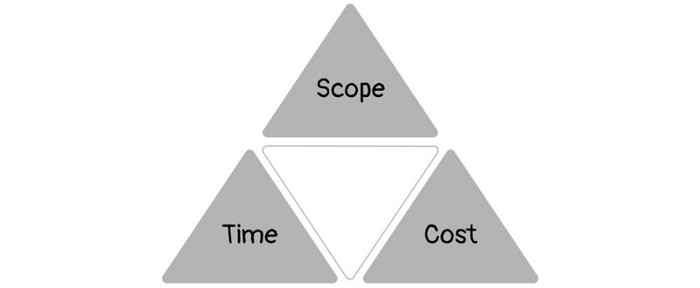
1950s spawned the Iron Triangle. Project people everywhere know and live by it. In stakeholder meetings, it is used to stretch the timeframe, request additional money, or reduce scope.
Quality was added to this triangle as things matured.
Quality was intended to be transformative, but none of these principles addressed why we conduct projects.
Value and benefits are key.
Product value is quantified by ROI, revenue, profit, savings, or other metrics. For me, every project or product delivery is about value.
Most project managers, especially those schooled 5-10 years or more ago (thousands working in huge corporations worldwide), understand the world in terms of the iron triangle. What does that imply? They worry about:
a) enough time to get the thing done.
b) have enough resources (budget) to get the thing done.
c) have enough scope to fit within (a) and (b) >> note, they never have too little scope, not that I have ever seen! although, theoretically, this could happen.
Boom—iron triangle.
To make the triangle function, project managers will utilize formal governance (Steering) to move those things. Increase money, scope, or both if time is short. Lacking funds? Increase time, scope, or both.
In current product development, shifting each item considerably may not yield value/benefit.
Even terrible. This approach will fail because it deprioritizes Value/Benefit by focusing the major stakeholders (Steering participants) and delivery team(s) on Time, Scope, and Budget restrictions.
Pre-agile, this problem was terrible. IT projects failed wildly. History is here.
Value, or benefit, is central to the product method. Product managers spend most of their time planning value-delivery paths.
Product people consider risk, schedules, scope, and budget, but value comes first. Let me illustrate.
Imagine managing internal products in an enterprise. Your core customer team needs a rapid text record of a chat to fix a problem. The consumer wants a feature/features added to a product you're producing because they think it's the greatest spot.
Project-minded, I may say;
Ok, I have budget as this is an existing project, due to run for a year. This is a new requirement to add to the features we’re already building. I think I can keep the deadline, and include this scope, as it sounds related to the feature set we’re building to give the desired result”.
This attitude repeats Scope, Time, and Budget.
Since it meets those standards, a project manager will likely approve it. If they have a backlog, they may add it and start specking it out assuming it will be built.
Instead, think like a product;
What problem does this feature idea solve? Is that problem relevant to the product I am building? Can that problem be solved quicker/better via another route ? Is it the most valuable problem to solve now? Is the problem space aligned to our current or future strategy? or do I need to alter/update the strategy?
A product mindset allows you to focus on timing, resource/cost, feasibility, feature detail, and so on after answering the aforementioned questions.
The above oversimplifies because
Leadership in discovery

Project managers are facilitators of ideas. This is as far as they normally go in the ‘idea’ space.
Business Requirements collection in classic project delivery requires extensive upfront documentation.
Agile project delivery analyzes requirements iteratively.
However, the project manager is a facilitator/planner first and foremost, therefore topic knowledge is not expected.
I mean business domain, not technical domain (to confuse matters, it is true that in some instances, it can be both technical and business domains that are important for a single individual to master).
Product managers are domain experts. They will become one if they are training/new.
They lead discovery.
Product Manager-led discovery is much more than requirements gathering.
Requirements gathering involves a Business Analyst interviewing people and documenting their requests.
The project manager calculates what fits and what doesn't using their Iron Triangle (presumably in their head) and reports back to Steering.
If this requirements-gathering exercise failed to identify requirements, what would a project manager do? or bewildered by project requirements and scope?
They would tell Steering they need a Business SME or Business Lead assigning or more of their time.
Product discovery requires the Product Manager's subject knowledge and a new mindset.
How should a Product Manager handle confusing requirements?
Product Managers handle these challenges with their talents and tools. They use their own knowledge to fill in ambiguity, but they have the discipline to validate those assumptions.
To define the problem, they may perform qualitative or quantitative primary research.
They might discuss with UX and Engineering on a whiteboard and test assumptions or hypotheses.
Do Product Managers escalate confusing requirements to Steering/Senior leaders? They would fix that themselves.
Product managers raise unclear strategy and outcomes to senior stakeholders. Open talks, soft skills, and data help them do this. They rarely raise requirements since they have their own means of handling them without top stakeholder participation.
Discovery is greenfield, exploratory, research-based, and needs higher-order stakeholder management, user research, and UX expertise.
Product Managers also aid discovery. They lead discovery. They will not leave customer/user engagement to a Business Analyst. Administratively, a business analyst could aid. In fact, many product organizations discourage business analysts (rely on PM, UX, and engineer involvement with end-users instead).
The Product Manager must drive user interaction, research, ideation, and problem analysis, therefore a Product professional must be skilled and confident.
Creating vs. receiving and having an entrepreneurial attitude

Product novices and project managers focus on details rather than the big picture. Project managers prefer spreadsheets to strategy whiteboards and vision statements.
These folks ask their manager or senior stakeholders, "What should we do?"
They then elaborate (in Jira, in XLS, in Confluence or whatever).
They want that plan populated fast because it reduces uncertainty about what's going on and who's supposed to do what.
Skilled Product Managers don't only ask folks Should we?
They're suggesting this, or worse, Senior stakeholders, here are some options. After asking and researching, they determine what value this product adds, what problems it solves, and what behavior it changes.
Therefore, to move into Product, you need to broaden your view and have courage in your ability to discover ideas, find insightful pieces of information, and collate them to form a valuable plan of action. You are constantly defining RoI and building Business Cases, so much so that you no longer create documents called Business Cases, it is simply ingrained in your work through metrics, intelligence, and insights.
Product Management is not a free lunch.
Plateless.
Plates and food must be prepared.
In conclusion, Product Managers must make at least three mentality shifts:
You put value first in all things. Time, money, and scope are not as important as knowing what is valuable.
You have faith in the field and have the ability to direct the search. YYou facilitate, but you don’t just facilitate. You wouldn't want to limit your domain expertise in that manner.
You develop concepts, strategies, and vision. You are not a waiter or an inbox where other people can post suggestions; you don't merely ask folks for opinion and record it. However, you excel at giving things that aren't clearly spoken or written down physical form.
You might also like
Tom Connor
3 years ago
12 mental models that I use frequently
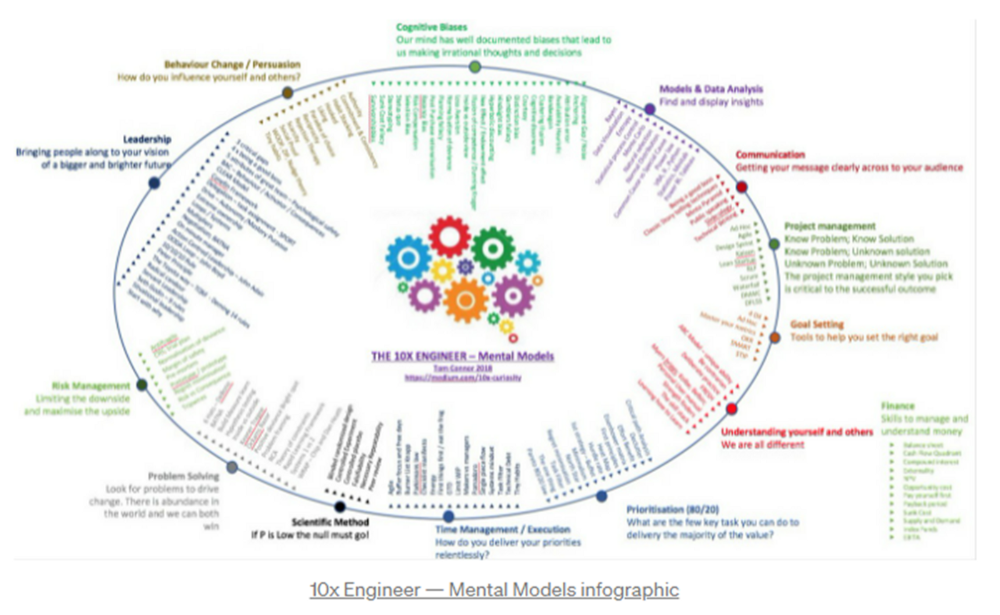
https://tomconnor.me/wp-content/uploads/2021/08/10x-Engineer-Mental-Models.pdf
I keep returning to the same mental models and tricks after writing and reading about a wide range of topics.
Top 12 mental models
12.
Survival bias - We perceive the surviving population as remarkable, yet they may have gotten there through sheer grit.
Survivorship bias affects us in many situations. Our retirement fund; the unicorn business; the winning team. We often study and imitate the last one standing. This can lead to genuine insights and performance improvements, but it can also lead us astray because the leader may just be lucky.
11.
The Helsinki Bus Theory - How to persevere Buss up!
Always display new work, and always be compared to others. Why? Easy. Keep riding. Stay on the fucking bus.
10.
Until it sticks… Turning up every day… — Artists teach engineers plenty. Quality work over a career comes from showing up every day and starting.
9.
WRAP decision making process (Heath Brothers)
Decision-making WRAP Model:
W — Widen your Options
R — Reality test your assumptions
A — Attain Distance
P — Prepare to be wrong or Right
8.
Systems for knowledge worker excellence - Todd Henry and Cal Newport write about techniques knowledge workers can employ to build a creative rhythm and do better work.
Todd Henry's FRESH framework:
Focus: Keep the start in mind as you wrap up.
Relationships: close a loop that's open.
Pruning is an energy.
Set aside time to be inspired by stimuli.
Hours: Spend time thinking.
7.
BBT is learning from mistakes. Science has transformed the world because it constantly updates its theories in light of failures. Complexity guarantees failure. Do we learn or self-justify?
6.
The OODA Loop - Competitive advantage
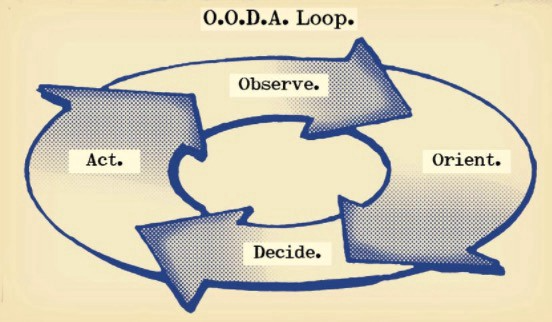
O: Observe: collect the data. Figure out exactly where you are, what’s happening.
O: Orient: analyze/synthesize the data to form an accurate picture.
D: Decide: select an action from possible options
A: Action: execute the action, and return to step (1)
Boyd's approach indicates that speed and agility are about information processing, not physical reactions. They form feedback loops. More OODA loops improve speed.
5.
Leaders who try to impose order in a complex situation fail; those who set the stage, step back, and allow patterns to develop win.
https://vimeo.com/640941172?embedded=true&source=vimeo_logo&owner=11999906
4.
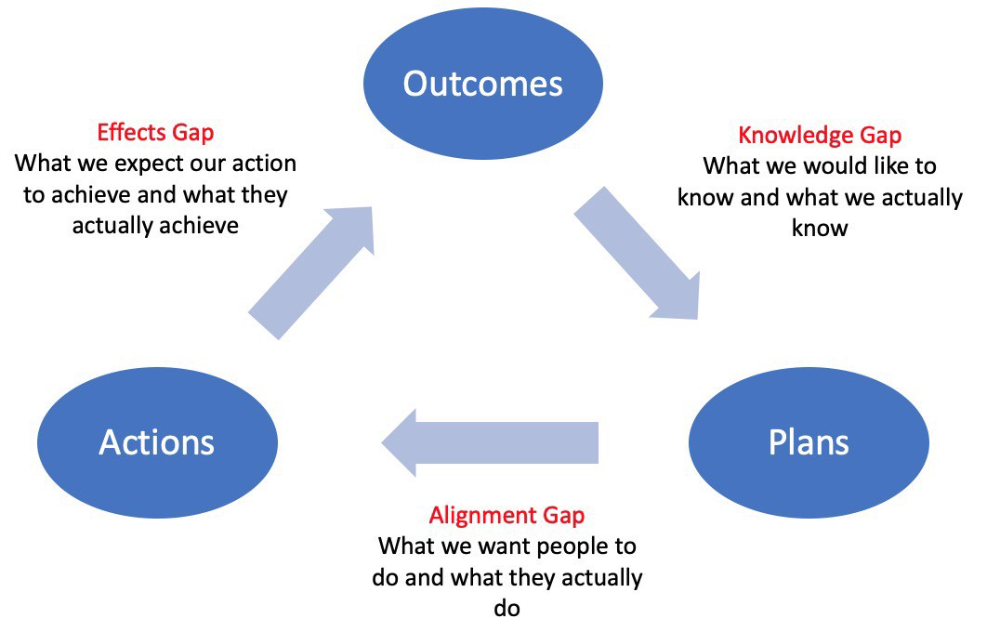
Information Gap - The discrepancy between what we know and what we would like to know
Gap in Alignment - What individuals actually do as opposed to what we wish them to do
Effects Gap - the discrepancy between our expectations and the results of our actions
3.
Theory of Constraints — The Goal - To maximize system production, maximize bottleneck throughput.
Goldratt creates a five-step procedure:
Determine the restriction
Improve the restriction.
Everything else should be based on the limitation.
Increase the restriction
Go back to step 1 Avoid letting inertia become a limitation.
Any non-constraint improvement is an illusion.
2.
Serendipity and the Adjacent Possible - Why do several amazing ideas emerge at once? How can you foster serendipity in your work?
You need specialized abilities to reach to the edge of possibilities, where you can pursue exciting tasks that will change the world. Few people do it since it takes a lot of hard work. You'll stand out if you do.
Most people simply lack the comfort with discomfort required to tackle really hard things. At some point, in other words, there’s no way getting around the necessity to clear your calendar, shut down your phone, and spend several hard days trying to make sense of the damn proof.
1.
Boundaries of failure - Rasmussen's accident model.
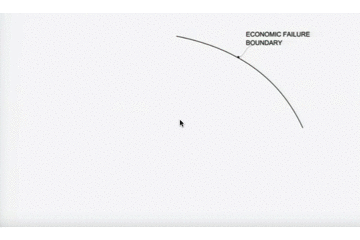
Rasmussen modeled this. It has economic, workload, and performance boundaries.
The economic boundary is a company's profit zone. If the lights are on, you're within the economic boundaries, but there's pressure to cut costs and do more.
Performance limit reflects system capacity. Taking shortcuts is a human desire to minimize work. This is often necessary to survive because there's always more labor.
Both push operating points toward acceptable performance. Personal or process safety, or equipment performance.
If you exceed acceptable performance, you'll push back, typically forcefully.

Isaiah McCall
3 years ago
There is a new global currency emerging, but it is not bitcoin.
America should avoid BRICS

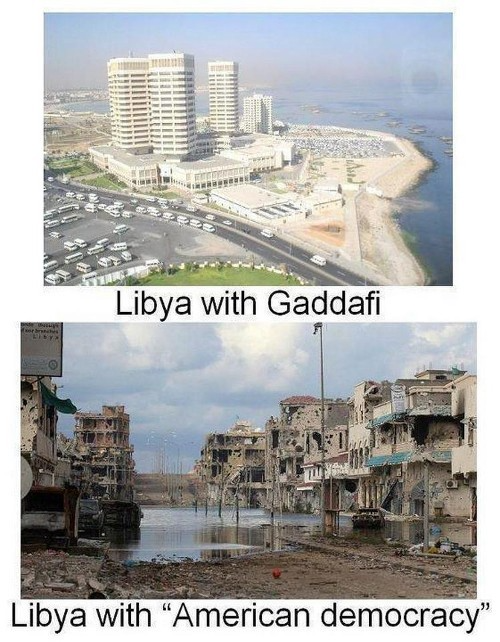
Vladimir Putin has watched videos of Muammar Gaddafi's CIA-backed demise.
Gaddafi...
Thief.
Did you know Gaddafi wanted a gold-backed dinar for Africa? Because he considered our global financial system was a Ponzi scheme, he wanted to discontinue trading oil in US dollars.
Or, Gaddafi's Libya enjoyed Africa's highest quality of living before becoming freed. Pictured:
Vladimir Putin is a nasty guy, but he had his reasons for not mentioning NATO assisting Ukraine in resisting US imperialism. Nobody tells you. Sure.
The US dollar's corruption post-2008, debasement by quantitative easing, and lack of value are key factors. BRICS will replace the dollar.
BRICS aren't bricks.
Economy-related.
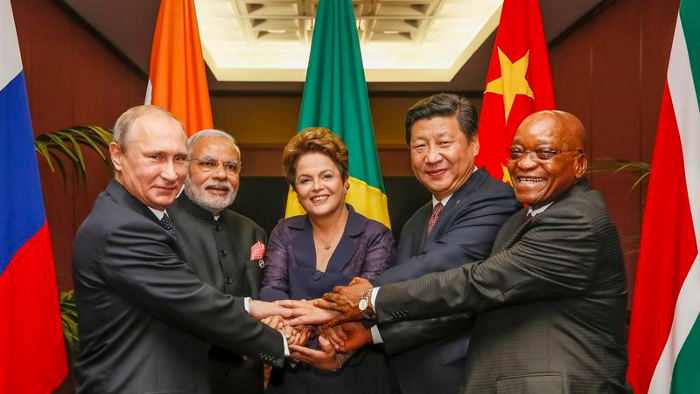
Brazil, Russia, India, China, and South Africa have cooperated for 14 years to fight U.S. hegemony with a new international currency: BRICS.
BRICS is mostly comical. Now. Saudi Arabia, the second-largest oil hegemon, wants to join.
So what?
The New World Currency is BRICS
Russia was kicked out of G8 for its aggressiveness in Crimea in 2014.
It's now G7.
No biggie, said Putin, he said, and I quote, “Bon appetite.”
He was prepared. China, India, and Brazil lead the New World Order.
Together, they constitute 40% of the world's population and, according to the IMF, 50% of the world's GDP by 2030.
Here’s what the BRICS president Marcos Prado Troyjo had to say earlier this year about no longer needing the US dollar: “We have implemented the mechanism of mutual settlements in rubles and rupees, and there is no need for our countries to use the dollar in mutual settlements. And today a similar mechanism of mutual settlements in rubles and yuan is being developed by China.”
Ick. That's D.C. and NYC warmongers licking their chops for WW3 nasty.
Here's a lovely picture of BRICS to relax you:
If Saudi Arabia joins BRICS, as President Mohammed Bin Salman has expressed interest, a majority of the Middle East will have joined forces to construct a new world order not based on the US currency.
I'm not sure of the new acronym.
SBRICSS? CIRBSS? CRIBSS?
The Reason America Is Harvesting What It Sowed
BRICS began 14 years ago.
14 years ago, what occurred? Concentrate. It involved CDOs, bad subprime mortgages, and Wall Street quants crunching numbers.
2008 recession
When two nations trade, they do so in US dollars, not Euros or gold.
What happened when 2008, an avoidable crisis caused by US banks' cupidity and ignorance, what happened?
Everyone WORLDWIDE felt the pain.
Mostly due to corporate America's avarice.
This should have been a warning that China and Russia had enough of our bs. Like when France sent a battleship to America after Nixon scrapped the gold standard. The US was warned to shape up or be dethroned (or at least try).
Nixon improved in 1971. Kinda. Invented PetroDollar.
Another BS system that unfairly favors America and possibly pushed Russia, China, and Saudi Arabia into BRICS.
The PetroDollar forces oil-exporting nations to trade in US dollars and invest in US Treasury bonds. Brilliant. Genius evil.
Our misdeeds are:
In conflicts that are not its concern, the USA uses the global reserve currency as a weapon.
Targeted nations abandon the dollar, and rightfully so, as do nations that depend on them for trade in vital resources.
The dollar's position as the world's reserve currency is in jeopardy, which could have disastrous economic effects.
Although we have actually sown our own doom, we appear astonished. According to the Bible, whomever sows to appease his sinful nature will reap destruction from that nature whereas whoever sows to appease the Spirit will reap eternal life from the Spirit.
Americans, even our leaders, lack caution and delayed pleasure. When our unsustainable systems fail, we double down. Bailouts of the banks in 2008 were myopic, puerile, and another nail in America's hegemony.
America has screwed everyone.
We're unpopular.
The BRICS's future
It's happened before.
Saddam Hussein sold oil in Euros in 2000, and the US invaded Iraq a month later. The media has devalued the word conspiracy. The Iraq conspiracy.
There were no WMDs, but NYT journalists like Judy Miller drove Americans into a warmongering frenzy because Saddam would ruin the PetroDollar. Does anyone recall that this war spawned ISIS?
I think America has done good for the world. You can make a convincing case that we're many people's villain.
Learn more in Confessions of an Economic Hitman, The Devil's Chessboard, or Tyranny of the Federal Reserve. Or ignore it. That's easier.
We, America, should extend an olive branch, ask for forgiveness, and learn from our faults, as the Tao Te Ching advises. Unlikely. Our population is apathetic and stupid, and our government is corrupt.
Argentina, Iran, Egypt, and Turkey have also indicated interest in joining BRICS. They're also considering making it gold-backed, making it a new world reserve currency.
You should pay attention.
Thanks for reading!

Dmitrii Eliuseev
2 years ago
Creating Images on Your Local PC Using Stable Diffusion AI
Deep learning-based generative art is being researched. As usual, self-learning is better. Some models, like OpenAI's DALL-E 2, require registration and can only be used online, but others can be used locally, which is usually more enjoyable for curious users. I'll demonstrate the Stable Diffusion model's operation on a standard PC.
Let’s get started.
What It Does
Stable Diffusion uses numerous components:
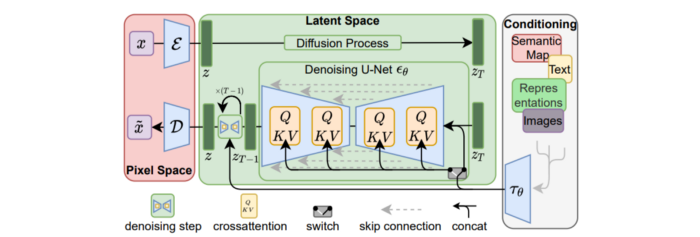
A generative model trained to produce images is called a diffusion model. The model is incrementally improving the starting data, which is only random noise. The model has an image, and while it is being trained, the reversed process is being used to add noise to the image. Being able to reverse this procedure and create images from noise is where the true magic is (more details and samples can be found in the paper).
An internal compressed representation of a latent diffusion model, which may be altered to produce the desired images, is used (more details can be found in the paper). The capacity to fine-tune the generation process is essential because producing pictures at random is not very attractive (as we can see, for instance, in Generative Adversarial Networks).
A neural network model called CLIP (Contrastive Language-Image Pre-training) is used to translate natural language prompts into vector representations. This model, which was trained on 400,000,000 image-text pairs, enables the transformation of a text prompt into a latent space for the diffusion model in the scenario of stable diffusion (more details in that paper).
This figure shows all data flow:
The weights file size for Stable Diffusion model v1 is 4 GB and v2 is 5 GB, making the model quite huge. The v1 model was trained on 256x256 and 512x512 LAION-5B pictures on a 4,000 GPU cluster using over 150.000 NVIDIA A100 GPU hours. The open-source pre-trained model is helpful for us. And we will.
Install
Before utilizing the Python sources for Stable Diffusion v1 on GitHub, we must install Miniconda (assuming Git and Python are already installed):
wget https://repo.anaconda.com/miniconda/Miniconda3-py39_4.12.0-Linux-x86_64.sh
chmod +x Miniconda3-py39_4.12.0-Linux-x86_64.sh
./Miniconda3-py39_4.12.0-Linux-x86_64.sh
conda update -n base -c defaults conda
Install the source and prepare the environment:
git clone https://github.com/CompVis/stable-diffusion
cd stable-diffusion
conda env create -f environment.yaml
conda activate ldm
pip3 install transformers --upgrade
Download the pre-trained model weights next. HiggingFace has the newest checkpoint sd-v14.ckpt (a download is free but registration is required). Put the file in the project folder and have fun:
python3 scripts/txt2img.py --prompt "hello world" --plms --ckpt sd-v1-4.ckpt --skip_grid --n_samples 1Almost. The installation is complete for happy users of current GPUs with 12 GB or more VRAM. RuntimeError: CUDA out of memory will occur otherwise. Two solutions exist.
Running the optimized version
Try optimizing first. After cloning the repository and enabling the environment (as previously), we can run the command:
python3 optimizedSD/optimized_txt2img.py --prompt "hello world" --ckpt sd-v1-4.ckpt --skip_grid --n_samples 1Stable Diffusion worked on my visual card with 8 GB RAM (alas, I did not behave well enough to get NVIDIA A100 for Christmas, so 8 GB GPU is the maximum I have;).
Running Stable Diffusion without GPU
If the GPU does not have enough RAM or is not CUDA-compatible, running the code on a CPU will be 20x slower but better than nothing. This unauthorized CPU-only branch from GitHub is easiest to obtain. We may easily edit the source code to use the latest version. It's strange that a pull request for that was made six months ago and still hasn't been approved, as the changes are simple. Readers can finish in 5 minutes:
Replace if attr.device!= torch.device(cuda) with if attr.device!= torch.device(cuda) and torch.cuda.is available at line 20 of ldm/models/diffusion/ddim.py ().
Replace if attr.device!= torch.device(cuda) with if attr.device!= torch.device(cuda) and torch.cuda.is available in line 20 of ldm/models/diffusion/plms.py ().
Replace device=cuda in lines 38, 55, 83, and 142 of ldm/modules/encoders/modules.py with device=cuda if torch.cuda.is available(), otherwise cpu.
Replace model.cuda() in scripts/txt2img.py line 28 and scripts/img2img.py line 43 with if torch.cuda.is available(): model.cuda ().
Run the script again.
Testing
Test the model. Text-to-image is the first choice. Test the command line example again:
python3 scripts/txt2img.py --prompt "hello world" --plms --ckpt sd-v1-4.ckpt --skip_grid --n_samples 1The slow generation takes 10 seconds on a GPU and 10 minutes on a CPU. Final image:

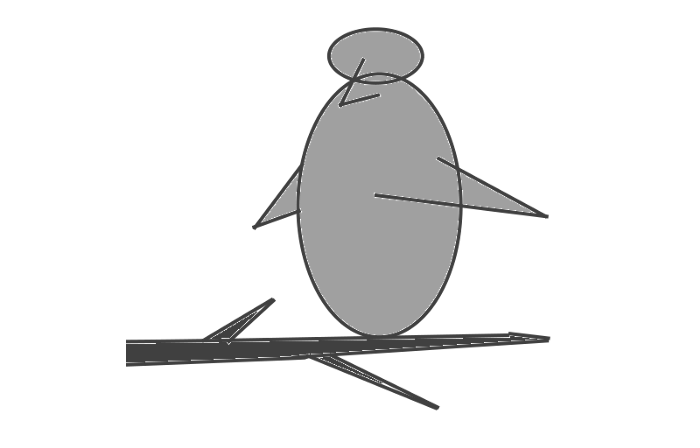
Hello world is dull and abstract. Try a brush-wielding hamster. Why? Because we can, and it's not as insane as Napoleon's cat. Another image:
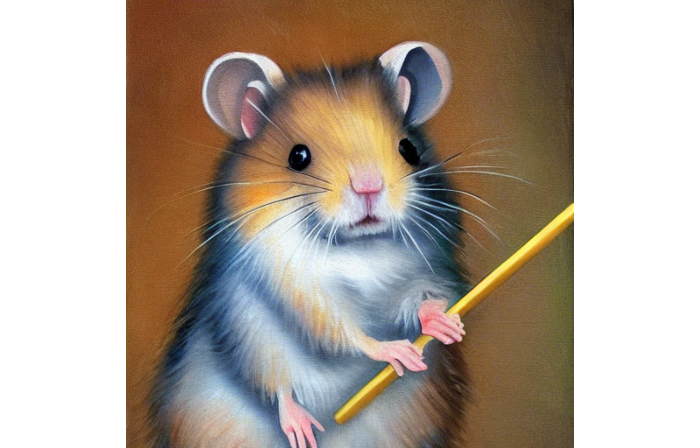
Generating an image from a text prompt and another image is interesting. I made this picture in two minutes using the image editor (sorry, drawing wasn't my strong suit):
I can create an image from this drawing:
python3 scripts/img2img.py --prompt "A bird is sitting on a tree branch" --ckpt sd-v1-4.ckpt --init-img bird.png --strength 0.8It was far better than my initial drawing:

I hope readers understand and experiment.
Stable Diffusion UI
Developers love the command line, but regular users may struggle. Stable Diffusion UI projects simplify image generation and installation. Simple usage:
Unpack the ZIP after downloading it from https://github.com/cmdr2/stable-diffusion-ui/releases. Linux and Windows are compatible with Stable Diffusion UI (sorry for Mac users, but those machines are not well-suitable for heavy machine learning tasks anyway;).
Start the script.
Done. The web browser UI makes configuring various Stable Diffusion features (upscaling, filtering, etc.) easy:

V2.1 of Stable Diffusion
I noticed the notification about releasing version 2.1 while writing this essay, and it was intriguing to test it. First, compare version 2 to version 1:
alternative text encoding. The Contrastive LanguageImage Pre-training (CLIP) deep learning model, which was trained on a significant number of text-image pairs, is used in Stable Diffusion 1. The open-source CLIP implementation used in Stable Diffusion 2 is called OpenCLIP. It is difficult to determine whether there have been any technical advancements or if legal concerns were the main focus. However, because the training datasets for the two text encoders were different, the output results from V1 and V2 will differ for the identical text prompts.
a new depth model that may be used to the output of image-to-image generation.
a revolutionary upscaling technique that can quadruple the resolution of an image.
Generally higher resolution Stable Diffusion 2 has the ability to produce both 512x512 and 768x768 pictures.
The Hugging Face website offers a free online demo of Stable Diffusion 2.1 for code testing. The process is the same as for version 1.4. Download a fresh version and activate the environment:
conda deactivate
conda env remove -n ldm  # Use this if version 1 was previously installed
git clone https://github.com/Stability-AI/stablediffusion
cd stablediffusion
conda env create -f environment.yaml
conda activate ldm
Hugging Face offers a new weights ckpt file.
The Out of memory error prevented me from running this version on my 8 GB GPU. Version 2.1 fails on CPUs with the slow conv2d cpu not implemented for Half error (according to this GitHub issue, the CPU support for this algorithm and data type will not be added). The model can be modified from half to full precision (float16 instead of float32), however it doesn't make sense since v1 runs up to 10 minutes on the CPU and v2.1 should be much slower. The online demo results are visible. The same hamster painting with a brush prompt yielded this result:
It looks different from v1, but it functions and has a higher resolution.
The superresolution.py script can run the 4x Stable Diffusion upscaler locally (the x4-upscaler-ema.ckpt weights file should be in the same folder):
python3 scripts/gradio/superresolution.py configs/stable-diffusion/x4-upscaling.yaml x4-upscaler-ema.ckptThis code allows the web browser UI to select the image to upscale:

The copy-paste strategy may explain why the upscaler needs a text prompt (and the Hugging Face code snippet does not have any text input as well). I got a GPU out of memory error again, although CUDA can be disabled like v1. However, processing an image for more than two hours is unlikely:

Stable Diffusion Limitations
When we use the model, it's fun to see what it can and can't do. Generative models produce abstract visuals but not photorealistic ones. This fundamentally limits The generative neural network was trained on text and image pairs, but humans have a lot of background knowledge about the world. The neural network model knows nothing. If someone asks me to draw a Chinese text, I can draw something that looks like Chinese but is actually gibberish because I never learnt it. Generative AI does too! Humans can learn new languages, but the Stable Diffusion AI model includes only language and image decoder brain components. For instance, the Stable Diffusion model will pull NO WAR banner-bearers like this:
V1:
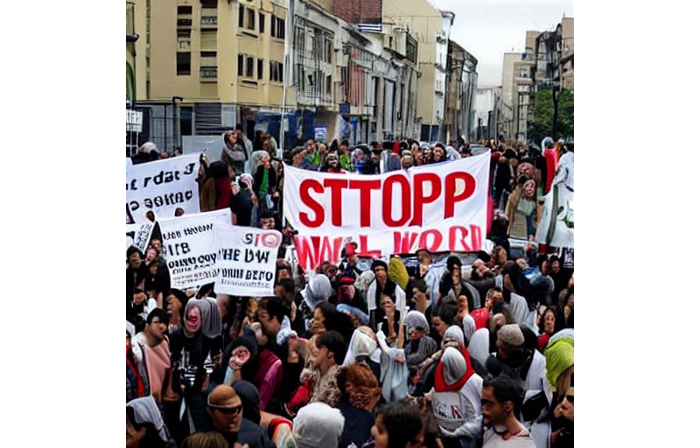
V2.1:
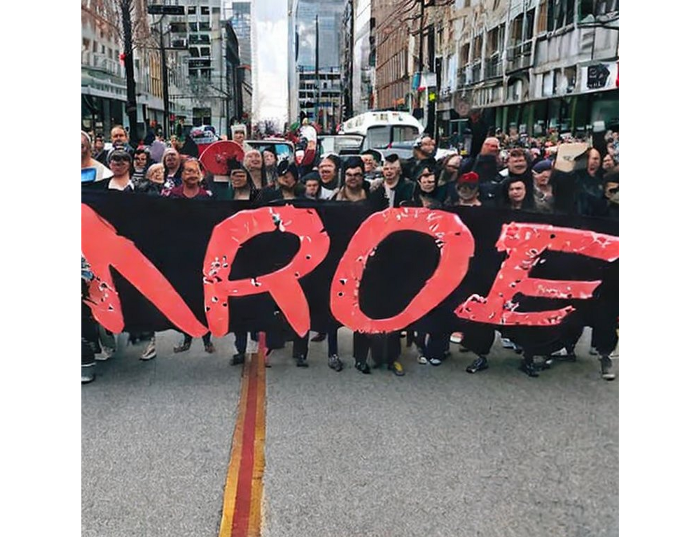
The shot shows text, although the model never learned to read or write. The model's string tokenizer automatically converts letters to lowercase before generating the image, so typing NO WAR banner or no war banner is the same.
I can also ask the model to draw a gorgeous woman:
V1:

V2.1:

The first image is gorgeous but physically incorrect. A second one is better, although it has an Uncanny valley feel. BTW, v2 has a lifehack to add a negative prompt and define what we don't want on the image. Readers might try adding horrible anatomy to the gorgeous woman request.
If we ask for a cartoon attractive woman, the results are nice, but accuracy doesn't matter:
V1:

V2.1:

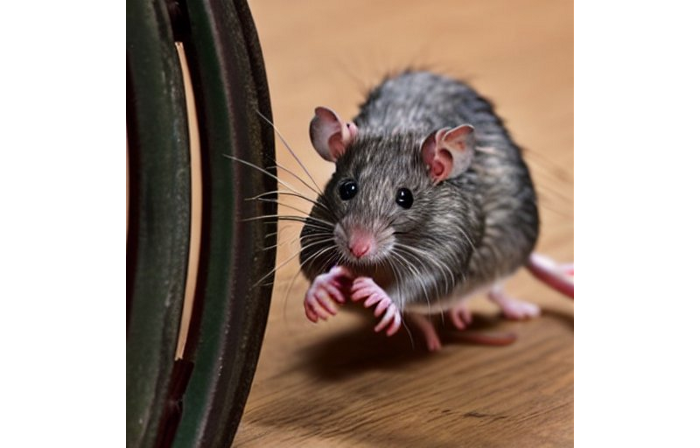
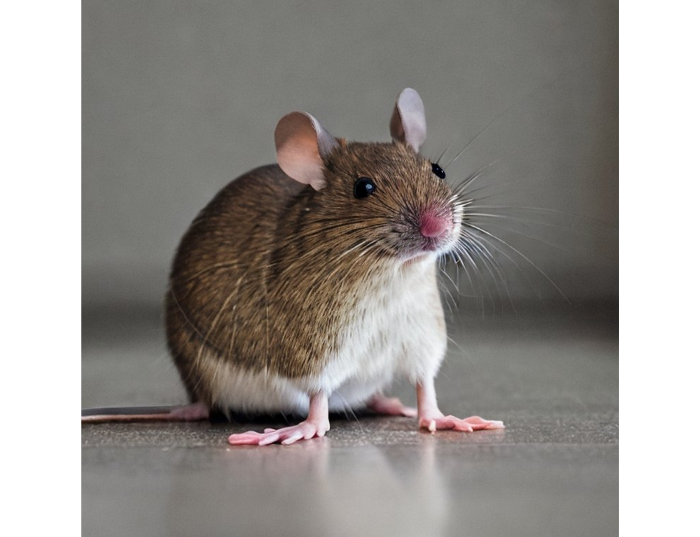
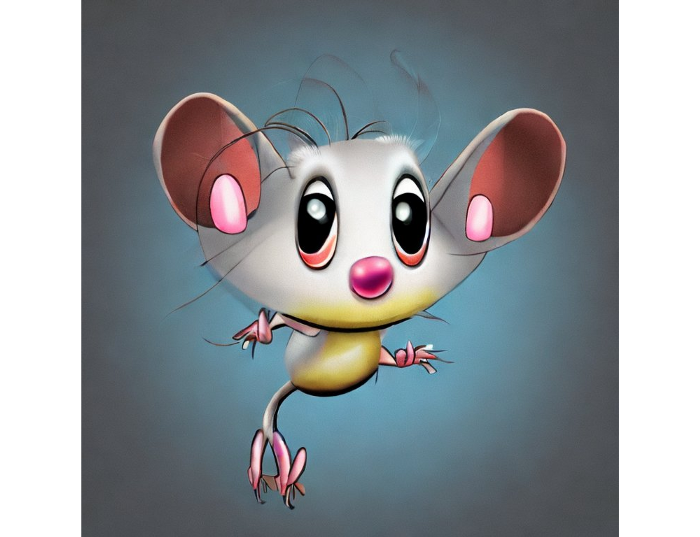
Another example: I ordered a model to sketch a mouse, which looks beautiful but has too many legs, ears, and fingers:
V1:
V2.1: improved but not perfect.
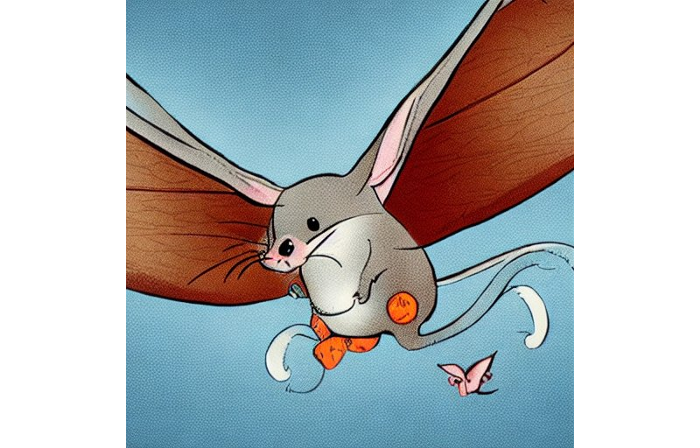
V1 produces a fun cartoon flying mouse if I want something more abstract:
I tried multiple times with V2.1 but only received this:
The image is OK, but the first version is closer to the request.
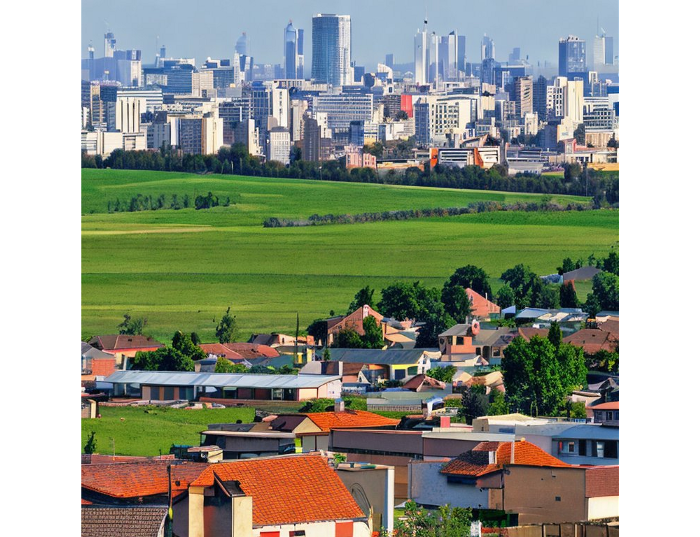
Stable Diffusion struggles to draw letters, fingers, etc. However, abstract images yield interesting outcomes. A rural landscape with a modern metropolis in the background turned out well:
V1:

V2.1:
Generative models help make paintings too (at least, abstract ones). I searched Google Image Search for modern art painting to see works by real artists, and this was the first image:
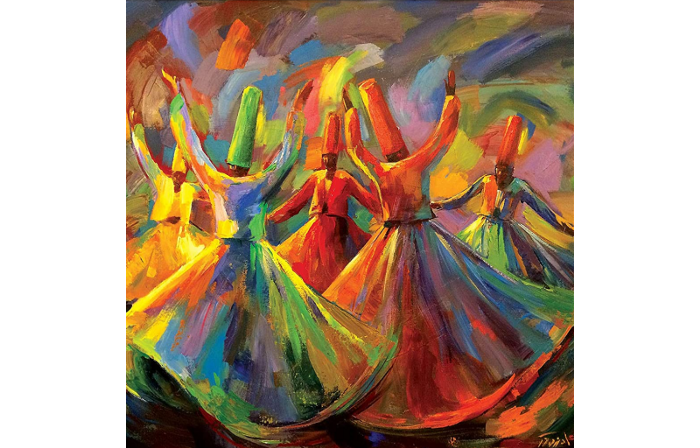
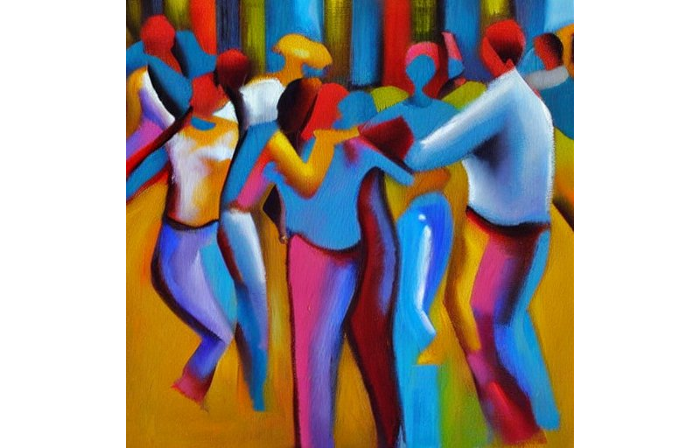
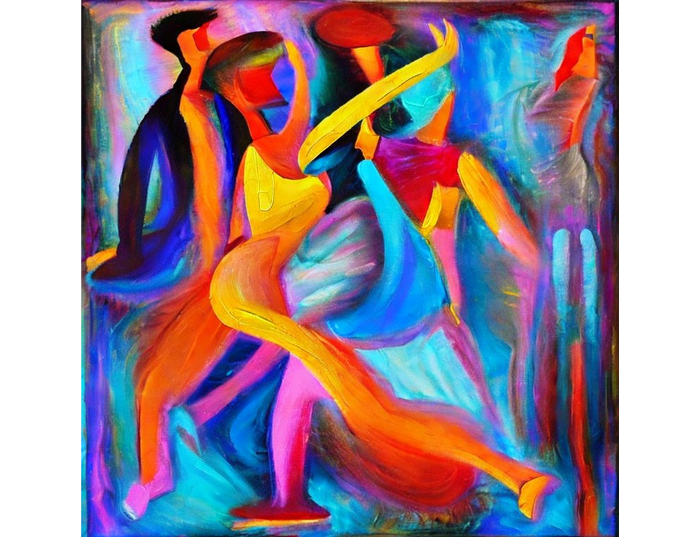
I typed "abstract oil painting of people dancing" and got this:
V1:
V2.1:
It's a different style, but I don't think the AI-generated graphics are worse than the human-drawn ones.
The AI model cannot think like humans. It thinks nothing. A stable diffusion model is a billion-parameter matrix trained on millions of text-image pairs. I input "robot is creating a picture with a pen" to create an image for this post. Humans understand requests immediately. I tried Stable Diffusion multiple times and got this:
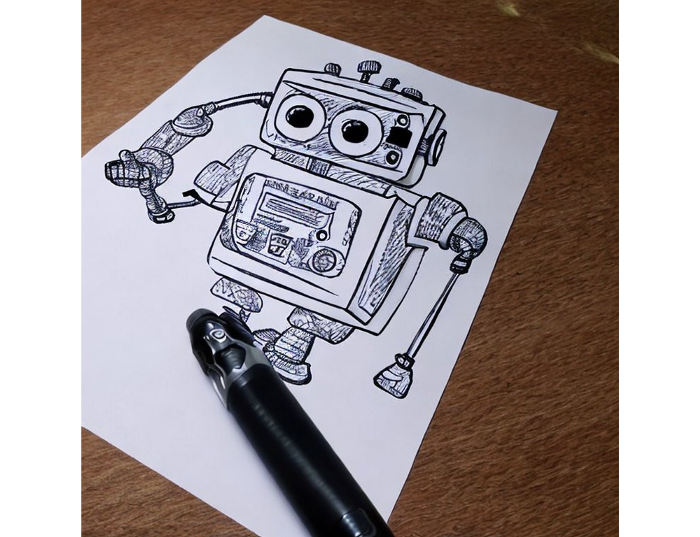
This great artwork has a pen, robot, and sketch, however it was not asked. Maybe it was because the tokenizer deleted is and a words from a statement, but I tried other requests such robot painting picture with pen without success. It's harder to prompt a model than a person.
I hope Stable Diffusion's general effects are evident. Despite its limitations, it can produce beautiful photographs in some settings. Readers who want to use Stable Diffusion results should be warned. Source code examination demonstrates that Stable Diffusion images feature a concealed watermark (text StableDiffusionV1 and SDV2) encoded using the invisible-watermark Python package. It's not a secret, because the official Stable Diffusion repository's test watermark.py file contains a decoding snippet. The put watermark line in the txt2img.py source code can be removed if desired. I didn't discover this watermark on photographs made by the online Hugging Face demo. Maybe I did something incorrectly (but maybe they are just not using the txt2img script on their backend at all).
Conclusion
The Stable Diffusion model was fascinating. As I mentioned before, trying something yourself is always better than taking someone else's word, so I encourage readers to do the same (including this article as well;).
Is Generative AI a game-changer? My humble experience tells me:
I think that place has a lot of potential. For designers and artists, generative AI can be a truly useful and innovative tool. Unfortunately, it can also pose a threat to some of them since if users can enter a text field to obtain a picture or a website logo in a matter of clicks, why would they pay more to a different party? Is it possible right now? unquestionably not yet. Images still have a very poor quality and are erroneous in minute details. And after viewing the image of the stunning woman above, models and fashion photographers may also unwind because it is highly unlikely that AI will replace them in the upcoming years.
Today, generative AI is still in its infancy. Even 768x768 images are considered to be of a high resolution when using neural networks, which are computationally highly expensive. There isn't an AI model that can generate high-resolution photographs natively without upscaling or other methods, at least not as of the time this article was written, but it will happen eventually.
It is still a challenge to accurately represent knowledge in neural networks (information like how many legs a cat has or the year Napoleon was born). Consequently, AI models struggle to create photorealistic photos, at least where little details are important (on the other side, when I searched Google for modern art paintings, the results are often even worse;).
When compared to the carefully chosen images from official web pages or YouTube reviews, the average output quality of a Stable Diffusion generation process is actually less attractive because to its high degree of randomness. When using the same technique on their own, consumers will theoretically only view those images as 1% of the results.
Anyway, it's exciting to witness this area's advancement, especially because the project is open source. Google's Imagen and DALL-E 2 can also produce remarkable findings. It will be interesting to see how they progress.