


More on Web3 & Crypto

Protos
3 years ago
StableGains lost $42M in Anchor Protocol.
StableGains lost millions of dollars in customer funds in Anchor Protocol without telling its users. The Anchor Protocol offered depositors 19-20% APY before its parent ecosystem, Terra LUNA, lost tens of billions of dollars in market capitalization as LUNA fell below $0.01 and its stablecoin (UST) collapsed.
A Terra Research Forum member raised the alarm. StableGains changed its homepage and Terms and Conditions to reflect how it mitigates risk, a tacit admission that it should have done so from the start.
StableGains raised $600,000 in YCombinator's W22 batch. Moonfire, Broom Ventures, and Goodwater Capital invested $3 million more.
StableGains' 15% yield product attracted $42 million in deposits. StableGains kept most of its deposits in Anchor's UST pool earning 19-20% APY, kept one-quarter of the interest as a management fee, and then gave customers their promised 15% APY. It lost almost all customer funds when UST melted down. It changed withdrawal times, hurting customers.
- StableGains said de-pegging was unlikely. According to its website, 1 UST can be bought and sold for $1 of LUNA. LUNA became worthless, and Terra shut down its blockchain.
- It promised to diversify assets across several stablecoins to reduce the risk of one losing its $1 peg, but instead kept almost all of them in one basket.
- StableGains promised withdrawals in three business days, even if a stablecoin needed time to regain its peg. StableGains uses Coinbase for deposits and withdrawals, and customers receive the exact amount of USDC requested.
StableGains scrubs its website squeaky clean
StableGains later edited its website to say it only uses the "most trusted and tested stablecoins" and extended withdrawal times from three days to indefinite time "in extreme cases."
Previously, USDC, TerraUST (UST), and Dai were used (DAI). StableGains changed UST-related website content after the meltdown. It also removed most references to DAI.
Customers noticed a new clause in the Terms and Conditions denying StableGains liability for withdrawal losses. This new clause would have required customers to agree not to sue before withdrawing funds, avoiding a class-action lawsuit.
Customers must sign a waiver to receive a refund.
Erickson Kramer & Osborne law firm has asked StableGains to preserve all internal documents on customer accounts, marketing, and TerraUSD communications. The firm has not yet filed a lawsuit.
Thousands of StableGains customers lost an estimated $42 million.
Celsius Network customers also affected
CEL used Terra LUNA's Anchor Protocol. Celsius users lost money in the crypto market crash and UST meltdown. Many held CEL and LUNA as yielding deposits.
CEO Alex Mashinsky accused "unknown malefactors" of targeting Celsius Network without evidence. Celsius has not publicly investigated this claim as of this article's publication.
CEL fell before UST de-pegged. On June 2, 2021, it reached $8.01. May 19's close: $0.82.
When some Celsius Network users threatened to leave over token losses, Mashinsky replied, "Leave if you don't think I'm sincere and working harder than you, seven days a week."
Celsius Network withdrew $500 million from Anchor Protocol, but smaller holders had trouble.
Read original article here

Ren & Heinrich
3 years ago
200 DeFi Projects were examined. Here is what I learned.
I analyze the top 200 DeFi crypto projects in this article.
This isn't a study. The findings benefit crypto investors.
Let’s go!
A set of data
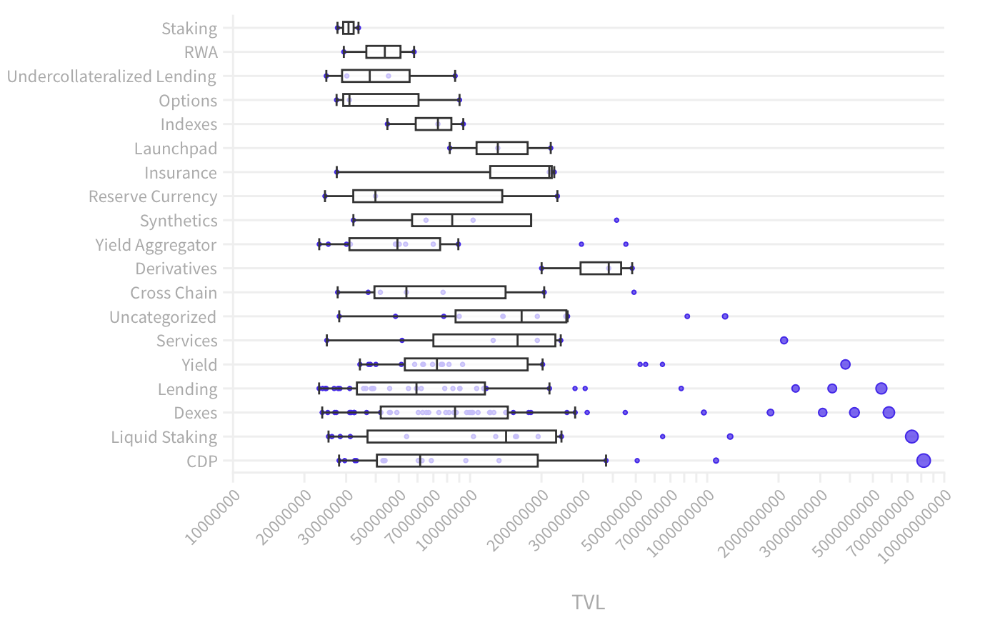
I analyzed data from defillama.com. In my analysis, I used the top 200 DeFis by TVL in October 2022.
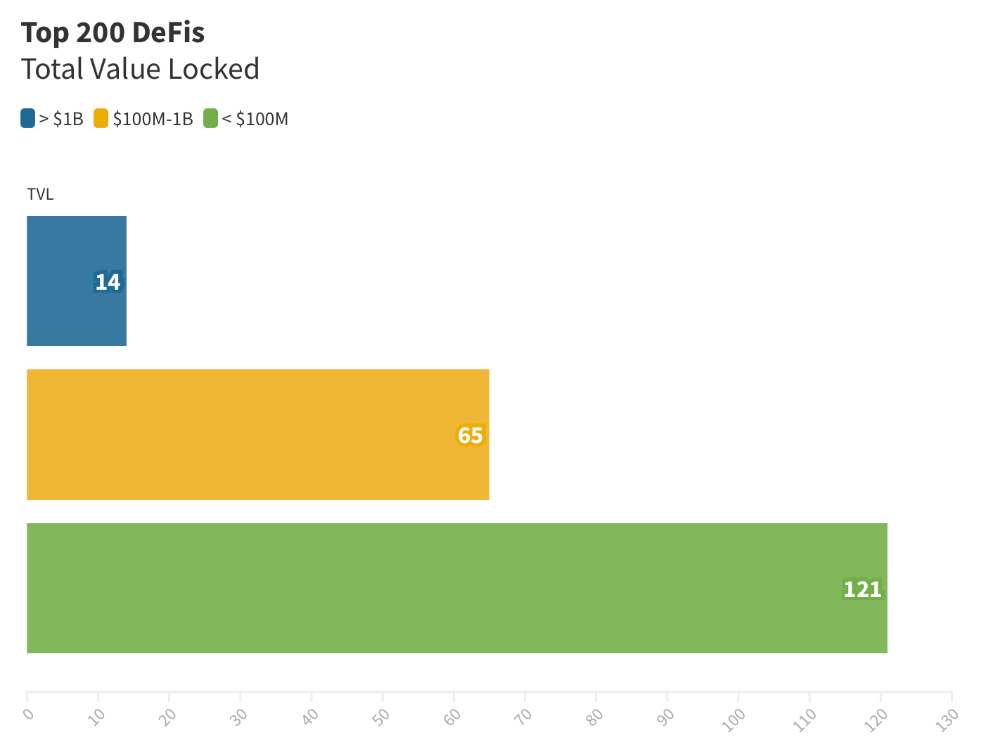
Total Locked Value
The chart below shows platform-specific locked value.
14 platforms had $1B+ TVL. 65 platforms have $100M-$1B TVL. The remaining 121 platforms had TVLs below $100 million, with the lowest being $23 million.
TVLs are distributed Pareto. Top 40% of DeFis account for 80% of TVLs.
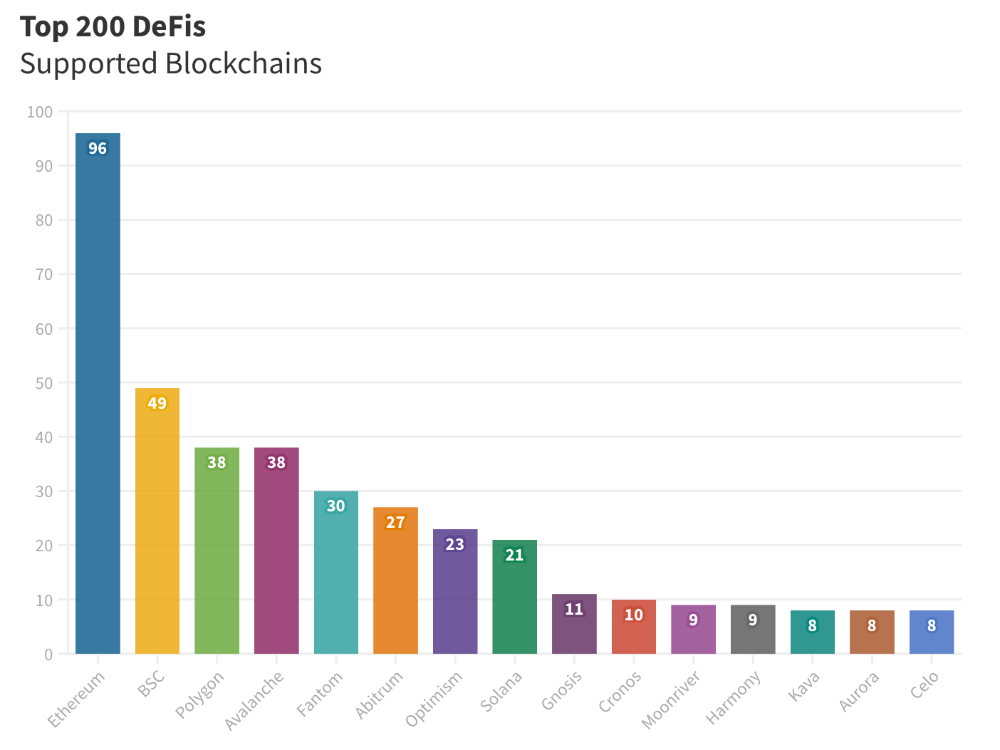
Compliant Blockchains
Ethereum's blockchain leads DeFi. 96 of the examined projects offer services on Ethereum. Behind BSC, Polygon, and Avalanche.
Five platforms used 10+ blockchains. 36 between 2-10 159 used 1 blockchain.
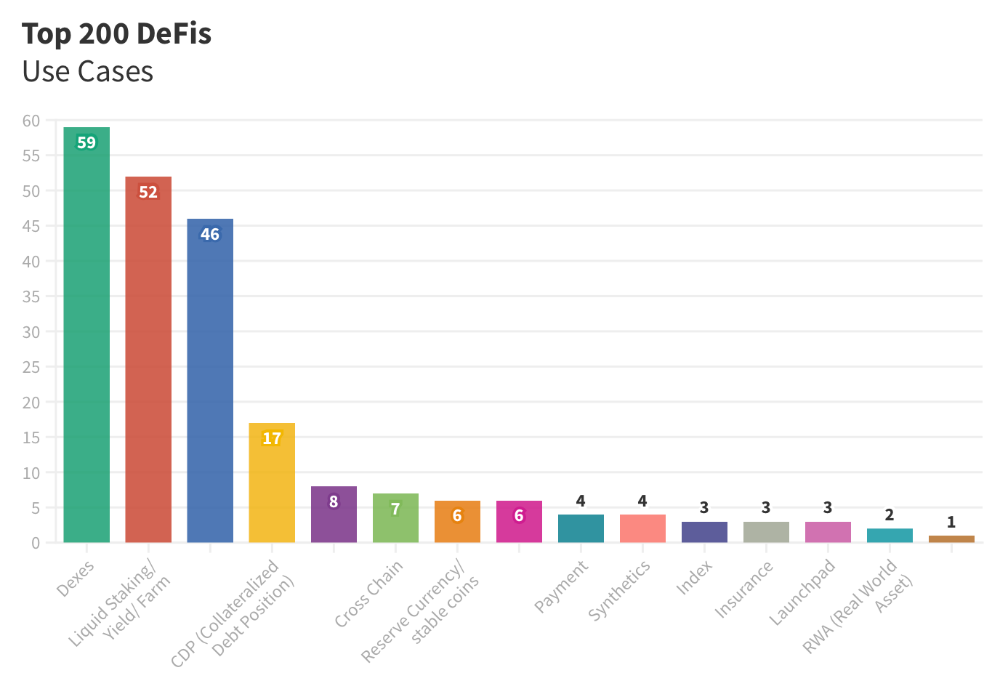
Use Cases for DeFi
The chart below shows platform use cases. Each platform has decentralized exchanges, liquid staking, yield farming, and lending.
These use cases are DefiLlama's main platform features.
Which use case costs the most? Chart explains. Collateralized debt, liquid staking, dexes, and lending have high TVLs.
The DeFi Industry
I compared three high-TVL platforms (Maker DAO, Balancer, AAVE). The columns show monthly TVL and token price changes. The graph shows monthly Bitcoin price changes.
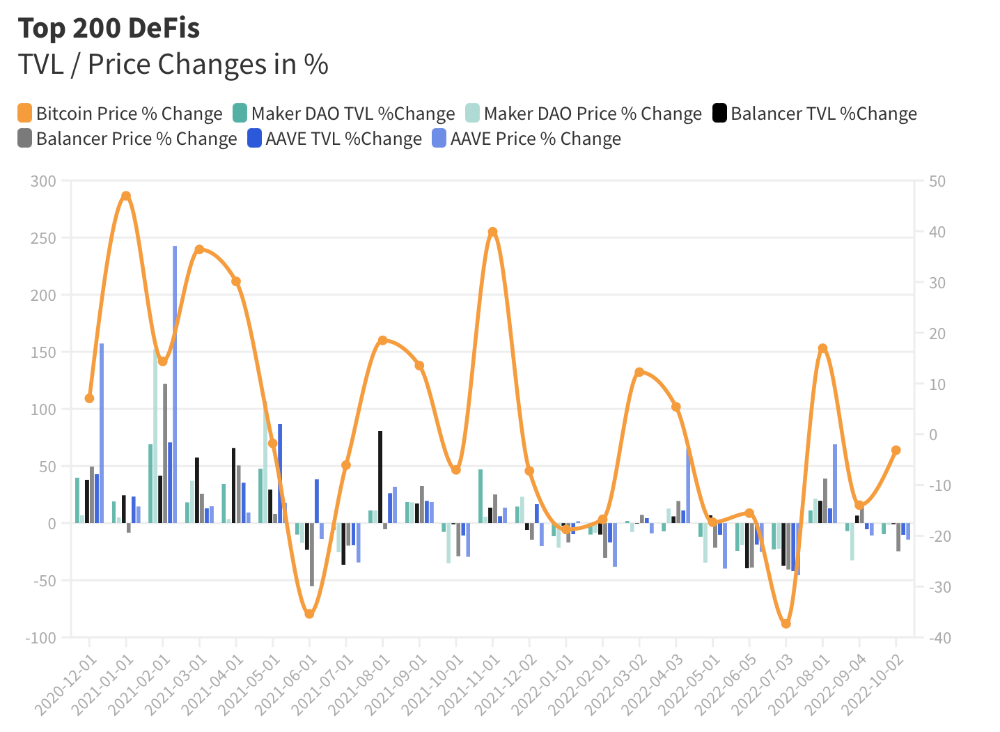
Each platform's market moves similarly.
Probably because most DeFi deposits are cryptocurrencies. Since individual currencies are highly correlated with Bitcoin, it's not surprising that they move in unison.
Takeaways
This analysis shows that the most common DeFi services (decentralized exchanges, liquid staking, yield farming, and lending) also have the highest average locked value.
Some projects run on one or two blockchains, while others use 15 or 20. Our analysis shows that a project's blockchain count has no correlation with its success.
It's hard to tell if certain use cases are rising. Bitcoin's price heavily affects the entire DeFi market.
TVL seems to be a good indicator of a DeFi platform's success and quality. Higher TVL platforms are cheaper. They're a better long-term investment because they gain or lose less value than DeFis with lower TVLs.

CNET
4 years ago
How a $300K Bored Ape Yacht Club NFT was accidentally sold for $3K
The Bored Ape Yacht Club is one of the most prestigious NFT collections in the world. A collection of 10,000 NFTs, each depicting an ape with different traits and visual attributes, Jimmy Fallon, Steph Curry and Post Malone are among their star-studded owners. Right now the price of entry is 52 ether, or $210,000.
Which is why it's so painful to see that someone accidentally sold their Bored Ape NFT for $3,066.
Unusual trades are often a sign of funny business, as in the case of the person who spent $530 million to buy an NFT from themselves. In Saturday's case, the cause was a simple, devastating "fat-finger error." That's when people make a trade online for the wrong thing, or for the wrong amount. Here the owner, real name Max or username maxnaut, meant to list his Bored Ape for 75 ether, or around $300,000. Instead he accidentally listed it for 0.75. One hundredth the intended price.
It was bought instantaneously. The buyer paid an extra $34,000 to speed up the transaction, ensuring no one could snap it up before them. The Bored Ape was then promptly listed for $248,000. The transaction appears to have been done by a bot, which can be coded to immediately buy NFTs listed below a certain price on behalf of their owners in order to take advantage of these exact situations.
"How'd it happen? A lapse of concentration I guess," Max told me. "I list a lot of items every day and just wasn't paying attention properly. I instantly saw the error as my finger clicked the mouse but a bot sent a transaction with over 8 eth [$34,000] of gas fees so it was instantly sniped before I could click cancel, and just like that, $250k was gone."
"And here within the beauty of the Blockchain you can see that it is both honest and unforgiving," he added.
Fat finger trades happen sporadically in traditional finance -- like the Japanese trader who almost bought 57% of Toyota's stock in 2014 -- but most financial institutions will stop those transactions if alerted quickly enough. Since cryptocurrency and NFTs are designed to be decentralized, you essentially have to rely on the goodwill of the buyer to reverse the transaction.
Fat finger errors in cryptocurrency trades have made many a headline over the past few years. Back in 2019, the company behind Tether, a cryptocurrency pegged to the US dollar, nearly doubled its own coin supply when it accidentally created $5 billion-worth of new coins. In March, BlockFi meant to send 700 Gemini Dollars to a set of customers, worth roughly $1 each, but mistakenly sent out millions of dollars worth of bitcoin instead. Last month a company erroneously paid a $24 million fee on a $100,000 transaction.
Similar incidents are increasingly being seen in NFTs, now that many collections have accumulated in market value over the past year. Last month someone tried selling a CryptoPunk NFT for $19 million, but accidentally listed it for $19,000 instead. Back in August, someone fat finger listed their Bored Ape for $26,000, an error that someone else immediately capitalized on. The original owner offered $50,000 to the buyer to return the Bored Ape -- but instead the opportunistic buyer sold it for the then-market price of $150,000.
"The industry is so new, bad things are going to happen whether it's your fault or the tech," Max said. "Once you no longer have control of the outcome, forget and move on."
The Bored Ape Yacht Club launched back in April 2021, with 10,000 NFTs being sold for 0.08 ether each -- about $190 at the time. While NFTs are often associated with individual digital art pieces, collections like the Bored Ape Yacht Club, which allow owners to flaunt their NFTs by using them as profile pictures on social media, are becoming increasingly prevalent. The Bored Ape Yacht Club has since become the second biggest NFT collection in the world, second only to CryptoPunks, which launched in 2017 and is considered the "original" NFT collection.
You might also like

The woman
3 years ago
The renowned and highest-paid Google software engineer
His story will inspire you.
“Google search went down for a few hours in 2002; Jeff Dean handled all the queries by hand and checked quality doubled.”- Jeff Dean Facts.
One of many Jeff Dean jokes, but you get the idea.
Google's top six engineers met in a war room in mid-2000. Google's crawling system, which indexed the Web, stopped working. Users could still enter queries, but results were five months old.
Google just signed a deal with Yahoo to power a ten-times-larger search engine. Tension rose. It was crucial. If they failed, the Yahoo agreement would likely fall through, risking bankruptcy for the firm. Their efforts could be lost.
A rangy, tall, energetic thirty-one-year-old man named Jeff dean was among those six brilliant engineers in the makeshift room. He had just left D. E. C. a couple of months ago and started his career in a relatively new firm Google, which was about to change the world. He rolled his chair over his colleague Sanjay and sat right next to him, cajoling his code like a movie director. The history started from there.
When you think of people who shaped the World Wide Web, you probably picture founders and CEOs like Larry Page and Sergey Brin, Marc Andreesen, Tim Berners-Lee, Bill Gates, and Mark Zuckerberg. They’re undoubtedly the brightest people on earth.
Under these giants, legions of anonymous coders work at keyboards to create the systems and products we use. These computer workers are irreplaceable.
Let's get to know him better.
It's possible you've never heard of Jeff Dean. He's American. Dean created many behind-the-scenes Google products. Jeff, co-founder and head of Google's deep learning research engineering team, is a popular technology, innovation, and AI keynote speaker.
While earning an MS and Ph.D. in computer science at the University of Washington, he was a teaching assistant, instructor, and research assistant. Dean joined the Compaq Computer Corporation Western Research Laboratory research team after graduating.
Jeff co-created ProfileMe and the Continuous Profiling Infrastructure for Digital at Compaq. He co-designed and implemented Swift, one of the fastest Java implementations. He was a senior technical staff member at mySimon Inc., retrieving and caching electronic commerce content.
Dean, a top young computer scientist, joined Google in mid-1999. He was always trying to maximize a computer's potential as a child.
An expert
His high school program for processing massive epidemiological data was 26 times faster than professionals'. Epi Info, in 13 languages, is used by the CDC. He worked on compilers as a computer science Ph.D. These apps make source code computer-readable.
Dean never wanted to work on compilers forever. He left Academia for Google, which had less than 20 employees. Dean helped found Google News and AdSense, which transformed the internet economy. He then addressed Google's biggest issue, scaling.
Growing Google faced a huge computing challenge. They developed PageRank in the late 1990s to return the most relevant search results. Google's popularity slowed machine deployment.
Dean solved problems, his specialty. He and fellow great programmer Sanjay Ghemawat created the Google File System, which distributed large data over thousands of cheap machines.
These two also created MapReduce, which let programmers handle massive data quantities on parallel machines. They could also add calculations to the search algorithm. A 2004 research article explained MapReduce, which became an industry sensation.
Several revolutionary inventions
Dean's other initiatives were also game-changers. BigTable, a petabyte-capable distributed data storage system, was based on Google File. The first global database, Spanner, stores data on millions of servers in dozens of data centers worldwide.
It underpins Gmail and AdWords. Google Translate co-founder Jeff Dean is surprising. He contributes heavily to Google News. Dean is Senior Fellow of Google Research and Health and leads Google AI.
Recognitions
The National Academy of Engineering elected Dean in 2009. He received the 2009 Association for Computing Machinery fellowship and the 2016 American Academy of Arts and Science fellowship. He received the 2007 ACM-SIGOPS Mark Weiser Award and the 2012 ACM-Infosys Foundation Award. Lists could continue.
A sneaky question may arrive in your mind: How much does this big brain earn? Well, most believe he is one of the highest-paid employees at Google. According to a survey, he is paid $3 million a year.
He makes espresso and chats with a small group of Googlers most mornings. Dean steams milk, another grinds, and another brews espresso. They discuss families and technology while making coffee. He thinks this little collaboration and idea-sharing keeps Google going.
“Some of us have been working together for more than 15 years,” Dean said. “We estimate that we’ve collectively made more than 20,000 cappuccinos together.”
We all know great developers and software engineers. It may inspire many.
Benjamin Lin
3 years ago
I sold my side project for $20,000: 6 lessons I learned
How I monetized and sold an abandoned side project for $20,000

The Origin Story
I've always wanted to be an entrepreneur but never succeeded. I often had business ideas, made a landing page, and told my buddies. Never got customers.
In April 2021, I decided to try again with a new strategy. I noticed that I had trouble acquiring an initial set of customers, so I wanted to start by acquiring a product that had a small user base that I could grow.
I found a SaaS marketplace called MicroAcquire.com where you could buy and sell SaaS products. I liked Shareit.video, an online Loom-like screen recorder.
Shareit.video didn't generate revenue, but 50 people visited daily to record screencasts.
Purchasing a Failed Side Project
I eventually bought Shareit.video for $12,000 from its owner.
$12,000 was probably too much for a website without revenue or registered users.
I thought time was most important. I could have recreated the website, but it would take months. $12,000 would give me an organized code base and a working product with a few users to monetize.
I considered buying a screen recording website and trying to grow it versus buying a new car or investing in crypto with the $12K.
Buying the website would make me a real entrepreneur, which I wanted more than anything.
Putting down so much money would force me to commit to the project and prevent me from quitting too soon.
A Year of Development
I rebranded the website to be called RecordJoy and worked on it with my cousin for about a year. Within a year, we made $5000 and had 3000 users.
We spent $3500 on ads, hosting, and software to run the business.
AppSumo promoted our $120 Life Time Deal in exchange for 30% of the revenue.
We put RecordJoy on maintenance mode after 6 months because we couldn't find a scalable user acquisition channel.
We improved SEO and redesigned our landing page, but nothing worked.

Despite not being able to grow RecordJoy any further, I had already learned so much from working on the project so I was fine with putting it on maintenance mode. RecordJoy still made $500 a month, which was great lunch money.
Getting Taken Over
One of our customers emailed me asking for some feature requests and I replied that we weren’t going to add any more features in the near future. They asked if we'd sell.
We got on a call with the customer and I asked if he would be interested in buying RecordJoy for 15k. The customer wanted around $8k but would consider it.
Since we were negotiating with one buyer, we put RecordJoy on MicroAcquire to see if there were other offers.
We quickly received 10+ offers. We got 18.5k. There was also about $1000 in AppSumo that we could not withdraw, so we agreed to transfer that over for $600 since about 40% of our sales on AppSumo usually end up being refunded.
Lessons Learned
First, create an acquisition channel
We couldn't discover a scalable acquisition route for RecordJoy. If I had to start another project, I'd develop a robust acquisition channel first. It might be LinkedIn, Medium, or YouTube.
Purchase Power of the Buyer Affects Acquisition Price
Some of the buyers we spoke to were individuals looking to buy side projects, as well as companies looking to launch a new product category. Individual buyers had less budgets than organizations.
Customers of AppSumo vary.
AppSumo customers value lifetime deals and low prices, which may not be a good way to build a business with recurring revenue. Designed for AppSumo users, your product may not connect with other users.
Try to increase acquisition trust
Acquisition often fails. The buyer can go cold feet, cease communicating, or run away with your stuff. Trusting the buyer ensures a smooth asset exchange. First acquisition meeting was unpleasant and price negotiation was tight. In later meetings, we spent the first few minutes trying to get to know the buyer’s motivations and background before jumping into the negotiation, which helped build trust.
Operating expenses can reduce your earnings.
Monitor operating costs. We were really happy when we withdrew the $5000 we made from AppSumo and Stripe until we realized that we had spent $3500 in operating fees. Spend money on software and consultants to help you understand what to build.
Don't overspend on advertising
We invested $1500 on Google Ads but made little money. For a side project, it’s better to focus on organic traffic from SEO rather than paid ads unless you know your ads are going to have a positive ROI.

Owolabi Judah
3 years ago
How much did YouTube pay for 10 million views?
Ali's $1,054,053.74 YouTube Adsense haul.
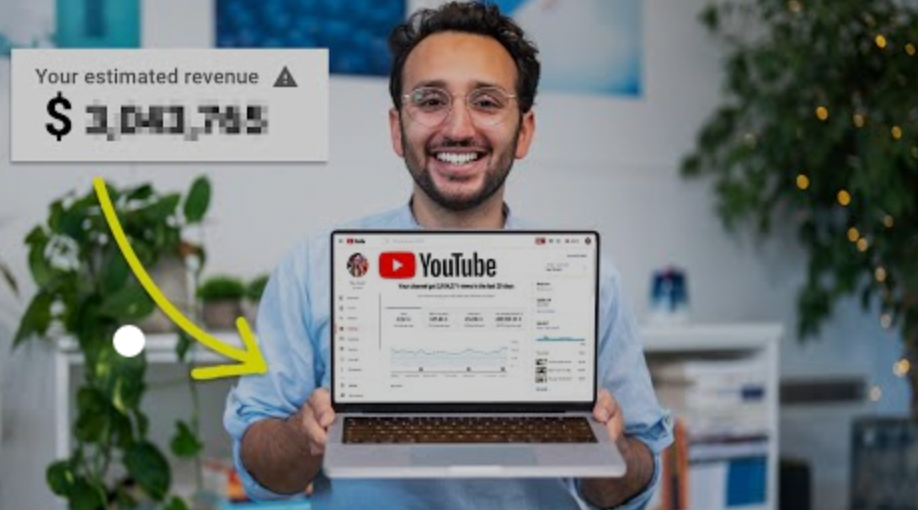
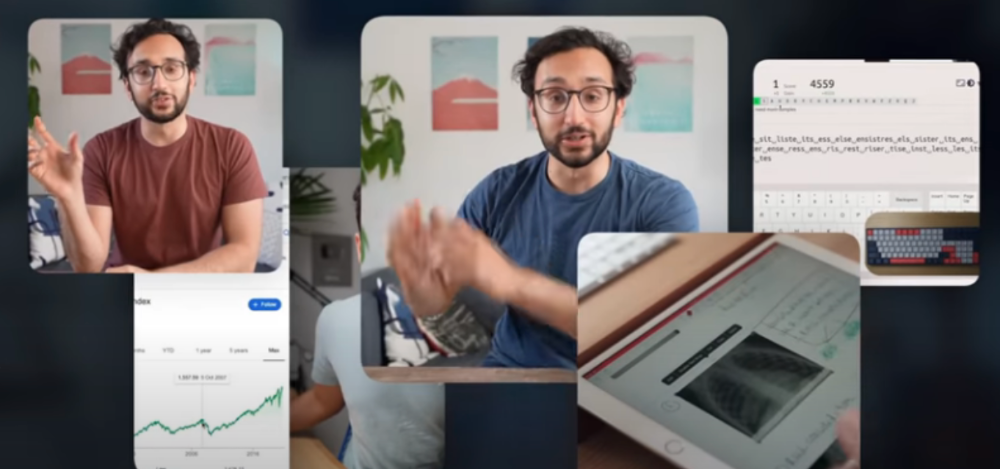
YouTuber, entrepreneur, and former doctor Ali Abdaal. He began filming productivity and financial videos in 2017. Ali Abdaal has 3 million YouTube subscribers and has crossed $1 million in AdSense revenue. Crazy, no?
Ali will share the revenue of his top 5 youtube videos, things he's learned that you can apply to your side hustle, and how many views it takes to make a livelihood off youtube.
First, "The Long Game."
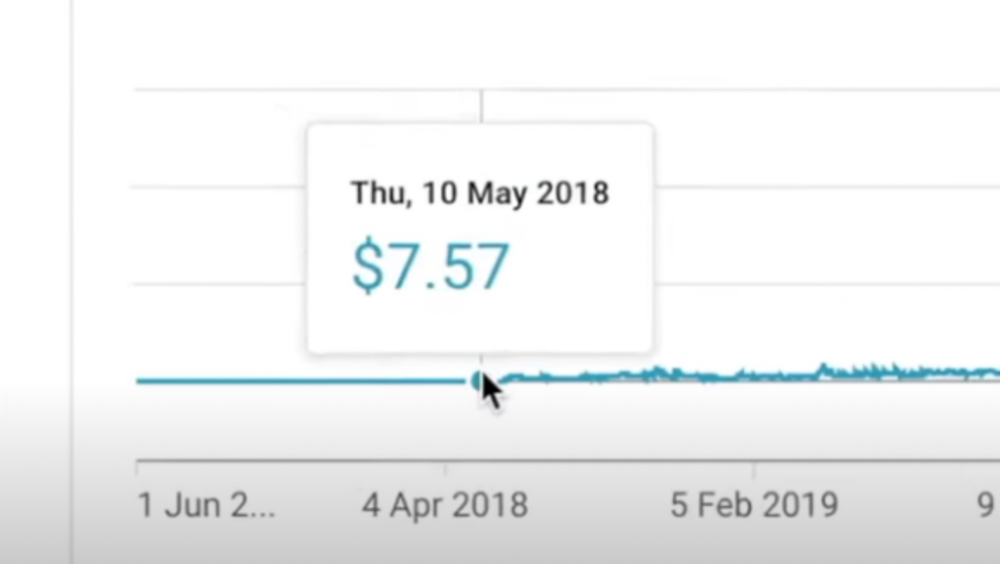
All good things take time to bear fruit. Compounding improves everything. Long-term work yields better returns. Ali made his first dollar after nine months and 85 videos.
Second, "One piece of content can transform your life, but you never know which one."
Had he abandoned YouTube at 84 videos without making any money, he wouldn't have filmed the 85th video that altered everything.
Third Lesson: Your Industry Choice Can Multiply.
The industry or niche you target as a business owner or side hustler can have a major impact on how much money you make.
Here are the top 5 videos.
1) 9.8m views: $191,258.16 for 9 passive income ideas
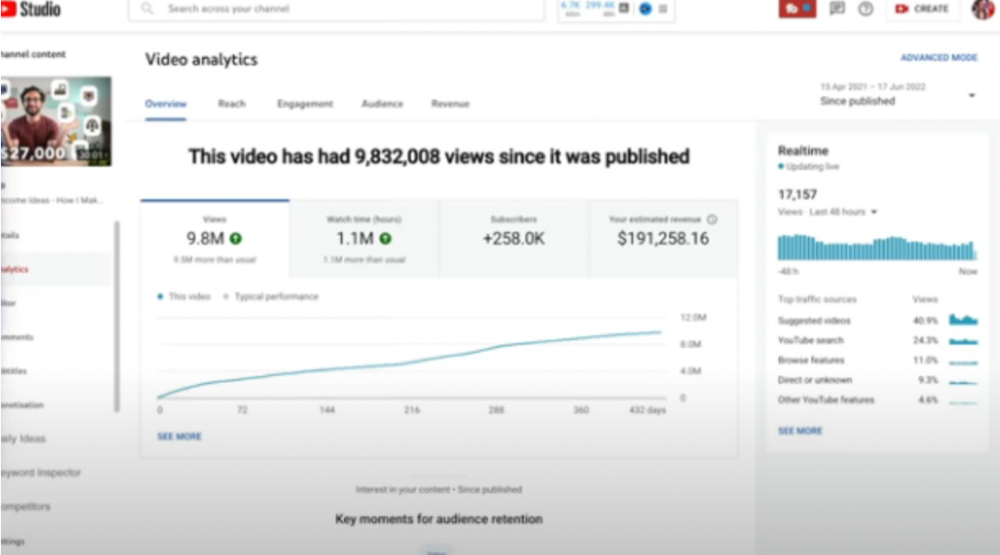
Ali made 2 points.
We should consider YouTube videos digital assets. They're investments, which make us money. His investments are yielding passive income.
Investing extra time and effort in your films can pay off.
2) How to Invest for Beginners — 5.2m Views: $87,200.08.
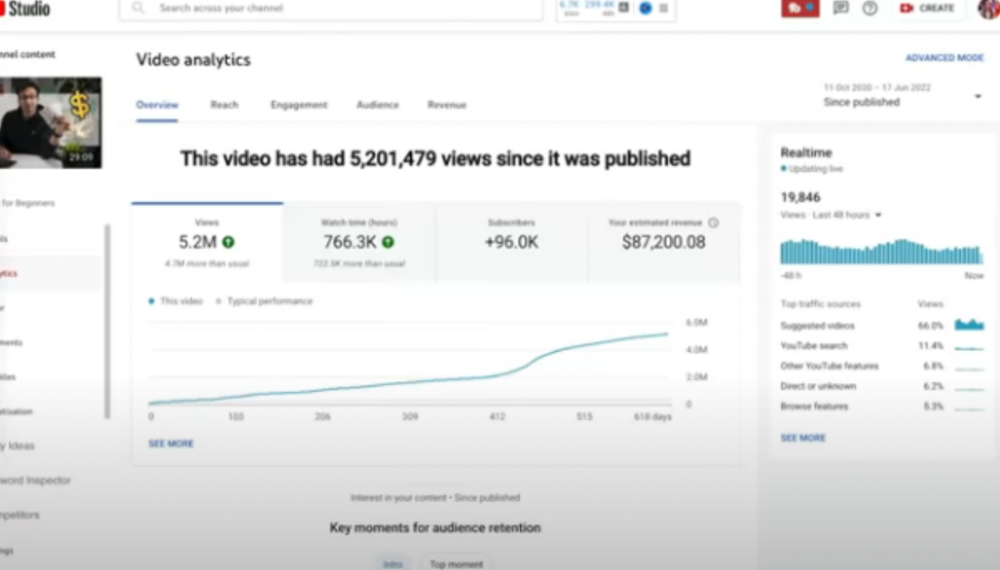
This video did poorly in the first several weeks after it was published; it was his tenth poorest performer. Don't worry about things you can't control. This applies to life, not just YouTube videos.
He stated we constantly have anxieties, fears, and concerns about things outside our control, but if we can find that line, life is easier and more pleasurable.
3) How to Build a Website in 2022— 866.3k views: $42,132.72.
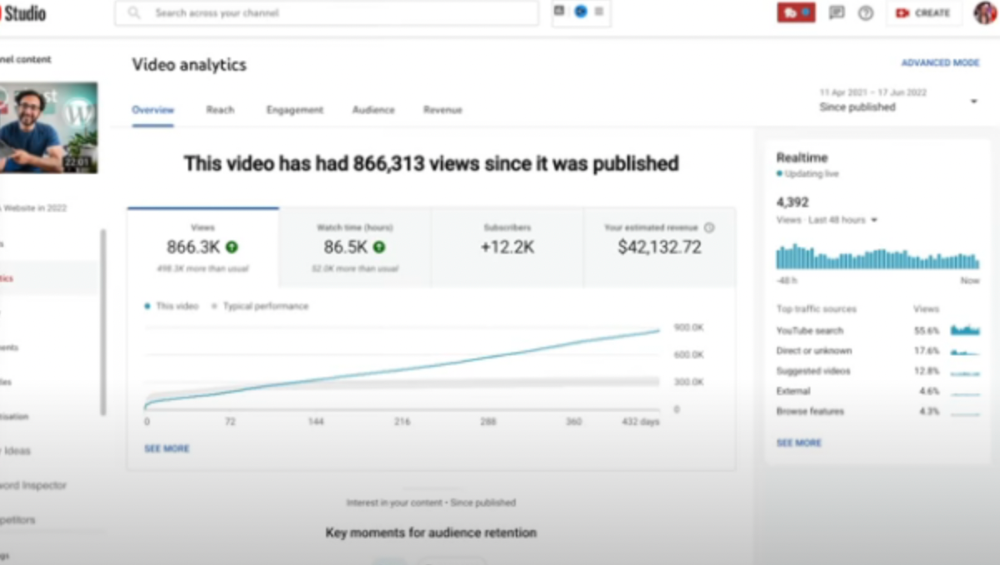
The RPM was $48.86 per thousand views, making it his highest-earning video. Squarespace, Wix, and other website builders are trying to put ads on it and competing against one other, so ad rates go up.
Because it was beyond his niche, Ali almost didn't make the video. He made the video because he wanted to help at least one person.
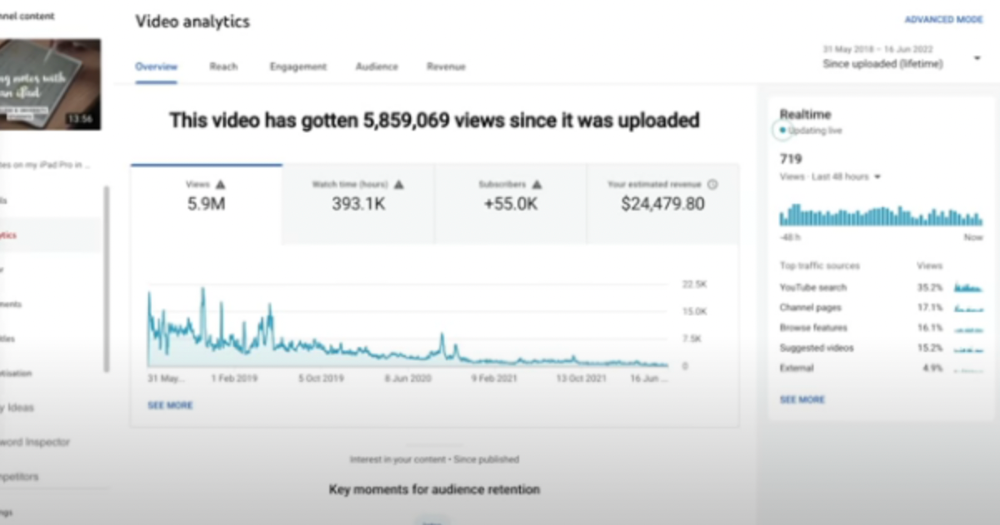
4) How I take notes on my iPad in medical school — 5.9m views: $24,479.80

85th video. It's the video that affected Ali's YouTube channel and his life the most. The video's success wasn't certain.
5) How I Type Fast 156 Words Per Minute — 8.2M views: $25,143.17
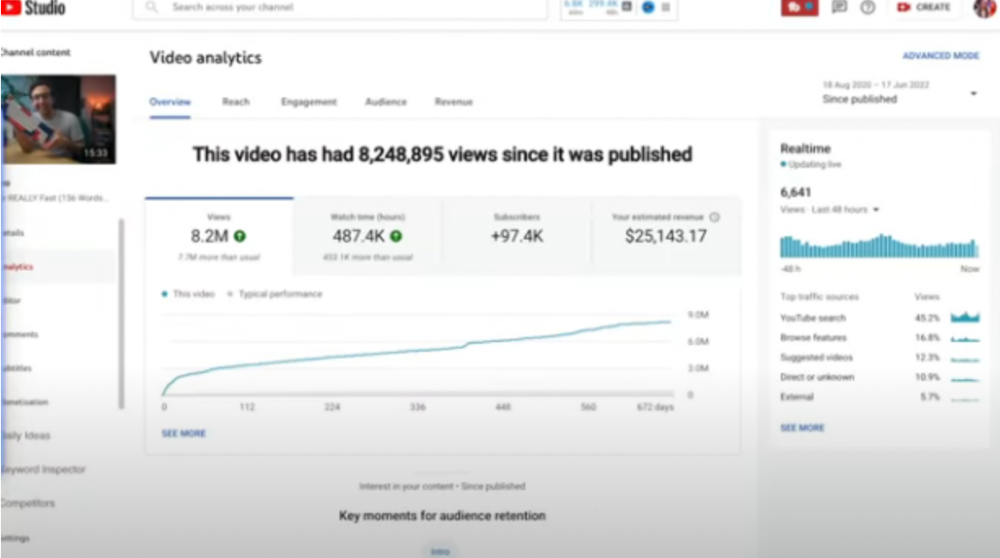
Ali didn't know this video would perform well; he made it because he can type fast and has been practicing for 10 years. So he made a video with his best advice.
How many views to different wealth levels?
It depends on geography, niche, and other monetization sources. To keep things simple, he would solely utilize AdSense.
How many views to generate money?
To generate money on Youtube, you need 1,000 subscribers and 4,000 hours of view time. How much work do you need to make pocket money?
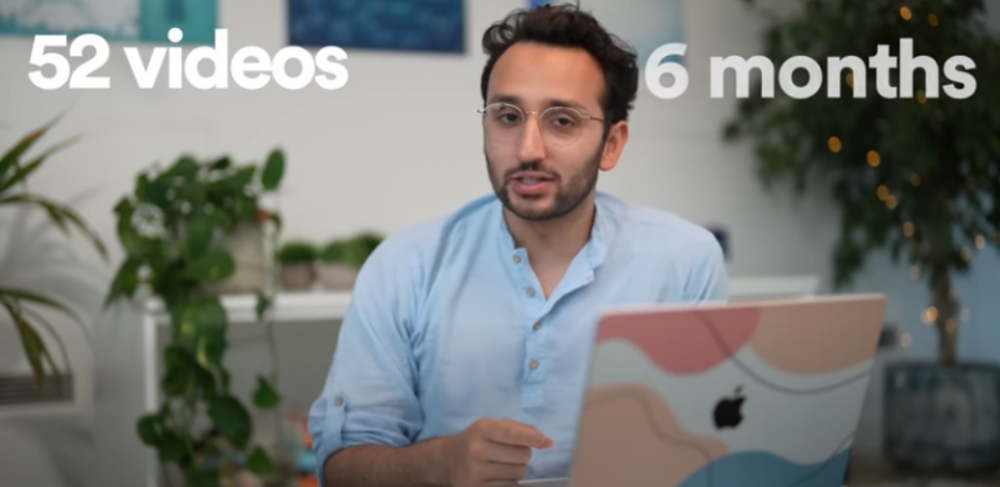
Ali's first 1,000 subscribers took 52 videos and 6 months. The typical channel with 1,000 subscribers contains 152 videos, according to Tubebuddy. It's time-consuming.
After monetizing, you'll need 15,000 views/month to make $5-$10/day.
How many views to go part-time?
Say you make $35,000/year at your day job. If you work 5 days/week, you make $7,000/year each day. If you want to drop down from 5 days to 4 days/week, you need to make an extra $7,000/year from YouTube, or $600/month.
What's the quit-your-job budget?

Silicon Valley Girl is in a highly successful niche targeting tech-focused folks in the west. When her channel had 500k views/month, she made roughly $3,000/month or $47,000/year, enough to quit your work.
Marina has another 1.5m subscriber channel in Russia, which has a lower rpm because fewer corporations advertise there than in the west. 2.3 million views/month is $4,000/month or $50,000/year, enough to quit your employment.
Marina is an intriguing example because she has three YouTube channels with the same skills, but one is 16x more profitable due to the niche she chose.
In Ali's case, he made 100+ videos when his channel was producing enough money to quit his job, roughly $4,000/month.
How many views make you rich?

Depending on how you define rich. Ali felt prosperous with over $100,000/year and 3–5m views/month.
Conclusion
YouTubers and artists don't treat their work like a company, which is a mistake. Businesses have been attempting to figure this out for decades, if not centuries.
We can learn from the business world how to monetize YouTube, Instagram, and Tiktok and make them into sustainable enterprises where we can hire people and delegate tasks.
Bonus
Watch Ali's video explaining all this:
This post is a summary. Read the full article here