


More on Productivity

Recep İnanç
3 years ago
Effective Technical Book Reading Techniques

Technical books aren't like novels. We need a new approach to technical texts. I've spent years looking for a decent reading method. I tried numerous ways before finding one that worked. This post explains how I read technical books efficiently.
What Do I Mean When I Say Effective?
Effectiveness depends on the book. Effective implies I know where to find answers after reading a reference book. Effective implies I learned the book's knowledge after reading it.
I use reference books as tools in my toolkit. I won't carry all my tools; I'll merely need them. Non-reference books teach me techniques. I never have to make an effort to use them since I always have them.
Reference books I like:
Design Patterns: Elements of Reusable Object-Oriented Software
Refactoring: Improving the Design of Existing Code
You can also check My Top Takeaways from Refactoring here.
Non-reference books I like:
The Approach
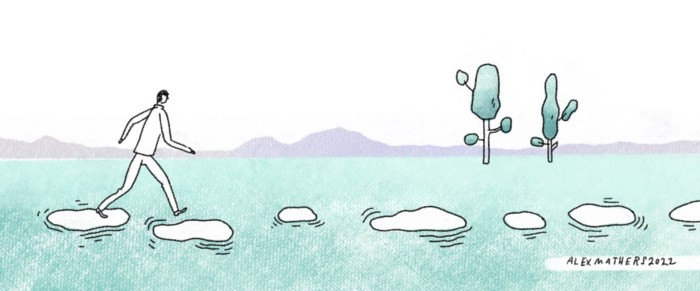
Technical books might be overwhelming to read in one sitting. Especially when you have no idea what is coming next as you read. When you don't know how deep the rabbit hole goes, you feel lost as you read. This is my years-long method for overcoming this difficulty.
Whether you follow the step-by-step guide or not, remember these:
Understand the terminology. Make sure you get the meaning of any terms you come across more than once. The likelihood that a term will be significant increases as you encounter it more frequently.
Know when to stop. I've always believed that in order to truly comprehend something, I must delve as deeply as possible into it. That, however, is not usually very effective. There are moments when you have to draw the line and start putting theory into practice (if applicable).
Look over your notes. When reading technical books or documents, taking notes is a crucial habit to develop. Additionally, you must regularly examine your notes if you want to get the most out of them. This will assist you in internalizing the lessons you acquired from the book. And you'll see that the urge to review reduces with time.
Let's talk about how I read a technical book step by step.
0. Read the Foreword/Preface
These sections are crucial in technical books. They answer Who should read it, What each chapter discusses, and sometimes How to Read? This is helpful before reading the book. Who could know the ideal way to read the book better than the author, right?
1. Scanning
I scan the chapter. Fast scanning is needed.
I review the headings.
I scan the pictures quickly.
I assess the chapter's length to determine whether I might divide it into more manageable sections.
2. Skimming
Skimming is faster than reading but slower than scanning.
I focus more on the captions and subtitles for the photographs.
I read each paragraph's opening and closing sentences.
I examined the code samples.
I attempt to grasp each section's basic points without getting bogged down in the specifics.
Throughout the entire reading period, I make an effort to make mental notes of what may require additional attention and what may not. Because I don't want to spend time taking physical notes, kindly notice that I am using the term "mental" here. It is much simpler to recall. You may think that this is more significant than typing or writing “Pay attention to X.”
I move on quickly. This is something I considered crucial because, when trying to skim, it is simple to start reading the entire thing.
3. Complete reading
Previous steps pay off.
I finished reading the chapter.
I concentrate on the passages that I mentally underlined when skimming.
I put the book away and make my own notes. It is typically more difficult than it seems for me. But it's important to speak in your own words. You must choose the right words to adequately summarize what you have read. How do those words make you feel? Additionally, you must be able to summarize your notes while you are taking them. Sometimes as I'm writing my notes, I realize I have no words to convey what I'm thinking or, even worse, I start to doubt what I'm writing down. This is a good indication that I haven't internalized that idea thoroughly enough.
I jot my inquiries down. Normally, I read on while compiling my questions in the hopes that I will learn the answers as I read. I'll explore those issues more if I wasn't able to find the answers to my inquiries while reading the book.
Bonus!
Best part: If you take lovely notes like I do, you can publish them as a blog post with a few tweaks.
Conclusion
This is my learning journey. I wanted to show you. This post may help someone with a similar learning style. You can alter the principles above for any technical material.

Leonardo Castorina
3 years ago
How to Use Obsidian to Boost Research Productivity
Tools for managing your PhD projects, reading lists, notes, and inspiration.
As a researcher, you have to know everything. But knowledge is useless if it cannot be accessed quickly. An easy-to-use method of archiving information makes taking notes effortless and enjoyable.
As a PhD student in Artificial Intelligence, I use Obsidian (https://obsidian.md) to manage my knowledge.
The article has three parts:
- What is a note, how to organize notes, tags, folders, and links? This section is tool-agnostic, so you can use most of these ideas with any note-taking app.
- Instructions for using Obsidian, managing notes, reading lists, and useful plugins. This section demonstrates how I use Obsidian, my preferred knowledge management tool.
- Workflows: How to use Zotero to take notes from papers, manage multiple projects' notes, create MOCs with Dataview, and more. This section explains how to use Obsidian to solve common scientific problems and manage/maintain your knowledge effectively.
This list is not perfect or complete, but it is my current solution to problems I've encountered during my PhD. Please leave additional comments or contact me if you have any feedback. I'll try to update this article.
Throughout the article, I'll refer to your digital library as your "Obsidian Vault" or "Zettelkasten".
Other useful resources are listed at the end of the article.
1. Philosophy: Taking and organizing notes
Carl Sagan: “To make an apple pie from scratch, you must first create the universe.”
Before diving into Obsidian, let's establish a Personal Knowledge Management System and a Zettelkasten. You can skip to Section 2 if you already know these terms.
Niklas Luhmann, a prolific sociologist who wrote 400 papers and 70 books, inspired this section and much of Zettelkasten. Zettelkasten means “slip box” (or library in this article). His Zettlekasten had around 90000 physical notes, which can be found here.
There are now many tools available to help with this process. Obsidian's website has a good introduction section: https://publish.obsidian.md/hub/
Notes
We'll start with "What is a note?" Although it may seem trivial, the answer depends on the topic or your note-taking style. The idea is that a note is as “atomic” (i.e. You should read the note and get the idea right away.
The resolution of your notes depends on their detail. Deep Learning, for example, could be a general description of Neural Networks, with a few notes on the various architectures (eg. Recurrent Neural Networks, Convolutional Neural Networks etc..).
Limiting length and detail is a good rule of thumb. If you need more detail in a specific section of this note, break it up into smaller notes. Deep Learning now has three notes:
- Deep Learning
- Recurrent Neural Networks
- Convolutional Neural Networks
Repeat this step as needed until you achieve the desired granularity. You might want to put these notes in a “Neural Networks” folder because they are all about the same thing. But there's a better way:
#Tags and [[Links]] over /Folders/
The main issue with folders is that they are not flexible and assume that all notes in the folder belong to a single category. This makes it difficult to make connections between topics.
Deep Learning has been used to predict protein structure (AlphaFold) and classify images (ImageNet). Imagine a folder structure like this:
- /Proteins/
- Protein Folding
- /Deep Learning/
- /Proteins/
Your notes about Protein Folding and Convolutional Neural Networks will be separate, and you won't be able to find them in the same folder.
This can be solved in several ways. The most common one is to use tags rather than folders. A note can be grouped with multiple topics this way. Obsidian tags can also be nested (have subtags).
You can also link two notes together. You can build your “Knowledge Graph” in Obsidian and other note-taking apps like Obsidian.
My Knowledge Graph. Green: Biology, Red: Machine Learning, Yellow: Autoencoders, Blue: Graphs, Brown: Tags.
My Knowledge Graph and the note “Backrpropagation” and its links.
Backpropagation note and all its links
Why use Folders?
Folders help organize your vault as it grows. The main suggestion is to have few folders that "weakly" collect groups of notes or better yet, notes from different sources.
Among my Zettelkasten folders are:
My Zettelkasten's 5 folders
They usually gather data from various sources:
MOC: Map of Contents for the Zettelkasten.
Projects: Contains one note for each side-project of my PhD where I log my progress and ideas. Notes are linked to these.
Bio and ML: These two are the main content of my Zettelkasten and could theoretically be combined.
Papers: All my scientific paper notes go here. A bibliography links the notes. Zotero .bib file
Books: I make a note for each book I read, which I then split into multiple notes.
Keeping images separate from other files can help keep your main folders clean.
I will elaborate on these in the Workflow Section.
My general recommendation is to use tags and links instead of folders.
Maps of Content (MOC)
Making Tables of Contents is a good solution (MOCs).
These are notes that "signposts" your Zettelkasten library, directing you to the right type of notes. It can link to other notes based on common tags. This is usually done with a title, then your notes related to that title. As an example:
An example of a Machine Learning MOC generated with Dataview.
As shown above, my Machine Learning MOC begins with the basics. Then it's on to Variational Auto-Encoders. Not only does this save time, but it also saves scrolling through the tag search section.
So I keep MOCs at the top of my library so I can quickly find information and see my library. These MOCs are generated automatically using an Obsidian Plugin called Dataview (https://github.com/blacksmithgu/obsidian-dataview).
Ideally, MOCs could be expanded to include more information about the notes, their status, and what's left to do. In the absence of this, Dataview does a fantastic job at creating a good structure for your notes.
In the absence of this, Dataview does a fantastic job at creating a good structure for your notes.
2. Tools: Knowing Obsidian
Obsidian is my preferred tool because it is free, all notes are stored in Markdown format, and each panel can be dragged and dropped. You can get it here: https://obsidian.md/
Obsidian interface.
Obsidian is highly customizable, so here is my preferred interface:
The theme is customized from https://github.com/colineckert/obsidian-things
Alternatively, each panel can be collapsed, moved, or removed as desired. To open a panel later, click on the vertical "..." (bottom left of the note panel).
My interface is organized as follows:
How my Obsidian Interface is organized.
Folders/Search:
This is where I keep all relevant folders. I usually use the MOC note to navigate, but sometimes I use the search button to find a note.
Tags:
I use nested tags and look into each one to find specific notes to link.
cMenu:
Easy-to-use menu plugin cMenu (https://github.com/chetachiezikeuzor/cMenu-Plugin)
Global Graph:
The global graph shows all your notes (linked and unlinked). Linked notes will appear closer together. Zoom in to read each note's title. It's a bit overwhelming at first, but as your library grows, you get used to the positions and start thinking of new connections between notes.
Local Graph:
Your current note will be shown in relation to other linked notes in your library. When needed, you can quickly jump to another link and back to the current note.
Links:
Finally, an outline panel and the plugin Obsidian Power Search (https://github.com/aviral-batra/obsidian-power-search) allow me to search my vault by highlighting text.
Start using the tool and worry about panel positioning later. I encourage you to find the best use-case for your library.
Plugins
An additional benefit of using Obsidian is the large plugin library. I use several (Calendar, Citations, Dataview, Templater, Admonition):
Obsidian Calendar Plugin: https://github.com/liamcain
It organizes your notes on a calendar. This is ideal for meeting notes or keeping a journal.
Calendar addon from hans/obsidian-citation-plugin
Obsidian Citation Plugin: https://github.com/hans/
Allows you to cite papers from a.bib file. You can also customize your notes (eg. Title, Authors, Abstract etc..)
Plugin citation from hans/obsidian-citation-plugin
Obsidian Dataview: https://github.com/blacksmithgu/
A powerful plugin that allows you to query your library as a database and generate content automatically. See the MOC section for an example.
Allows you to create notes with specific templates like dates, tags, and headings.
Templater. Obsidian Admonition: https://github.com/valentine195/obsidian-admonition
Blocks allow you to organize your notes.
Plugin warning. Obsidian Admonition (valentine195)
There are many more, but this list should get you started.
3. Workflows: Cool stuff
Here are a few of my workflows for using obsidian for scientific research. This is a list of resources I've found useful for my use-cases. I'll outline and describe them briefly so you can skim them quickly.
3.1 Using Templates to Structure Notes
3.2 Free Note Syncing (Laptop, Phone, Tablet)
3.3 Zotero/Mendeley/JabRef -> Obsidian — Managing Reading Lists
3.4 Projects and Lab Books
3.5 Private Encrypted Diary
3.1 Using Templates to Structure Notes
Plugins: Templater and Dataview (optional).
To take effective notes, you must first make adding new notes as easy as possible. Templates can save you time and give your notes a consistent structure. As an example:
An example of a note using a template.
### [[YOUR MOC]]
# Note Title of your note
**Tags**::
**Links**::
The top line links to your knowledge base's Map of Content (MOC) (see previous sections). After the title, I add tags (and a link between the note and the tag) and links to related notes.
To quickly identify all notes that need to be expanded, I add the tag “#todo”. In the “TODO:” section, I list the tasks within the note.
The rest are notes on the topic.
Templater can help you create these templates. For new books, I use the following template:
### [[Books MOC]]
# Title
**Author**::
**Date::
**Tags::
**Links::
A book template example.
Using a simple query, I can hook Dataview to it.
dataview
table author as Author, date as “Date Finished”, tags as “Tags”, grade as “Grade”
from “4. Books”
SORT grade DESCENDING
using Dataview to query templates.
3.2 Free Note Syncing (Laptop, Phone, Tablet)
No plugins used.
One of my favorite features of Obsidian is the library's self-contained and portable format. Your folder contains everything (plugins included).
Ordinary folders and documents are available as well. There is also a “.obsidian” folder. This contains all your plugins and settings, so you can use it on other devices.
So you can use Google Drive, iCloud, or Dropbox for free as long as you sync your folder (note: your folder should be in your Cloud Folder).
For my iOS and macOS work, I prefer iCloud. You can also use the paid service Obsidian Sync.
3.3 Obsidian — Managing Reading Lists and Notes in Zotero/Mendeley/JabRef
Plugins: Quotes (required).
3.3 Zotero/Mendeley/JabRef -> Obsidian — Taking Notes and Managing Reading Lists of Scientific Papers
My preferred reference manager is Zotero, but this workflow should work with any reference manager that produces a .bib file. This file is exported to my cloud folder so I can access it from any platform.
My Zotero library is tagged as follows:
My reference manager's tags
For readings, I usually search for the tags “!!!” and “To-Read” and select a paper. Annotate the paper next (either on PDF using GoodNotes or on physical paper).
Then I make a paper page using a template in the Citations plugin settings:
An example of my citations template.
Create a new note, open the command list with CMD/CTRL + P, and find the Citations “Insert literature note content in the current pane” to see this lovely view.
Citation generated by the article https://doi.org/10.1101/2022.01.24.22269144
You can then convert your notes to digital. I found that transcribing helped me retain information better.
3.4 Projects and Lab Books
Plugins: Tweaker (required).
PhD students offering advice on thesis writing are common (read as regret). I started asking them what they would have done differently or earlier.
“Deep stuff Leo,” one person said. So my main issue is basic organization, losing track of my tasks and the reasons for them.
As a result, I'd go on other experiments that didn't make sense, and have to reverse engineer my logic for thesis writing. - PhD student now wise Postdoc
Time management requires planning. Keeping track of multiple projects and lab books is difficult during a PhD. How I deal with it:
- One folder for all my projects
- One file for each project
I use a template to create each project
### [[Projects MOC]]
# <% tp.file.title %>
**Tags**::
**Links**::
**URL**::
**Project Description**::## Notes:
### <% tp.file.last_modified_date(“dddd Do MMMM YYYY”) %>
#### Done:
#### TODO:
#### Notes
You can insert a template into a new note with CMD + P and looking for the Templater option.
I then keep adding new days with another template:
### <% tp.file.last_modified_date("dddd Do MMMM YYYY") %>
#### Done:
#### TODO:
#### Notes:
This way you can keep adding days to your project and update with reasonings and things you still have to do and have done. An example below:
Example of project note with timestamped notes.
3.5 Private Encrypted Diary
This is one of my favorite Obsidian uses.
Mini Diary's interface has long frustrated me. After the author archived the project, I looked for a replacement. I had two demands:
- It had to be private, and nobody had to be able to read the entries.
- Cloud syncing was required for editing on multiple devices.
Then I learned about encrypting the Obsidian folder. Then decrypt and open the folder with Obsidian. Sync the folder as usual.
Use CryptoMator (https://cryptomator.org/). Create an encrypted folder in Cryptomator for your Obsidian vault, set a password, and let it do the rest.
If you need a step-by-step video guide, here it is:
Conclusion
So, I hope this was helpful!
In the first section of the article, we discussed notes and note-taking techniques. We discussed when to use tags and links over folders and when to break up larger notes.
Then we learned about Obsidian, its interface, and some useful plugins like Citations for citing papers and Templater for creating note templates.
Finally, we discussed workflows and how to use Zotero to take notes from scientific papers, as well as managing Lab Books and Private Encrypted Diaries.
Thanks for reading and commenting :)
Read original post here

Jano le Roux
3 years ago
My Top 11 Tools For Building A Modern Startup, With A Free Plan
The best free tools are probably unknown to you.
Modern startups are easy to build.
Start with free tools.
Let’s go.
Web development — Webflow
Code-free HTML, CSS, and JS.
Webflow isn't like Squarespace, Wix, or Shopify.
It's a super-fast no-code tool for professionals to construct complex, highly-responsive websites and landing pages.
Webflow can help you add animations like those on Apple's website to your own site.
I made the jump from WordPress a few years ago and it changed my life.
No damn plugins. No damn errors. No damn updates.
The best, you can get started on Webflow for free.
Data tracking — Airtable
Spreadsheet wings.
Airtable combines spreadsheet flexibility with database power without code.
Airtable is modern.
Airtable has modularity.
Scaling Airtable is simple.
Airtable, one of the most adaptable solutions on this list, is perfect for client data management.
Clients choose customized service packages. Airtable consolidates data so you can automate procedures like invoice management and focus on your strengths.
Airtable connects with so many tools that rarely creates headaches. Airtable scales when you do.
Airtable's flexibility makes it a potential backend database.
Design — Figma
Better, faster, easier user interface design.
Figma rocks!
It’s fast.
It's free.
It's adaptable
First, design in Figma.
Iterate.
Export development assets.
Figma lets you add more team members as your company grows to work on each iteration simultaneously.
Figma is web-based, so you don't need a powerful PC or Mac to start.
Task management — Trello
Unclock jobs.
Tacky and terrifying task management products abound. Trello isn’t.
Those that follow Marie Kondo will appreciate Trello.
Everything is clean.
Nothing is complicated.
Everything has a place.
Compared to other task management solutions, Trello is limited. And that’s good. Too many buttons lead to too many decisions lead to too many hours wasted.
Trello is a must for teamwork.
Domain email — Zoho
Free domain email hosting.
Professional email is essential for startups. People relied on monthly payments for too long. Nope.
Zoho offers 5 free professional emails.
It doesn't have Google's UI, but it works.
VPN — Proton VPN
Fast Swiss VPN protects your data and privacy.
Proton VPN is secure.
Proton doesn't record any data.
Proton is based in Switzerland.
Swiss privacy regulation is among the most strict in the world, therefore user data are protected. Switzerland isn't a 14 eye country.
Journalists and activists trust Proton to secure their identities while accessing and sharing information authoritarian governments don't want them to access.
Web host — Netlify
Free fast web hosting.
Netlify is a scalable platform that combines your favorite tools and APIs to develop high-performance sites, stores, and apps through GitHub.
Serverless functions and environment variables preserve API keys.
Netlify's free tier is unmissable.
100GB of free monthly bandwidth.
Free 125k serverless operations per website each month.
Database — MongoDB
Create a fast, scalable database.
MongoDB is for small and large databases. It's a fast and inexpensive database.
Free for the first million reads.
Then, for each million reads, you must pay $0.10.
MongoDB's free plan has:
Encryption from end to end
Continual authentication
field-level client-side encryption
If you have a large database, you can easily connect MongoDB to Webflow to bypass CMS limits.
Automation — Zapier
Time-saving tip: automate repetitive chores.
Zapier simplifies life.
Zapier syncs and connects your favorite apps to do impossibly awesome things.
If your online store is connected to Zapier, a customer's purchase can trigger a number of automated actions, such as:
The customer is being added to an email chain.
Put the information in your Airtable.
Send a pre-programmed postcard to the customer.
Alexa, set the color of your smart lights to purple.
Zapier scales when you do.
Email & SMS marketing — Omnisend
Email and SMS marketing campaigns.
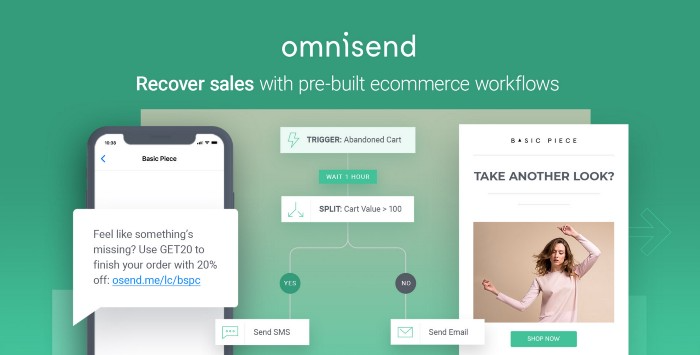
This is an excellent Mailchimp option for magical emails. Omnisend's processes simplify email automation.
I love the interface's cleanliness.
Omnisend's free tier includes web push notifications.
Send up to:
500 emails per month
60 maximum SMSs
500 Web Push Maximum
Forms and surveys — Tally
Create flexible forms that people enjoy.
Typeform is clean but restricting. Sometimes you need to add many questions. Tally's needed sometimes.
Tally is flexible and cheaper than Typeform.
99% of Tally's features are free and unrestricted, including:
Unlimited forms
Countless submissions
Collect payments
File upload
Tally lets you examine what individuals contributed to forms before submitting them to see where they get stuck.
Airtable and Zapier connectors automate things further. If you pay, you can apply custom CSS to fit your brand.
See.
Free tools are the greatest.
Let's use them to launch a startup.
You might also like

Sam Hickmann
3 years ago
Token taxonomy: Utility vs Security vs NFT
Let's examine the differences between the three main token types and their functions.
As Ethereum grew, the term "token" became a catch-all term for all assets built on the Ethereum blockchain. However, different tokens were grouped based on their applications and features, causing some confusion. Let's examine the modification of three main token types: security, utility, and non-fungible.
Utility tokens
They provide a specific utility benefit (or a number of such). A utility token is similar to a casino chip, a table game ticket, or a voucher. Depending on the terms of issuing, they can be earned and used in various ways. A utility token is a type of token that represents a tool or mechanism required to use the application in question. Like a service, a utility token's price is determined by supply and demand. Tokens can also be used as a bonus or reward mechanism in decentralized systems: for example, if you like someone's work, give them an upvote and they get a certain number of tokens. This is a way for authors or creators to earn money indirectly.
The most common way to use a utility token is to pay with them instead of cash for discounted goods or services.
Utility tokens are the most widely used by blockchain companies. Most cryptocurrency exchanges accept fees in native utility tokens.
Utility tokens can also be used as a reward. Companies tokenize their loyalty programs so that points can be bought and sold on blockchain exchanges. These tokens are widely used in decentralized companies as a bonus system. You can use utility tokens to reward creators for their contributions to a platform, for example. It also allows members to exchange tokens for specific bonuses and rewards on your site.
Unlike security tokens, which are subject to legal restrictions, utility tokens can be freely traded.
Security tokens
Security tokens are essentially traditional securities like shares, bonds, and investment fund units in a crypto token form.
The key distinction is that security tokens are typically issued by private firms (rather than public companies) that are not listed on stock exchanges and in which you can not invest right now. Banks and large venture funds used to be the only sources of funding. A person could only invest in private firms if they had millions of dollars in their bank account. Privately issued security tokens outperform traditional public stocks in terms of yield. Private markets grew 50% faster than public markets over the last decade, according to McKinsey Private Equity Research.
A security token is a crypto token whose value is derived from an external asset or company. So it is governed as security (read about the Howey test further in this article). That is, an ownership token derives its value from the company's valuation, assets on the balance sheet, or dividends paid to token holders.
Why are Security Tokens Important?
Cryptocurrency is a lucrative investment. Choosing from thousands of crypto assets can mean the difference between millionaire and bankrupt. Without security tokens, crypto investing becomes riskier and generating long-term profits becomes difficult. These tokens have lower risk than other cryptocurrencies because they are backed by real assets or business cash flows. So having them helps to diversify a portfolio and preserve the return on investment in riskier assets.
Security tokens open up new funding avenues for businesses. As a result, investors can invest in high-profit businesses that are not listed on the stock exchange.
The distinction between utility and security tokens isn't as clear as it seems. However, this increases the risk for token issuers, especially in the USA. The Howey test is the main pillar regulating judicial precedent in this area.
What is a Howey Test?
An "investment contract" is determined by the Howey Test, a lawsuit settled by the US Supreme Court. If it does, it's a security and must be disclosed and registered under the Securities Act of 1933 and the Securities Exchange Act of 1934.
If the SEC decides that a cryptocurrency token is a security, a slew of issues arise. In practice, this ensures that the SEC will decide when a token can be offered to US investors and if the project is required to file a registration statement with the SEC.
Due to the Howey test's extensive wording, most utility tokens will be classified as securities, even if not intended to be. Because of these restrictions, most ICOs are not available to US investors. When asked about ICOs in 2018, then-SEC Chairman Jay Clayton said they were securities. The given statement adds to the risk. If a company issues utility tokens without registering them as securities, the regulator may impose huge fines or even criminal charges.
What other documents regulate tokens?
Securities Act (1993) or Securities Exchange Act (1934) in the USA; MiFID directive and Prospectus Regulation in the EU. These laws require registering the placement of security tokens, limiting their transfer, but protecting investors.
Utility tokens have much less regulation. The Howey test determines whether a given utility token is a security. Tokens recognized as securities are now regulated as such. Having a legal opinion that your token isn't makes the implementation process much easier. Most countries don't have strict regulations regarding utility tokens except KYC (Know Your Client) and AML (Anti Money-Laundering).
As cryptocurrency and blockchain technologies evolve, more countries create UT regulations. If your company is based in the US, be aware of the Howey test and the Bank Secrecy Act. It classifies UTs and their issuance as money transmission services in most states, necessitating a license and strict regulations. Due to high regulatory demands, UT issuers try to avoid the United States as a whole. A new law separating utility tokens from bank secrecy act will be introduced in the near future, giving hope to American issuers.
The rest of the world has much simpler rules requiring issuers to create basic investor disclosures. For example, the latest European legislation (MiCA) allows businesses to issue utility tokens without regulator approval. They must also prepare a paper with all the necessary information for the investors.
A payment token is a utility token that is used to make a payment. They may be subject to electronic money laws.
Because non-fungible tokens are a new instrument, there is no regulating paper yet. However, if the NFT is fractionalized, the smaller tokens acquired may be seen as securities.
NFT Tokens
Collectible tokens are also known as non-fungible tokens. Their distinctive feature is that they denote unique items such as artwork, merch, or ranks. Unlike utility tokens, which are fungible, meaning that two of the same tokens are identical, NFTs represent a unit of possession that is strictly one of a kind. In a way, NFTs are like baseball cards, each one unique and valuable.
As for today, the most recognizable NFT function is to preserve the fact of possession. Owning an NFT with a particular gif, meme, or sketch does not transfer the intellectual right to the possessor, but is analogous to owning an original painting signed by the author.
Collectible tokens can also be used as digital souvenirs, so to say. Businesses can improve their brand image by issuing their own branded NFTs, which represent ranks or achievements within the corporate ecosystem. Gamifying business ecosystems would allow people to connect with a brand and feel part of a community.
Which type of tokens is right for you as a business to raise capital?
For most businesses, it's best to raise capital with security tokens by selling existing shares to global investors. Utility tokens aren't meant to increase in value over time, so leave them for gamification and community engagement. In a blockchain-based business, however, a utility token is often the lifeblood of the operation, and its appreciation potential is directly linked to the company's growth. You can issue multiple tokens at once, rather than just one type. It exposes you to various investors and maximizes the use of digital assets.
Which tokens should I buy?
There are no universally best tokens. Their volatility, industry, and risk-reward profile vary. This means evaluating tokens in relation to your overall portfolio and personal preferences: what industries do you understand best, what excites you, how do you approach taxes, and what is your planning horizon? To build a balanced portfolio, you need to know these factors.
Conclusion
The three most common types of tokens today are security, utility, and NFT. Security tokens represent stocks, mutual funds, and bonds. Utility tokens can be perceived as an inside-product "currency" or "ignition key" that grants you access to goods and services or empowers with other perks. NFTs are unique collectible units that identify you as the owner of something.

Dani Herrera
3 years ago
What prevents companies from disclosing salary information?

Yes, salary details ought to be mentioned in job postings. Recruiters and candidates both agree, so why doesn't it happen?
The short answer is “Unfortunately, it’s not the Recruiter’s decision”. The longer answer is well… A LOT.
Starting in November 2022, NYC employers must include salary ranges in job postings. It should have started in May, but companies balked.
I'm thrilled about salary transparency. This decision will promote fair, inclusive, and equitable hiring practices, and I'm sure other states will follow suit. Good news!
Candidates, recruiters, and ED&I practitioners have advocated for pay transparency for years. Why the opposition?
Let's quickly review why companies have trouble sharing salary bands.
💰 Pay Parity
Many companies and leaders still oppose pay parity. Yes, even in 2022.
💰 Pay Equity
Many companies believe in pay parity and have reviewed their internal processes and systems to ensure equality.
However, Pay Equity affects who gets roles/promotions/salary raises/bonuses and when. Enter the pay gap!
💰Pay Transparency and its impact on Talent Retention
Sharing salary bands with external candidates (and the world) means current employees will have access to that information, which is one of the main reasons companies don't share salary data.
If a company has Pay Parity and Pay Equity issues, they probably have a Pay Transparency policy as well.
Sharing salary information with external candidates without ensuring current employees understand their own salary bands and how promotions/raises are decided could impact talent retention strategies.
This information should help clarify recent conversations.

Hunter Walk
2 years ago
Is it bad of me to want our portfolio companies to generate greater returns for outside investors than they did for us as venture capitalists?
Wishing for Lasting Companies, Not Penny Stocks or Goodwill Write-Downs
Get me a NASCAR-style company-logoed cremation urn (notice to the executor of my will, theres gonna be a lot of weird requests). I believe in working on projects that would be on your tombstone. As the Homebrew logo is tattooed on my shoulder, expanding the portfolio to my posthumous commemoration is easy. But this isn't an IRR victory lap; it's a hope that the firms we worked for would last beyond my lifetime.
![a little boy planting a dollar bill in the ground and pouring a watering can out on it, digital art [DALL-E]](https://storage.googleapis.com/int3grity/posts/V62hkReDx56S/images/vMwzqrYeXaYnUIMXAdTY9)
Venture investors too often take credit or distance themselves from startups based on circumstances. Successful companies tell stories of crucial introductions, strategy conversations, and other value. Defeats Even whether our term involves Board service or systematic ethical violations, I'm just a little investment, so there's not much I can do. Since I'm guilty, I'm tossing stones from within the glass home (although we try to own our decisions through the lifecycle).
Post-exit company trajectories are usually unconfounded. Off the cap table, no longer a shareholder (or a diminishing one as you sell off/distribute), eventually leaving the Board. You can cheer for the squad or forget about it, but you've freed the corporation and it's back to portfolio work.
As I look at the downward track of most SPACs and other tarnished IPOs from the last few years, I wonder how I would feel if those were my legacy. Is my job done? Yes. When investing in a business, the odds are against it surviving, let alone thriving and being able to find sunlight. SPAC sponsors, institutional buyers, retail investments. Free trade in an open market is their right. Risking and losing capital is the system working! But
We were lead or co-lead investors in our first three funds, but as additional VCs joined the company, we were pushed down the cap table. Voting your shares rarely matters; supporting the firm when they need it does. Being valuable, consistent, and helping the company improve builds trust with the founders.
I hope every startup we sponsor becomes a successful public company before, during, and after we benefit. My perspective of American capitalism. Well, a stock ticker has a lot of garbage, and I support all types of regulation simplification (in addition to being a person investor in the Long-Term Stock Exchange). Yet being owned by a large group of investors and making actual gains for them is great. Likewise does seeing someone you met when they were just starting out become a public company CEO without losing their voice, leadership, or beliefs.
I'm just thinking about what we can do from the start to realize value from our investments and build companies with bright futures. Maybe seed venture financing shouldn't impact those outcomes, but I'm not comfortable giving up that obligation.