


More on Web3 & Crypto

Jeff Scallop
3 years ago
The Age of Decentralized Capitalism and DeFi
DeCap is DeFi's killer app.
“Software is eating the world.” Marc Andreesen, venture capitalist
DeFi. Imagine a blockchain-based alternative financial system that offers the same products and services as traditional finance, but with more variety, faster, more secure, lower cost, and simpler access.
Decentralised finance (DeFi) is a marketplace without gatekeepers or central authority managing the flow of money, where customers engage directly with smart contracts running on a blockchain.
DeFi grew exponentially in 2020/21, with Total Value Locked (an inadequate estimate for market size) topping at $100 billion. After that, it crashed.
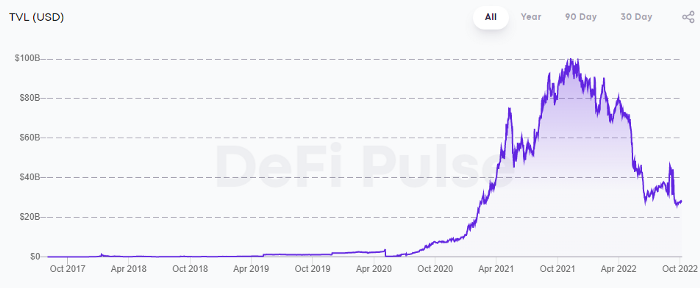
The accumulation of funds by individuals with high discretionary income during the epidemic, the novelty of crypto trading, and the high yields given (5% APY for stablecoins on established platforms to 100%+ for risky assets) are among the primary elements explaining this exponential increase.
No longer your older brothers DeFi
Since transactions are anonymous, borrowers had to overcollateralize DeFi 1.0. To borrow $100 in stablecoins, you must deposit $150 in ETH. DeFi 1.0's business strategy raises two problems.
Why does DeFi offer interest rates that are higher than those of the conventional financial system?;
Why would somebody put down more cash than they intended to borrow?
Maxed out on their own resources, investors took loans to acquire more crypto; the demand for those loans raised DeFi yields, which kept crypto prices increasing; as crypto prices rose, investors made a return on their positions, allowing them to deposit more money and borrow more crypto.
This is a bull market game. DeFi 1.0's overcollateralization speculation is dead. Cryptocrash sank it.
The “speculation by overcollateralisation” world of DeFi 1.0 is dead
At a JP Morgan digital assets conference, institutional investors were more interested in DeFi than crypto or fintech. To me, that shows DeFi 2.0's institutional future.
DeFi 2.0 protocols must handle KYC/AML, tax compliance, market abuse, and cybersecurity problems to be institutional-ready.
Stablecoins gaining market share under benign regulation and more CBDCs coming online in the next couple of years could help DeFi 2.0 separate from crypto volatility.
DeFi 2.0 will have a better footing to finally decouple from crypto volatility
Then we can transition from speculation through overcollateralization to DeFi's genuine comparative advantages: cheaper transaction costs, near-instant settlement, more efficient price discovery, faster time-to-market for financial innovation, and a superior audit trail.
Akin to Amazon for financial goods
Amazon decimated brick-and-mortar shops by offering millions of things online, warehouses by keeping just-in-time inventory, and back-offices by automating invoicing and payments. Software devoured retail. DeFi will eat banking with software.
DeFi is the Amazon for financial items that will replace fintech. Even the most advanced internet brokers offer only 100 currency pairings and limited bonds, equities, and ETFs.
Old banks settlement systems and inefficient, hard-to-upgrade outdated software harm them. For advanced gamers, it's like driving an F1 vehicle on dirt.
It is like driving a F1 car on a dirt road, for the most sophisticated players
Central bankers throughout the world know how expensive and difficult it is to handle cross-border payments using the US dollar as the reserve currency, which is vulnerable to the economic cycle and geopolitical tensions.
Decentralization is the only method to deliver 24h global financial markets. DeFi 2.0 lets you buy and sell startup shares like Google or Tesla. VC funds will trade like mutual funds. Or create a bundle coverage for your car, house, and NFTs. Defi 2.0 consumes banking and creates Global Wall Street.
Defi 2.0 is how software eats banking and delivers the global Wall Street
Decentralized Capitalism is Emerging
90% of markets are digital. 10% is hardest to digitalize. That's money creation, ID, and asset tokenization.
90% of financial markets are already digital. The only problem is that the 10% left is the hardest to digitalize
Debt helped Athens construct a powerful navy that secured trade routes. Bonds financed the Renaissance's wars and supply chains. Equity fueled industrial growth. FX drove globalization's payments system. DeFi's plans:
If the 20th century was a conflict between governments and markets over economic drivers, the 21st century will be between centralized and decentralized corporate structures.
Offices vs. telecommuting. China vs. onshoring/friendshoring. Oil & gas vs. diverse energy matrix. National vs. multilateral policymaking. DAOs vs. corporations Fiat vs. crypto. TradFi vs.
An age where the network effects of the sharing economy will overtake the gains of scale of the monopolistic competition economy
This is the dawn of Decentralized Capitalism (or DeCap), an age where the network effects of the sharing economy will reach a tipping point and surpass the scale gains of the monopolistic competition economy, further eliminating inefficiencies and creating a more robust economy through better data and automation. DeFi 2.0 enables this.
DeFi needs to pay the piper now.
DeCap won't be Web3.0's Shangri-La, though. That's too much for an ailing Atlas. When push comes to shove, DeFi folks want to survive and fight another day for the revolution. If feasible, make a tidy profit.
Decentralization wasn't meant to circumvent regulation. It circumvents censorship. On-ramp, off-ramp measures (control DeFi's entry and exit points, not what happens in between) sound like a good compromise for DeFi 2.0.
The sooner authorities realize that DeFi regulation is made ex-ante by writing code and constructing smart contracts with rules, the faster DeFi 2.0 will become the more efficient and safe financial marketplace.
More crucially, we must boost system liquidity. DeFi's financial stability risks are downplayed. DeFi must improve its liquidity management if it's to become mainstream, just as banks rely on capital constraints.
This reveals the complex and, frankly, inadequate governance arrangements for DeFi protocols. They redistribute control from tokenholders to developers, which is bad governance regardless of the economic model.
But crypto can only ride the existing banking system for so long before forming its own economy. DeFi will upgrade web2.0's financial rails till then.

Dylan Smyth
4 years ago
10 Ways to Make Money Online in 2022
As a tech-savvy person (and software engineer) or just a casual technology user, I'm sure you've had this same question countless times: How do I make money online? and how do I make money with my PC/Mac?
You're in luck! Today, I will list the top 5 easiest ways to make money online. Maybe a top ten in the future? Top 5 tips for 2022.
1. Using the gig economy
There are many websites on the internet that allow you to earn extra money using skills and equipment that you already own.
I'm referring to the gig economy. It's a great way to earn a steady passive income from the comfort of your own home. For some sites, premium subscriptions are available to increase sales and access features like bidding on more proposals.
Some of these are:
- Freelancer
- Upwork
- Fiverr (⭐ my personal favorite)
- TaskRabbit
2. Mineprize
MINEPRIZE is a great way to make money online. What's more, You need not do anything! You earn money by lending your idle CPU power to MINEPRIZE.
To register with MINEPRIZE, all you need is an email address and a password. Let MINEPRIZE use your resources, and watch the money roll in! You can earn up to $100 per month by letting your computer calculate. That's insane.
3. Writing
“O Romeo, Romeo, why art thou Romeo?” Okay, I admit that not all writing is Shakespearean. To be a copywriter, you'll need to be fluent in English. Thankfully, we don't have to use typewriters anymore.
Writing is a skill that can earn you a lot of money (claps for the rhyme).
Here are a few ways you can make money typing on your fancy keyboard:
Self-publish a book
Write scripts for video creators
Write for social media
Book-checking
Content marketing help
What a list within a list!
4. Coding
Yes, kids. You've probably coded before if you understand
You've probably coded before if you understand
print("hello world");
Computational thinking (or coding) is one of the most lucrative ways to earn extra money, or even as a main source of income.
Of course, there are hardcode coders (like me) who write everything line by line, binary di — okay, that last part is a bit exaggerated.
But you can also make money by writing websites or apps or creating low code or no code platforms.
But you can also make money by writing websites or apps or creating low code or no code platforms.
Some low-code platforms
Sheet : spreadsheets to apps :
Loading... We'll install your new app... No-Code Your team can create apps and automate tasks. Agile…
www.appsheet.com
Low-code platform | Business app creator - Zoho Creator
Work is going digital, and businesses of all sizes must adapt quickly. Zoho Creator is a...
www.zoho.com
Sell your data with TrueSource. NO CODE NEEDED
Upload data, configure your product, and earn in minutes.
www.truesource.io
Cool, huh?
5. Created Content
If we use the internet correctly, we can gain unfathomable wealth and extra money. But this one is a bit more difficult. Unlike some of the other items on this list, it takes a lot of time up front.
I'm referring to sites like YouTube and Medium. It's a great way to earn money both passively and actively. With the likes of Jake- and Logan Paul, PewDiePie (a.k.a. Felix Kjellberg) and others, it's never too late to become a millionaire on YouTube. YouTubers are always rising to the top with great content.
6. NFTs and Cryptocurrency
It is now possible to amass large sums of money by buying and selling digital assets on NFTs and cryptocurrency exchanges. Binance's Initial Game Offer rewards early investors who produce the best results.
One awesome game sold a piece of its plot for US$7.2 million! It's Axie Infinity. It's free and available on Google Play and Apple Store.
7. Affiliate Marketing
Affiliate marketing is a form of advertising where businesses pay others (like bloggers) to promote their goods and services. Here's an example. I write a blog (like this one) and post an affiliate link to an item I recommend buying — say, a camera — and if you buy the camera, I get a commission!
These programs pay well:
- Elementor
- AWeber
- Sendinblue
- ConvertKit\sLeadpages
- GetResponse
- SEMRush\sFiverr
- Pabbly
8. Start a blog
Now, if you're a writer or just really passionate about something or a niche, blogging could potentially monetize that passion!
Create a blog about anything you can think of. It's okay to start right here on Medium, as I did.
9. Dropshipping
And I mean that in the best possible way — drop shopping is ridiculously easy to set up, but difficult to maintain for some.
Luckily, Shopify has made setting up an online store a breeze. Drop-shipping from Alibaba and DHGate is quite common. You've got a winner if you can find a local distributor willing to let you drop ship their product!
10. Set up an Online Course
If you have a skill and can articulate it, online education is for you.
Skillshare, Pluralsight, and Coursera have all made inroads in recent years, upskilling people with courses that YOU can create and earn from.
That's it for today! Please share if you liked this post. If not, well —

Julie Plavnik
3 years ago
How to Become a Crypto Broker [Complying and Making Money]
Three options exist. The third one is the quickest and most fruitful.
You've mastered crypto trading and want to become a broker.
So you may wonder: Where to begin?
If so, keep reading.
Today I'll compare three different approaches to becoming a cryptocurrency trader.
What are cryptocurrency brokers, and how do they vary from stockbrokers?
A stockbroker implements clients' market orders (retail or institutional ones).
Brokerage firms are regulated, insured, and subject to regulatory monitoring.
Stockbrokers are required between buyers and sellers. They can't trade without a broker. To trade, a trader must open a broker account and deposit money. When a trader shops, he tells his broker what orders to place.
Crypto brokerage is trade intermediation with cryptocurrency.
In crypto trading, however, brokers are optional.
Crypto exchanges offer direct transactions. Open an exchange account (no broker needed) and make a deposit.
Question:
Since crypto allows DIY trading, why use a broker?
Let's compare cryptocurrency exchanges vs. brokers.
Broker versus cryptocurrency exchange
Most existing crypto exchanges are basically brokers.
Examine their primary services:
connecting purchasers and suppliers
having custody of clients' money (with the exception of decentralized cryptocurrency exchanges),
clearance of transactions.
Brokerage is comparable, don't you think?
There are exceptions. I mean a few large crypto exchanges that follow the stock exchange paradigm. They outsource brokerage, custody, and clearing operations. Classic exchange setups are rare in today's bitcoin industry.
Back to our favorite “standard” crypto exchanges. All-in-one exchanges and brokers. And usually, they operate under a broker or a broker-dealer license, save for the exchanges registered somewhere in a free-trade offshore paradise. Those don’t bother with any licensing.
What’s the sense of having two brokers at a time?
Better liquidity and trading convenience.
The crypto business is compartmentalized.
We have CEXs, DEXs, hybrid exchanges, and semi-exchanges (those that aggregate liquidity but do not execute orders on their sides). All have unique regulations and act as sovereign states.
There are about 18k coins and hundreds of blockchain protocols, most of which are heterogeneous (i.e., different in design and not interoperable).
A trader must register many accounts on different exchanges, deposit funds, and manage them all concurrently to access global crypto liquidity.
It’s extremely inconvenient.
Crypto liquidity fragmentation is the largest obstacle and bottleneck blocking crypto from mass adoption.
Crypto brokers help clients solve this challenge by providing one-gate access to deep and diverse crypto liquidity from numerous exchanges and suppliers. Professionals and institutions need it.
Another killer feature of a brokerage may be allowing clients to trade crypto with fiat funds exclusively, without fiat/crypto conversion. It is essential for professional and institutional traders.
Who may work as a cryptocurrency broker?
Apparently, not anyone. Brokerage requires high-powered specialists because it involves other people's money.
Here's the essentials:
excellent knowledge, skills, and years of trading experience
high-quality, quick, and secure infrastructure
highly developed team
outstanding trading capital
High-ROI network: long-standing, trustworthy connections with customers, exchanges, liquidity providers, payment gates, and similar entities
outstanding marketing and commercial development skills.
What about a license for a cryptocurrency broker? Is it necessary?
Complex question.
If you plan to play in white-glove jurisdictions, you may need a license. For example, in the US, as a “money transmitter” or as a CASSP (crypto asset secondary services provider) in Australia.
Even in these jurisdictions, there are no clear, holistic crypto brokerage and licensing policies.
Your lawyer will help you decide if your crypto brokerage needs a license.
Getting a license isn't quick. Two years of patience are needed.
How can you turn into a cryptocurrency broker?
Finally, we got there! 🎉
Three actionable ways exist:
To kickstart a regulated stand-alone crypto broker
To get a crypto broker franchise, and
To become a liquidity network broker.
Let's examine each.
1. Opening a regulated cryptocurrency broker
It's difficult. Especially If you're targeting first-world users.
You must comply with many regulatory, technical, financial, HR, and reporting obligations to keep your organization running. Some are mentioned above.
The licensing process depends on the products you want to offer (spots or derivatives) and the geographic areas you plan to service. There are no general rules for that.
In an overgeneralized way, here are the boxes you will have to check:
capital availability (usually a large amount of capital c is required)
You will have to move some of your team members to the nation providing the license in order to establish an office presence there.
the core team with the necessary professional training (especially applies to CEO, Head of Trading, Assistant to Head of Trading, etc.)
insurance
infrastructure that is trustworthy and secure
adopted proper AML/KYC/financial monitoring policies, etc.
Assuming you passed, what's next?
I bet it won’t be mind-blowing for you that the license is just a part of the deal. It won't attract clients or revenue.
To bring in high-dollar clientele, you must be a killer marketer and seller. It's not easy to convince people to give you money.
You'll need to be a great business developer to form successful, long-term agreements with exchanges (ideally for no fees), liquidity providers, banks, payment gates, etc. Persuade clients.
It's a tough job, isn't it?

I expect a Quora-type question here:
Can I start an unlicensed crypto broker?
Well, there is always a workaround with crypto!
You can register your broker in a free-trade zone like Seychelles to avoid US and other markets with strong watchdogs.
This is neither wise nor sustainable.
First, such experiments are illegal.
Second, you'll have trouble attracting clients and strategic partners.
A license equals trust. That’s it.
Even a pseudo-license from Mauritius matters.
Here are this method's benefits and downsides.
Cons first.
As you navigate this difficult and expensive legal process, you run the risk of missing out on business prospects. It's quite simple to become excellent compliance yet unable to work. Because your competitors are already courting potential customers while you are focusing all of your effort on paperwork.
Only God knows how long it will take you to pass the break-even point when everything with the license has been completed.
It is a money-burning business, especially in the beginning when the majority of your expenses will go toward marketing, sales, and maintaining license requirements. Make sure you have the fortitude and resources necessary to face such a difficult challenge.
Pros
It may eventually develop into a tool for making money. Because big guys who are professionals at trading require a white-glove regulated brokerage. You have every possibility if you work hard in the areas of sales, marketing, business development, and wealth. Simply put, everything must align.
Launching a regulated crypto broker is analogous to launching a crypto exchange. It's ROUGH. Sure you can take it?
2. Franchise for Crypto Broker (Crypto Sub-Brokerage)
A broker franchise is easier and faster than becoming a regulated crypto broker. Not a traditional brokerage.
A broker franchisee, often termed a sub-broker, joins with a broker (a franchisor) to bring them new clients. Sub-brokers market a broker's products and services to clients.
Sub-brokers are the middlemen between a broker and an investor.
Why is sub-brokering easier?
less demanding qualifications and legal complexity. All you need to do is keep a few certificates on hand (each time depends on the jurisdiction).
No significant investment is required
there is no demand that you be a trading member of an exchange, etc.
As a sub-broker, you can do identical duties without as many rights and certifications.
What about the crypto broker franchise?
Sub-brokers aren't common in crypto.
In most existing examples (PayBito, PCEX, etc.), franchises are offered by crypto exchanges, not brokers. Though we remember that crypto exchanges are, in fact, brokers, do we?
Similarly:
For a commission, a franchiser crypto broker receives new leads from a crypto sub-broker.
See above for why enrolling is easy.
Finding clients is difficult. Most crypto traders prefer to buy-sell on their own or through brokers over sub-broker franchises.
3. Broker of the Crypto Trading Network (or a Network Broker)
It's the greatest approach to execute crypto brokerage, based on effort/return.
Network broker isn't an established word. I wrote it for clarity.
Remember how we called crypto liquidity fragmentation the current crypto finance paradigm's main bottleneck?
Where there's a challenge, there's progress.
Several well-funded projects are aiming to fix crypto liquidity fragmentation. Instead of launching another crypto exchange with siloed trading, the greatest minds create trading networks that aggregate crypto liquidity from desynchronized sources and enable quick, safe, and affordable cross-blockchain transactions. Each project offers a distinct option for users.
Crypto liquidity implies:
One-account access to cryptocurrency liquidity pooled from network participants' exchanges and other liquidity sources
compiled price feeds
Cross-chain transactions that are quick and inexpensive, even for HFTs
link between participants of all kinds, and
interoperability among diverse blockchains
Fast, diversified, and cheap global crypto trading from one account.
How does a trading network help cryptocurrency brokers?
I’ll explain it, taking Yellow Network as an example.
Yellow provides decentralized Layer-3 peer-to-peer trading.
trade across chains globally with real-time settlement and
Between cryptocurrency exchanges, brokers, trading companies, and other sorts of network members, there is communication and the exchange of financial information.
Have you ever heard about ECN (electronic communication network)? If not, it's an automated system that automatically matches buy and sell orders. Yellow is a decentralized digital asset ECN.
Brokers can:
Start trading right now without having to meet stringent requirements; all you need to do is integrate with Yellow Protocol and successfully complete some KYC verification.
Access global aggregated crypto liquidity through a single point.
B2B (Broker to Broker) liquidity channels that provide peer liquidity from other brokers. Orders from the other broker will appear in the order book of a broker who is peering with another broker on the market. It will enable a broker to broaden his offer and raise the total amount of liquidity that is available to his clients.
Select a custodian or use non-custodial practices.
Comparing network crypto brokerage to other types:
A licensed stand-alone brokerage business is much more difficult and time-consuming to launch than network brokerage, and
Network brokerage, in contrast to crypto sub-brokerage, is scalable, independent, and offers limitless possibilities for revenue generation.
Yellow Network Whitepaper. has more details on how to start a brokerage business and what rewards you'll obtain.
Final thoughts
There are three ways to become a cryptocurrency broker, including the non-conventional liquidity network brokerage. The last option appears time/cost-effective.
Crypto brokerage isn't crowded yet. Act quickly to find your right place in this market.
Choose the way that works for you best and see you in crypto trading.
Discover Web3 & DeFi with Yellow Network!
Yellow, powered by Openware, is developing a cross-chain P2P liquidity aggregator to unite the crypto sector and provide global remittance services that aid people.
Join the Yellow Community and plunge into this decade's biggest product-oriented crypto project.
Observe Yellow Twitter
Enroll in Yellow Telegram
Visit Yellow Discord.
On Hacker Noon, look us up.
Yellow Network will expose development, technology, developer tools, crypto brokerage nodes software, and community liquidity mining.
You might also like

Cory Doctorow
3 years ago
The downfall of the Big Four accounting companies is just one (more) controversy away.
Economic mutual destruction.

Multibillion-dollar corporations never bothered with an independent audit, and they all lied about their balance sheets.
It's easy to forget that the Big Four accounting firms are lousy fraud enablers. Just because they sign off on your books doesn't mean you're not a hoax waiting to erupt.
This is *crazy* Capitalism depends on independent auditors. Rich folks need to know their financial advisers aren't lying. Rich folks usually succeed.
No accounting. EY, KPMG, PWC, and Deloitte make more money consulting firms than signing off on their accounts.
The Big Four sign off on phony books because failing to make friends with unscrupulous corporations may cost them consulting contracts.
The Big Four are the only firms big enough to oversee bankruptcy when they sign off on fraudulent books, as they did for Carillion in 2018. All four profited from Carillion's bankruptcy.
The Big Four are corrupt without any consequences for misconduct. Who can forget when KPMG's top management was fined millions for helping auditors cheat on ethics exams?
Consulting and auditing conflict. Consultants help a firm cover its evil activities, such as tax fraud or wage theft, whereas auditors add clarity to a company's finances. The Big Four make more money from cooking books than from uncooking them, thus they are constantly embroiled in scandals.
If a major scandal breaks, it may bring down the entire sector and substantial parts of the economy. Jim Peterson explains system risk for The Dig.
The Big Four are voluntary private partnerships where accountants invest their time, reputations, and money. If a controversy threatens the business, partners who depart may avoid scandal and financial disaster.
When disaster looms, each partner should bolt for the door, even if a disciplined stay-and-hold posture could weather the storm. This happened to Arthur Andersen during Enron's collapse, and a 2006 EU report recognized the risk to other corporations.
Each partner at a huge firm knows how much dirty laundry they've buried in the company's garden, and they have well-founded suspicions about what other partners have buried, too. When someone digs, everyone runs.
If a firm confronts substantial litigation damages or enforcement penalties, it could trigger the collapse of one of the Big Four. That would be bad news for the firm's clients, who would have trouble finding another big auditor.
Most of the world's auditing capacity is concentrated in four enormous, brittle, opaque, compromised organizations. If one of them goes bankrupt, the other three won't be able to take on its clients.
Peterson: Another collapse would strand many of the world's large public businesses, leaving them unable to obtain audit views for their securities listings and regulatory compliance.
Count Down: The Past, Present, and Uncertain Future of the Big Four Accounting Firms is in its second edition.
https://www.emerald.com/insight/publication/doi/10.1108/9781787147003

Sam Hickmann
3 years ago
What is headline inflation?
Headline inflation is the raw Consumer price index (CPI) reported monthly by the Bureau of labour statistics (BLS). CPI measures inflation by calculating the cost of a fixed basket of goods. The CPI uses a base year to index the current year's prices.
Explaining Inflation
As it includes all aspects of an economy that experience inflation, headline inflation is not adjusted to remove volatile figures. Headline inflation is often linked to cost-of-living changes, which is useful for consumers.
The headline figure doesn't account for seasonality or volatile food and energy prices, which are removed from the core CPI. Headline inflation is usually annualized, so a monthly headline figure of 4% inflation would equal 4% inflation for the year if repeated for 12 months. Top-line inflation is compared year-over-year.
Inflation's downsides
Inflation erodes future dollar values, can stifle economic growth, and can raise interest rates. Core inflation is often considered a better metric than headline inflation. Investors and economists use headline and core results to set growth forecasts and monetary policy.
Core Inflation
Core inflation removes volatile CPI components that can distort the headline number. Food and energy costs are commonly removed. Environmental shifts that affect crop growth can affect food prices outside of the economy. Political dissent can affect energy costs, such as oil production.
From 1957 to 2018, the U.S. averaged 3.64 percent core inflation. In June 1980, the rate reached 13.60%. May 1957 had 0% inflation. The Fed's core inflation target for 2022 is 3%.
Central bank:
A central bank has privileged control over a nation's or group's money and credit. Modern central banks are responsible for monetary policy and bank regulation. Central banks are anti-competitive and non-market-based. Many central banks are not government agencies and are therefore considered politically independent. Even if a central bank isn't government-owned, its privileges are protected by law. A central bank's legal monopoly status gives it the right to issue banknotes and cash. Private commercial banks can only issue demand deposits.
What are living costs?
The cost of living is the amount needed to cover housing, food, taxes, and healthcare in a certain place and time. Cost of living is used to compare the cost of living between cities and is tied to wages. If expenses are higher in a city like New York, salaries must be higher so people can live there.
What's U.S. bureau of labor statistics?
BLS collects and distributes economic and labor market data about the U.S. Its reports include the CPI and PPI, both important inflation measures.

Tom Smykowski
2 years ago
CSS Scroll-linked Animations Will Transform The Web's User Experience
We may never tap again in ten years.
I discussed styling websites and web apps on smartwatches in my earlier article on W3C standardization.
The Parallax Chronicles
Section containing examples and flying objects
Another intriguing Working Draft I found applies to all devices, including smartphones.
These pages may have something intriguing. Take your time. Return after scrolling:
What connects these three pages?

JustinWick at English Wikipedia • CC-BY-SA-3.0
Scroll-linked animation, commonly called parallax, is the effect.
WordPress theme developers' quick setup and low-code tools made the effect popular around 2014.
Parallax: Why Designers Love It
The chapter that your designer shouldn't read
Online video playback required searching, scrolling, and clicking ten years ago. Scroll and click four years ago.
Some video sites let you swipe to autoplay the next video from an endless list.
UI designers create scrollable pages and apps to accommodate the behavioral change.
Web interactivity used to be mouse-based. Clicking a button opened a help drawer, and hovering animated it.
However, a large page with more material requires fewer buttons and less interactiveness.
Designers choose scroll-based effects. Design and frontend developers must fight the trend but prepare for the worst.
How to Create Parallax
The component that you might want to show the designer
JavaScript-based effects track page scrolling and apply animations.
Javascript libraries like lax.js simplify it.
Using it needs a lot of human mathematical and physical computations.
Your asset library must also be prepared to display your website on a laptop, television, smartphone, tablet, foldable smartphone, and possibly even a microwave.
Overall, scroll-based animations can be solved better.
CSS Scroll-linked Animations
CSS makes sense since it's presentational. A Working Draft has been laying the groundwork for the next generation of interactiveness.
The new CSS property scroll-timeline powers the feature, which MDN describes well.
Before testing it, you should realize it is poorly supported:
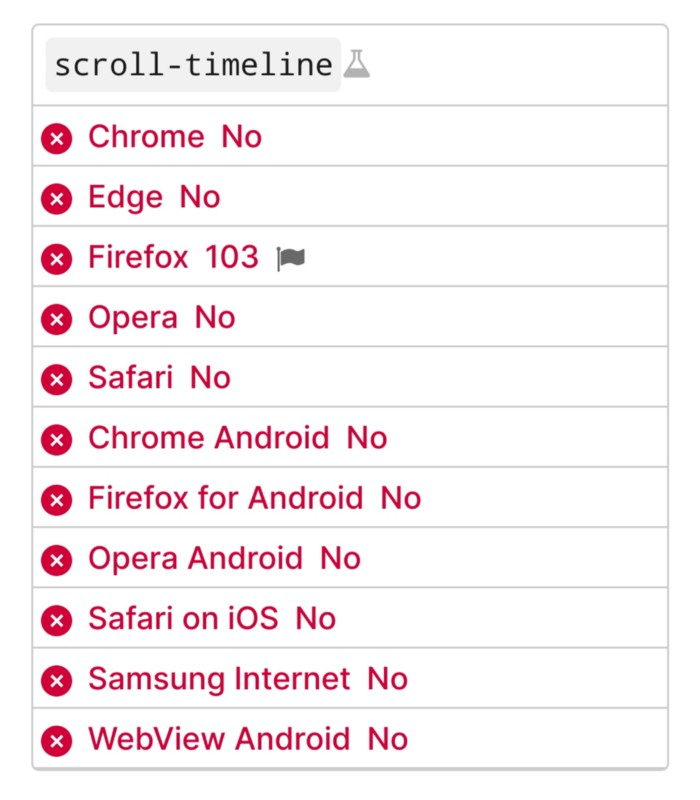
Firefox 103 currently supports it.
There is also a polyfill, with some demo examples to explore.
Summary
Web design was a protracted process. Started with pages with static backdrop images and scrollable text. Artists and designers may use the scroll-based animation CSS API to completely revamp our web experience.
It's a promising frontier. This post may attract a future scrollable web designer.
Ps. I have created flashcards for HTML, Javascript etc. Check them out!