


More on Entrepreneurship/Creators

Antonio Neto
3 years ago
What's up with tech?
Massive Layoffs, record low VC investment, debate over crash... why is it happening and what’s the endgame?

This article generalizes a diverse industry. For objectivity, specific tech company challenges like growing competition within named segments won't be considered. Please comment on the posts.
According to Layoffs.fyi, nearly 120.000 people have been fired from startups since March 2020. More than 700 startups have fired 1% to 100% of their workforce. "The tech market is crashing"
Venture capital investment dropped 19% QoQ in the first four months of 2022, a 2018 low. Since January 2022, Nasdaq has dropped 27%. Some believe the tech market is collapsing.
It's bad, but nothing has crashed yet. We're about to get super technical, so buckle up!
I've written a follow-up article about what's next. For a more optimistic view of the crisis' aftermath, see: Tech Diaspora and Silicon Valley crisis
What happened?
Insanity reigned. Last decade, everyone became a unicorn. Seed investments can be made without a product or team. While the "real world" economy suffered from the pandemic for three years, tech companies enjoyed the "new normal."
COVID sped up technology adoption on several fronts, but this "new normal" wasn't so new after many restrictions were lifted. Worse, it lived with disrupted logistics chains, high oil prices, and WW3. The consumer market has felt the industry's boom for almost 3 years. Inflation, unemployment, mental distress...what looked like a fast economic recovery now looks like unfulfilled promises.
People rethink everything they eat. Paying a Netflix subscription instead of buying beef is moronic if you can watch it for free on your cousin’s account. No matter how great your real estate app's UI is, buying a house can wait until mortgage rates drop. PLGProduct Led Growth (PLG) isn't the go-to strategy when consumers have more basic expense priorities.
Exponential growth and investment
Until recently, tech companies believed that non-exponential revenue growth was fatal. Exponential growth entails doing more with less. From Salim Ismail words:
An Exponential Organization (ExO) has 10x the impact of its peers.
Many tech companies' theories are far from reality.
Investors have funded (sometimes non-exponential) growth. Scale-driven companies throw people at problems until they're solved. Need an entire closing team because you’ve just bought a TV prime time add? Sure. Want gold-weight engineers to colorize buttons? Why not?
Tech companies don't need cash flow to do it; they can just show revenue growth and get funding. Even though it's hard to get funding, this was the market's momentum until recently.
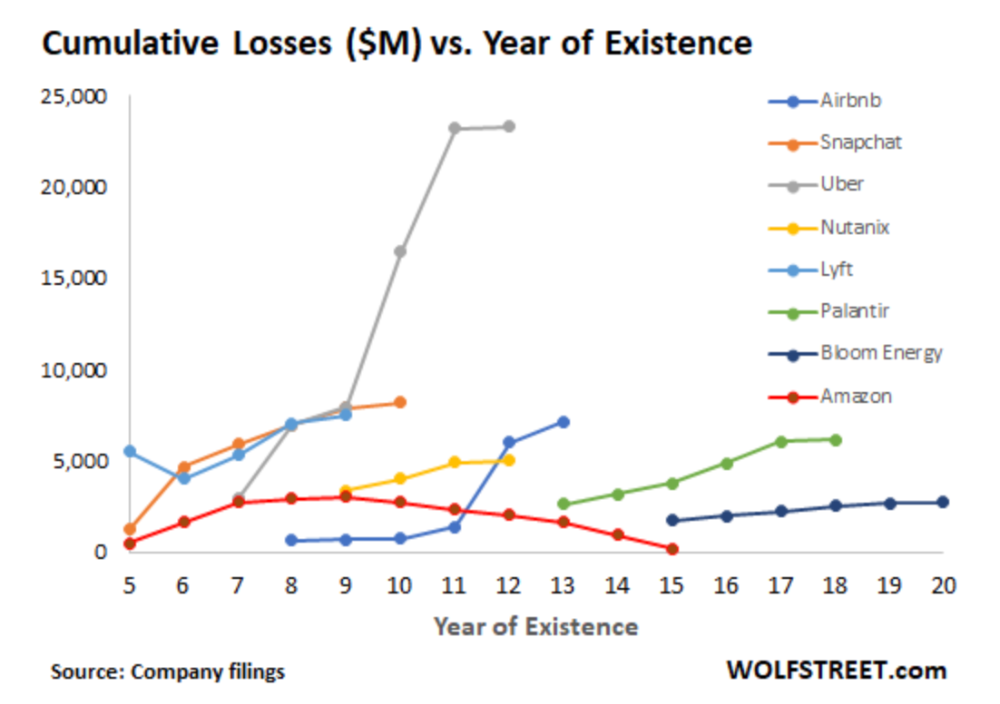
The graph at the beginning of this section shows how industry heavyweights burned money until 2020, despite being far from their market-share seed stage. Being big and being sturdy are different things, and a lot of the tech startups out there are paper tigers. Without investor money, they have no foundation.
A little bit about interest rates
Inflation-driven high interest rates are said to be causing tough times. Investors would rather leave money in the bank than spend it (I myself said it some days ago). It’s not wrong, but it’s also not that simple.
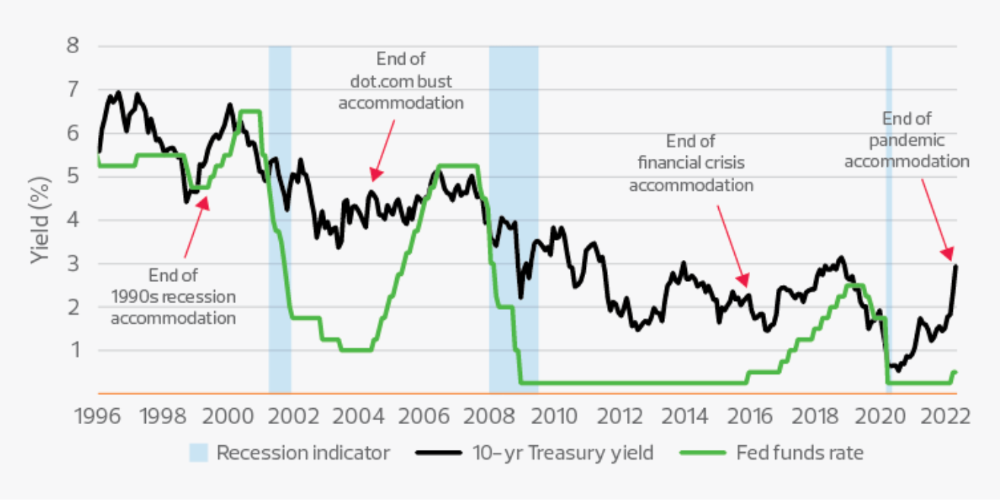
The USA central bank (FED) is a good proxy of global economics. Dollar treasury bonds are the safest investment in the world. Buying U.S. debt, the only country that can print dollars, guarantees payment.
The graph above shows that FED interest rates are low and 10+ year bond yields are near 2018 levels. Nobody was firing at 2018. What’s with that then?
Full explanation is too technical for this article, so I'll just summarize: Bond yields rise due to lack of demand or market expectations of longer-lasting inflation. Safe assets aren't a "easy money" tactic for investors. If that were true, we'd have seen the current scenario before.
Long-term investors are protecting their capital from inflation.
Not a crash, a landing
I bombarded you with info... Let's review:
Consumption is down, hurting revenue.
Tech companies of all ages have been hiring to grow revenue at the expense of profit.
Investors expect inflation to last longer, reducing future investment gains.
Inflation puts pressure on a wheel that was rolling full speed not long ago. Investment spurs hiring, growth, and more investment. Worried investors and consumers reduce the cycle, and hiring follows.
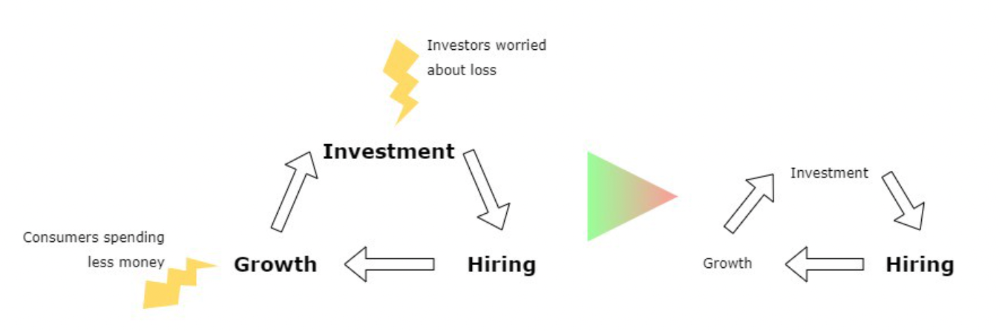
Long-term investors back startups. When the invested company goes public or is sold, it's ok to burn money. What happens when the payoff gets further away? What if all that money sinks? Investors want immediate returns.
Why isn't the market crashing? Technology is not losing capital. It’s expecting change. The market realizes it threw moderation out the window and is reversing course. Profitability is back on the menu.
People solve problems and make money, but they also cost money. Huge cost for the tech industry. Engineers, Product Managers, and Designers earn up to 100% more than similar roles. Businesses must be careful about who they keep and in what positions to avoid wasting money.
What the future holds
From here on, it's all speculation. I found many great articles while researching this piece. Some are cited, others aren't (like this and this). We're in an adjustment period that may or may not last long.
Big companies aren't laying off many workers. Netflix firing 100 people makes headlines, but it's only 1% of their workforce. The biggest seem to prefer not hiring over firing.
Smaller startups beyond the seeding stage may be hardest hit. Without structure or product maturity, many will die.
I expect layoffs to continue for some time, even at Meta or Amazon. I don't see any industry names falling like they did during the .com crisis, but the market will shrink.
If you are currently employed, think twice before moving out and where to.
If you've been fired, hurry, there are still many opportunities.
If you're considering a tech career, wait.
If you're starting a business, I respect you. Good luck.

Jayden Levitt
3 years ago
Billionaire who was disgraced lost his wealth more quickly than anyone in history
If you're not genuine, you'll be revealed.
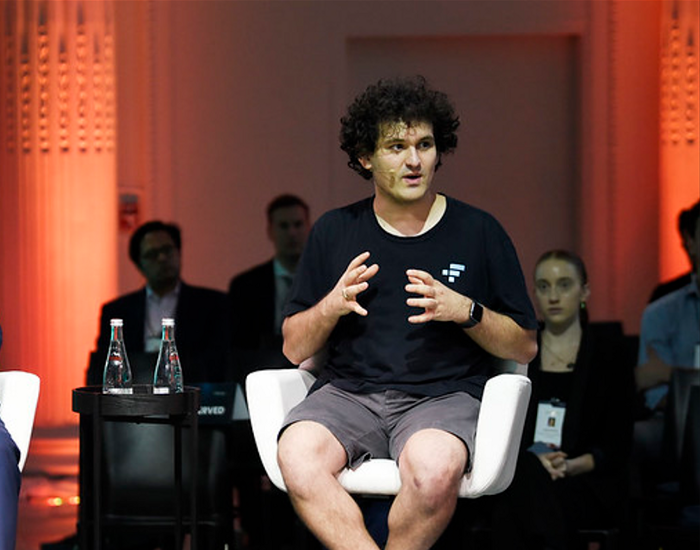
Sam Bankman-Fried (SBF) was called the Cryptocurrency Warren Buffet.
No wonder.
SBF's trading expertise, Blockchain knowledge, and ability to construct FTX attracted mainstream investors.
He had a fantastic worldview, donating much of his riches to charity.
As the onion layers peel back, it's clear he wasn't the altruistic media figure he portrayed.
SBF's mistakes were disastrous.
Customer deposits were traded and borrowed by him.
With ten other employees, he shared a $40 million mansion where they all had polyamorous relationships.
Tone-deaf and wasteful marketing expenditures, such as the $200 million spent to change the name of the Miami Heat stadium to the FTX Arena
Democrats received a $40 million campaign gift.
And now there seems to be no regret.
FTX was a 32-billion-dollar cryptocurrency exchange.
It went bankrupt practically overnight.
SBF, FTX's creator, exploited client funds to leverage trade.
FTX had $1 billion in customer withdrawal reserves against $9 billion in liabilities in sister business Alameda Research.
Bloomberg Billionaire Index says it's the largest and fastest net worth loss in history.
It gets worse.
SBF's net worth is $900 Million, however he must still finalize FTX's bankruptcy.
SBF's arrest in the Bahamas and SEC inquiry followed news that his cryptocurrency exchange had crashed, losing billions in customer deposits.
A journalist contacted him on Twitter D.M., and their exchange is telling.
His ideas are revealed.
Kelsey Piper says they didn't expect him to answer because people under investigation don't comment.
Bankman-Fried wanted to communicate, and the interaction shows he has little remorse.
SBF talks honestly about FTX gaming customers' money and insults his competition.
Reporter Kelsey Piper was outraged by what he said and felt the mistakes SBF says plague him didn't evident in the messages.
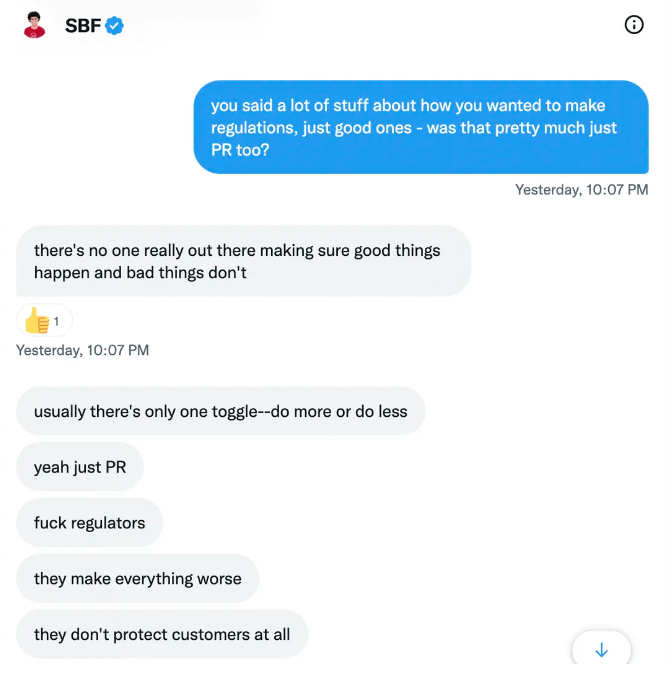
Before FTX's crash, SBF was a poster child for Cryptocurrency regulation and avoided criticizing U.S. regulators.
He tells Piper that his lobbying is just excellent PR.
It shows his genuine views and supports cynics' opinions that his attempts to win over U.S. authorities were good for his image rather than Crypto.
SBF’s responses are in Grey, and Pipers are in Blue.
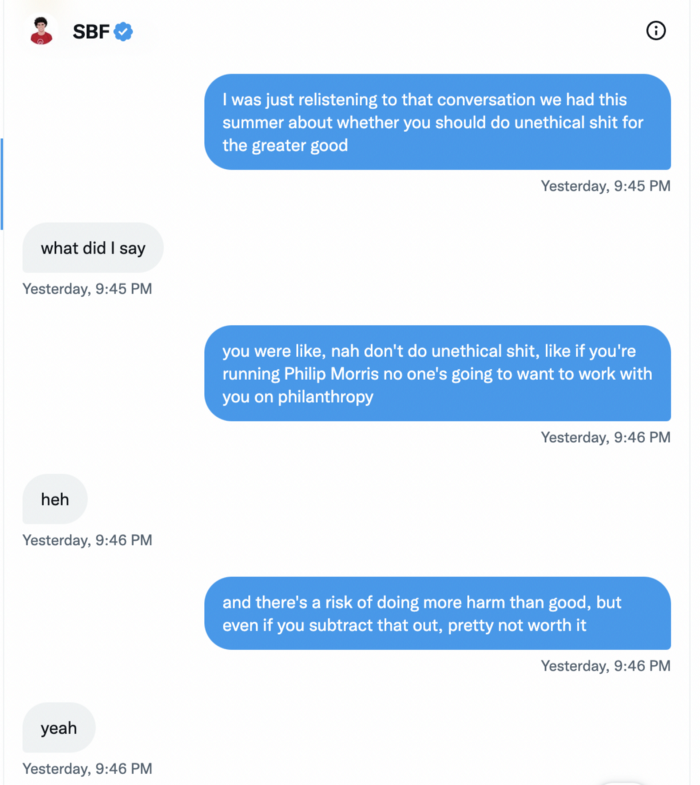
It's unclear if SBF cut corners for his gain. In their Twitter exchange, Piper revisits an interview question about ethics.
SBF says, "All the foolish sh*t I said"
SBF claims FTX has never invested customer monies.
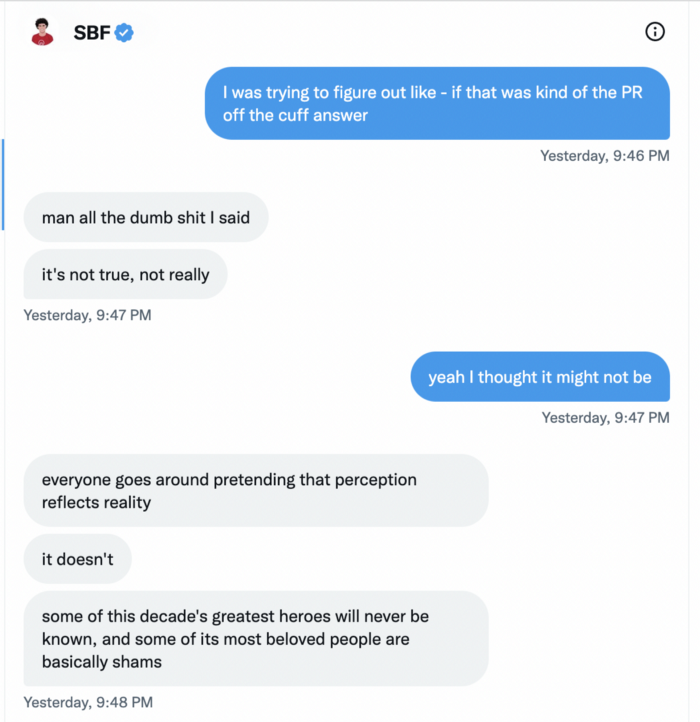
Piper challenged him on Twitter.
While he insisted FTX didn't use customer deposits, he said sibling business Alameda borrowed too much from FTX's balance sheet.
He did, basically.
When consumers tried to withdraw money, FTX was short.
SBF thought Alameda had enough money to cover FTX customers' withdrawals, but life sneaks up on you.

SBF believes most exchanges have done something similar to FTX, but they haven't had a bank run (a bunch of people all wanting to get their deposits out at the same time).
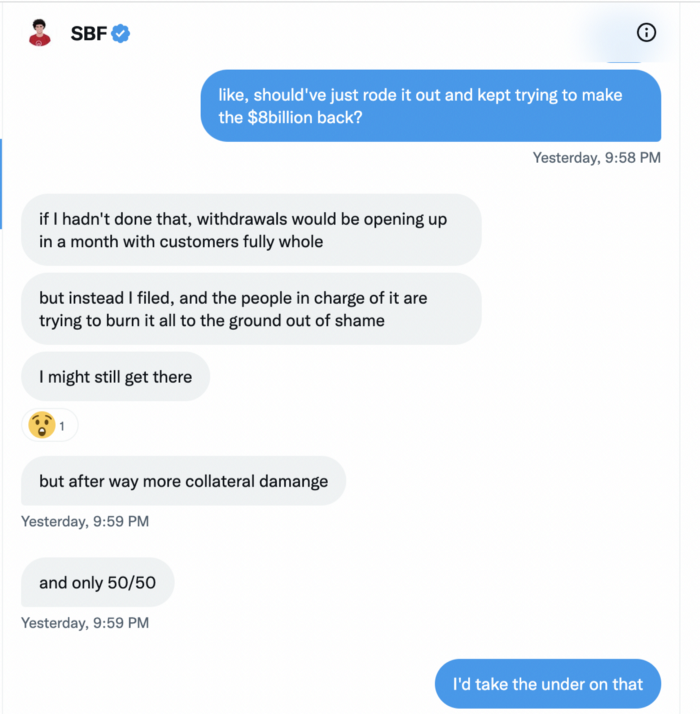
SBF believes he shouldn't have consented to the bankruptcy and kept attempting to raise more money because withdrawals would be open in a month with clients whole.
If additional money came in, he needed $8 billion to bridge the creditors' deficit, and there aren't many corporations with $8 billion to spare.
Once clients feel protected, they will continue to leave their assets on the exchange, according to one idea.
Kevin OLeary, a world-renowned hedge fund manager, says not all investors will walk through the open gate once the company is safe, therefore the $8 Billion wasn't needed immediately.
SBF claims the bankruptcy was his biggest error because he could have accumulated more capital.

Final Reflections
Sam Bankman-Fried, 30, became the world's youngest billionaire in four years.
Never listen to what people say about investing; watch what they do.
SBF is a trader who gets wrecked occasionally.
Ten first-time entrepreneurs ran FTX, screwing each other with no risk management.
It prevents opposing or challenging perspectives and echo chamber highs.
Twitter D.M. conversation with a journalist is the final nail.
He lacks an experienced crew.
This event will surely speed up much-needed regulation.
It's also prompted cryptocurrency exchanges to offer proof of reserves to calm customers.

Scrum Ventures
3 years ago
Trends from the Winter 2022 Demo Day at Y Combinators
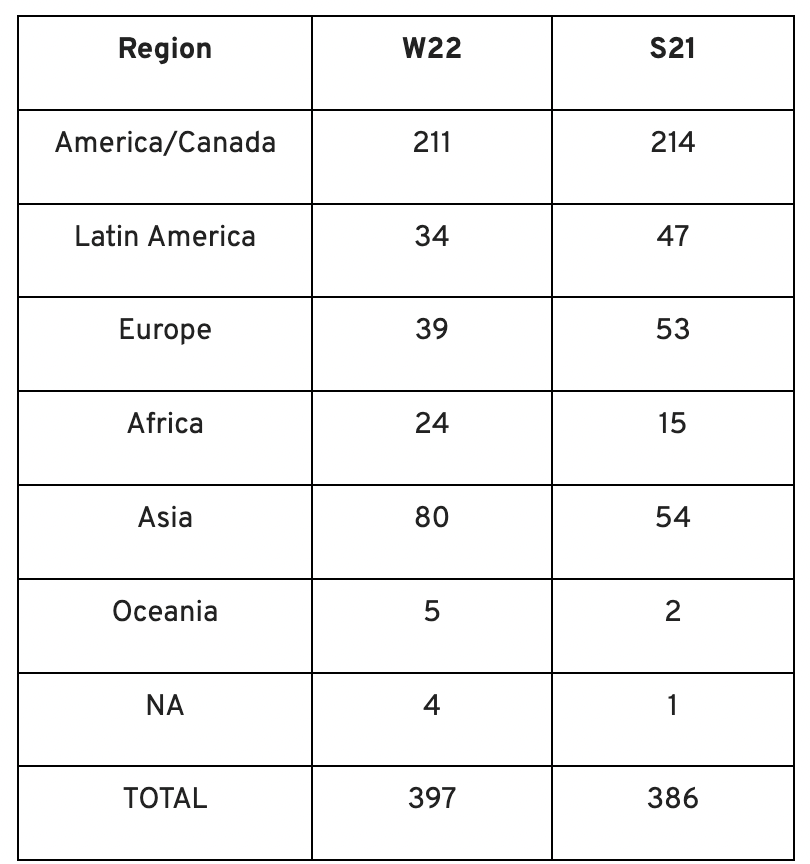
Y Combinators Winter 2022 Demo Day continues the trend of more startups engaging in accelerator Demo Days. Our team evaluated almost 400 projects in Y Combinator's ninth year.
After Winter 2021 Demo Day, we noticed a hurry pushing shorter rounds, inflated valuations, and larger batches.
Despite the batch size, this event's behavior showed a return to normalcy. Our observations show that investors evaluate and fund businesses more carefully. Unlike previous years, more YC businesses gave investors with data rooms and thorough pitch decks in addition to valuation data before Demo Day.
Demo Day pitches were virtual and fast-paced, limiting unplanned meetings. Investors had more time and information to do their due research before meeting founders. Our staff has more time to study diverse areas and engage with interesting entrepreneurs and founders.
This was one of the most regionally diversified YC cohorts to date. This year's Winter Demo Day startups showed some interesting tendencies.
Trends and Industries to Watch Before Demo Day
Demo day events at any accelerator show how investment competition is influencing startups. As startups swiftly become scale-ups and big success stories in fintech, e-commerce, healthcare, and other competitive industries, entrepreneurs and early-stage investors feel pressure to scale quickly and turn a notion into actual innovation.
Too much eagerness can lead founders to focus on market growth and team experience instead of solid concepts, technical expertise, and market validation. Last year, YC Winter Demo Day funding cycles ended too quickly and valuations were unrealistically high.
Scrum Ventures observed a longer funding cycle this year compared to last year's Demo Day. While that seems promising, many factors could be contributing to change, including:
Market patterns are changing and the economy is becoming worse.
the industries that investors are thinking about.
Individual differences between each event batch and the particular businesses and entrepreneurs taking part
The Winter 2022 Batch's Trends
Each year, we also wish to examine trends among early-stage firms and YC event participants. More international startups than ever were anticipated to present at Demo Day.
Less than 50% of demo day startups were from the U.S. For the S21 batch, firms from outside the US were most likely in Latin America or Europe, however this year's batch saw a large surge in startups situated in Asia and Africa.
YC Startup Directory
163 out of 399 startups were B2B software and services companies. Financial, healthcare, and consumer startups were common.
Our team doesn't plan to attend every pitch or speak with every startup's founders or team members. Let's look at cleantech, Web3, and health and wellness startup trends.
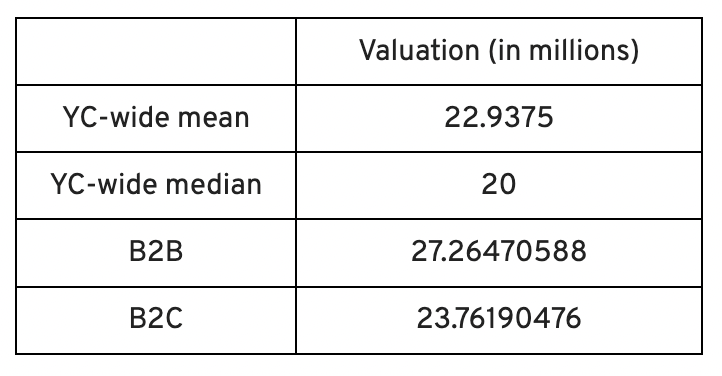
Our Opinions Following Conversations with 87 Startups at Demo Day
In the lead-up to Demo Day, we spoke with 87 of the 125 startups going. Compared to B2C enterprises, B2B startups had higher average valuations. A few outliers with high valuations pushed B2B and B2C means above the YC-wide mean and median.
Many of these startups develop business and technology solutions we've previously covered. We've seen API, EdTech, creative platforms, and cybersecurity remain strong and increase each year.
While these persistent tendencies influenced the startups Scrum Ventures looked at and the founders we interacted with on Demo Day, new trends required more research and preparation. Let's examine cleantech, Web3, and health and wellness startups.
Hardware and software that is green
Cleantech enterprises demand varying amounts of funding for hardware and software. Although the same overarching trend is fueling the growth of firms in this category, each subgroup has its own strategy and technique for investigation and identifying successful investments.
Many cleantech startups we spoke to during the YC event are focused on helping industrial operations decrease or recycle carbon emissions.
Carbon Crusher: Creating carbon negative roads
Phase Biolabs: Turning carbon emissions into carbon negative products and carbon neutral e-fuels
Seabound: Capturing carbon dioxide emissions from ships
Fleetzero: Creating electric cargo ships
Impossible Mining: Sustainable seabed mining
Beyond Aero: Creating zero-emission private aircraft
Verdn: Helping businesses automatically embed environmental pledges for product and service offerings, boost customer engagement
AeonCharge: Allowing electric vehicle (EV) drivers to more easily locate and pay for EV charging stations
Phoenix Hydrogen: Offering a hydrogen marketplace and a connected hydrogen hub platform to connect supply and demand for hydrogen fuel and simplify hub planning and partner program expansion
Aklimate: Allowing businesses to measure and reduce their supply chain’s environmental impact
Pina Earth: Certifying and tracking the progress of businesses’ forestry projects
AirMyne: Developing machines that can reverse emissions by removing carbon dioxide from the air
Unravel Carbon: Software for enterprises to track and reduce their carbon emissions
Web3: NFTs, the metaverse, and cryptocurrency
Web3 technologies handle a wide range of business issues. This category includes companies employing blockchain technology to disrupt entertainment, finance, cybersecurity, and software development.
Many of these startups overlap with YC's FinTech trend. Despite this, B2C and B2B enterprises were evenly represented in Web3. We examined:
Stablegains: Offering consistent interest on cash balance from the decentralized finance (DeFi) market
LiquiFi: Simplifying token management with automated vesting contracts, tax reporting, and scheduling. For companies, investors, and finance & accounting
NFTScoring: An NFT trading platform
CypherD Wallet: A multichain wallet for crypto and NFTs with a non-custodial crypto debit card that instantly converts coins to USD
Remi Labs: Allowing businesses to more easily create NFT collections that serve as access to products, memberships, events, and more
Cashmere: A crypto wallet for Web3 startups to collaboratively manage funds
Chaingrep: An API that makes blockchain data human-readable and tokens searchable
Courtyard: A platform for securely storing physical assets and creating 3D representations as NFTs
Arda: “Banking as a Service for DeFi,” an API that FinTech companies can use to embed DeFi products into their platforms
earnJARVIS: A premium cryptocurrency management platform, allowing users to create long-term portfolios
Mysterious: Creating community-specific experiences for Web3 Discords
Winter: An embeddable widget that allows businesses to sell NFTs to users purchasing with a credit card or bank transaction
SimpleHash: An API for NFT data that provides compatibility across blockchains, standardized metadata, accurate transaction info, and simple integration
Lifecast: Tools that address motion sickness issues for 3D VR video
Gym Class: Virtual reality (VR) multiplayer basketball video game
WorldQL: An asset API that allows NFT creators to specify multiple in-game interpretations of their assets, increasing their value
Bonsai Desk: A software development kit (SDK) for 3D analytics
Campfire: Supporting virtual social experiences for remote teams
Unai: A virtual headset and Visual World experience
Vimmerse: Allowing creators to more easily create immersive 3D experiences
Fitness and health
Scrum Ventures encountered fewer health and wellness startup founders than Web3 and Cleantech. The types of challenges these organizations solve are still diverse. Several of these companies are part of a push toward customization in healthcare, an area of biotech set for growth for companies with strong portfolios and experienced leadership.
Here are several startups we considered:
Syrona Health: Personalized healthcare for women in the workplace
Anja Health: Personalized umbilical cord blood banking and stem cell preservation
Alfie: A weight loss program focused on men’s health that coordinates medical care, coaching, and “community-based competition” to help users lose an average of 15% body weight
Ankr Health: An artificial intelligence (AI)-enabled telehealth platform that provides personalized side effect education for cancer patients and data collection for their care teams
Koko — A personalized sleep program to improve at-home sleep analysis and training
Condition-specific telehealth platforms and programs:
Reviving Mind: Chronic care management covered by insurance and supporting holistic, community-oriented health care
Equipt Health: At-home delivery of prescription medical equipment to help manage chronic conditions like obstructive sleep apnea
LunaJoy: Holistic women’s healthcare management for mental health therapy, counseling, and medication
12 Startups from YC's Winter 2022 Demo Day to Watch
Bobidi: 10x faster AI model improvement
Artificial intelligence (AI) models have become a significant tool for firms to improve how well and rapidly they process data. Bobidi helps AI-reliant firms evaluate their models, boosting data insights in less time and reducing data analysis expenditures. The business has created a gamified community that offers a bug bounty for AI, incentivizing community members to test and find weaknesses in clients' AI models.
Magna: DeFi investment management and token vesting
Magna delivers rapid, secure token vesting so consumers may turn DeFi investments into primitives. Carta for Web3 allows enterprises to effortlessly distribute tokens to staff or investors. The Magna team hopes to allow corporations use locked tokens as collateral for loans, facilitate secondary liquidity so investors can sell shares on a public exchange, and power additional DeFi applications.
Perl Street: Funding for infrastructure
This Fintech firm intends to help hardware entrepreneurs get financing by [democratizing] structured finance, unleashing billions for sustainable infrastructure and next-generation hardware solutions. This network has helped hardware entrepreneurs achieve more than $140 million in finance, helping companies working on energy storage devices, EVs, and creating power infrastructure.
CypherD: Multichain cryptocurrency wallet
CypherD seeks to provide a multichain crypto wallet so general customers can explore Web3 products without knowledge hurdles. The startup's beta app lets consumers access crypto from EVM blockchains. The founders have crypto, financial, and startup experience.
Unravel Carbon: Enterprise carbon tracking and offsetting
Unravel Carbon's AI-powered decarbonization technology tracks companies' carbon emissions. Singapore-based startup focuses on Asia. The software can use any company's financial data to trace the supply chain and calculate carbon tracking, which is used to make regulatory disclosures and suggest carbon offsets.
LunaJoy: Precision mental health for women
LunaJoy helped women obtain mental health support throughout life. The platform combines data science to create a tailored experience, allowing women to access psychotherapy, medication management, genetic testing, and health coaching.
Posh: Automated EV battery recycling
Posh attempts to solve one of the EV industry's largest logistical difficulties. Millions of EV batteries will need to be decommissioned in the next decade, and their precious metals and residual capacity will go unused for some time. Posh offers automated, scalable lithium battery disassembly, making EV battery recycling more viable.
Unai: VR headset with 5x higher resolution
Unai stands apart from metaverse companies. Its VR headgear has five times the resolution of existing options and emphasizes human expression and interaction in a remote world. Maxim Perumal's method of latency reduction powers current VR headsets.
Palitronica: Physical infrastructure cybersecurity
Palitronica blends cutting-edge hardware and software to produce networked electronic systems that support crucial physical and supply chain infrastructure. The startup's objective is to build solutions that defend national security and key infrastructure from cybersecurity threats.
Reality Defender: Deepfake detection
Reality Defender alerts firms to bogus users and changed audio, video, and image files. Reality Deference's API and web app score material in real time to prevent fraud, improve content moderation, and detect deception.
Micro Meat: Infrastructure for the manufacture of cell-cultured meat
MicroMeat promotes sustainable meat production. The company has created technologies to scale up bioreactor-grown meat muscle tissue from animal cells. Their goal is to scale up cultured meat manufacturing so cultivated meat products can be brought to market feasibly and swiftly, boosting worldwide meat consumption.
Fleetzero: Electric cargo ships
This startup's battery technology will make cargo ships more sustainable and profitable. Fleetzero's electric cargo ships have five times larger profit margins than fossil fuel ships. Fleetzeros' founder has marine engineering, ship operations, and enterprise sales and business experience.
You might also like

Chris Moyse
3 years ago
Sony and LEGO raise $2 billion for Epic Games' metaverse
‘Kid-friendly’ project holds $32 billion valuation
Epic Games announced today that it has raised $2 billion USD from Sony Group Corporation and KIRKBI (holding company of The LEGO Group). Both companies contributed $1 billion to Epic Games' upcoming ‘metaverse' project.
“We need partners who share our vision as we reimagine entertainment and play. Our partnership with Sony and KIRKBI has found this,” said Epic Games CEO Tim Sweeney. A new metaverse will be built where players can have fun with friends and brands create creative and immersive experiences, as well as creators thrive.
Last week, LEGO and Epic Games announced their plans to create a family-friendly metaverse where kids can play, interact, and create in digital environments. The service's users' safety and security will be prioritized.
With this new round of funding, Epic Games' project is now valued at $32 billion.
“Epic Games is known for empowering creators large and small,” said KIRKBI CEO Sren Thorup Srensen. “We invest in trends that we believe will impact the world we and our children will live in. We are pleased to invest in Epic Games to support their continued growth journey, with a long-term focus on the future metaverse.”
Epic Games is expected to unveil its metaverse plans later this year, including its name, details, services, and release date.

Jeff John Roberts
3 years ago
Jack Dorsey and Jay-Z Launch 'Bitcoin Academy' in Brooklyn rapper's home
The new Bitcoin Academy will teach Jay-Marcy Z's Houses neighbors "What is Cryptocurrency."
Jay-Z grew up in Brooklyn's Marcy Houses. The rapper and Block CEO Jack Dorsey are giving back to his hometown by creating the Bitcoin Academy.
The Bitcoin Academy will offer online and in-person classes, including "What is Money?" and "What is Blockchain?"
The program will provide participants with a mobile hotspot and a small amount of Bitcoin for hands-on learning.
Students will receive dinner and two evenings of instruction until early September. The Shawn Carter Foundation will help with on-the-ground instruction.
Jay-Z and Dorsey announced the program Thursday morning. It will begin at Marcy Houses but may be expanded.
Crypto Blockchain Plug and Black Bitcoin Billionaire, which has received a grant from Block, will teach the classes.
Jay-Z, Dorsey reunite
Jay-Z and Dorsey have previously worked together to promote a Bitcoin and crypto-based future.
In 2021, Dorsey's Block (then Square) acquired the rapper's streaming music service Tidal, which they propose using for NFT distribution.
Dorsey and Jay-Z launched an endowment in 2021 to fund Bitcoin development in Africa and India.
Dorsey is funding the new Bitcoin Academy out of his own pocket (as is Jay-Z), but he's also pushed crypto-related charitable endeavors at Block, including a $5 million fund backed by corporate Bitcoin interest.
This post is a summary. Read full article here
Matthew Royse
3 years ago
7 ways to improve public speaking
How to overcome public speaking fear and give a killer presentation

"Public speaking is people's biggest fear, according to studies. Death's second. The average person is better off in the casket than delivering the eulogy." — American comedian, actor, writer, and producer Jerry Seinfeld
People fear public speaking, according to research. Public speaking can be intimidating.
Most professions require public speaking, whether to 5, 50, 500, or 5,000 people. Your career will require many presentations. In a small meeting, company update, or industry conference.
You can improve your public speaking skills. You can reduce your anxiety, improve your performance, and feel more comfortable speaking in public.
“If I returned to college, I'd focus on writing and public speaking. Effective communication is everything.” — 38th president Gerald R. Ford
You can deliver a great presentation despite your fear of public speaking. There are ways to stay calm while speaking and become a more effective public speaker.
Seven tips to improve your public speaking today. Let's help you overcome your fear (no pun intended).
Know your audience.
"You're not being judged; the audience is." — Entrepreneur, author, and speaker Seth Godin
Understand your audience before speaking publicly. Before preparing a presentation, know your audience. Learn what they care about and find useful.
Your presentation may depend on where you're speaking. A classroom is different from a company meeting.
Determine your audience before developing your main messages. Learn everything about them. Knowing your audience helps you choose the right words, information (thought leadership vs. technical), and motivational message.
2. Be Observant
Observe others' speeches to improve your own. Watching free TED Talks on education, business, science, technology, and creativity can teach you a lot about public speaking.
What worked and what didn't?
What would you change?
Their strengths
How interesting or dull was the topic?
Note their techniques to learn more. Studying the best public speakers will amaze you.
Learn how their stage presence helped them communicate and captivated their audience. Please note their pauses, humor, and pacing.
3. Practice
"A speaker should prepare based on what he wants to learn, not say." — Author, speaker, and pastor Tod Stocker
Practice makes perfect when it comes to public speaking. By repeating your presentation, you can find your comfort zone.
When you've practiced your presentation many times, you'll feel natural and confident giving it. Preparation helps overcome fear and anxiety. Review notes and important messages.
When you know the material well, you can explain it better. Your presentation preparation starts before you go on stage.
Keep a notebook or journal of ideas, quotes, and examples. More content means better audience-targeting.
4. Self-record
Videotape your speeches. Check yourself. Body language, hands, pacing, and vocabulary should be reviewed.
Best public speakers evaluate their performance to improve.
Write down what you did best, what you could improve and what you should stop doing after watching a recording of yourself. Seeing yourself can be unsettling. This is how you improve.
5. Remove text from slides
"Humans can't read and comprehend screen text while listening to a speaker. Therefore, lots of text and long, complete sentences are bad, bad, bad.” —Communications expert Garr Reynolds
Presentation slides shouldn't have too much text. 100-slide presentations bore the audience. Your slides should preview what you'll say to the audience.
Use slides to emphasize your main point visually.
If you add text, use at least 40-point font. Your slides shouldn't require squinting to read. You want people to watch you, not your slides.
6. Body language
"Body language is powerful." We had body language before speech, and 80% of a conversation is read through the body, not the words." — Dancer, writer, and broadcaster Deborah Bull
Nonverbal communication dominates. Our bodies speak louder than words. Don't fidget, rock, lean, or pace.
Relax your body to communicate clearly and without distraction through nonverbal cues. Public speaking anxiety can cause tense body language.
Maintain posture and eye contact. Don’t put your hand in your pockets, cross your arms, or stare at your notes. Make purposeful hand gestures that match what you're saying.
7. Beginning/ending Strong
Beginning and end are memorable. Your presentation must start strong and end strongly. To engage your audience, don't sound robotic.
Begin with a story, stat, or quote. Conclude with a summary of key points. Focus on how you will start and end your speech.
You should memorize your presentation's opening and closing. Memorize something naturally. Excellent presentations start and end strong because people won't remember the middle.
Bringing It All Together
Seven simple yet powerful ways to improve public speaking. Know your audience, study others, prepare and rehearse, record yourself, remove as much text as possible from slides, and start and end strong.
Follow these tips to improve your speaking and audience communication. Prepare, practice, and learn from great speakers to reduce your fear of public speaking.
"Speaking to one person or a thousand is public speaking." — Vocal coach Roger Love