


NFT was used to serve a restraining order on an anonymous hacker.
The international law firm Holland & Knight used an NFT built and airdropped by its asset recovery team to serve a defendant in a hacking case.
The law firms Holland & Knight and Bluestone used a nonfungible token to serve a defendant in a hacking case with a temporary restraining order, marking the first documented legal process assisted by an NFT.
The so-called "service token" or "service NFT" was served to an unknown defendant in a hacking case involving LCX, a cryptocurrency exchange based in Liechtenstein that was hacked for over $8 million in January. The attack compromised the platform's hot wallets, resulting in the loss of Ether (ETH), USD Coin (USDC), and other cryptocurrencies, according to Cointelegraph at the time.
On June 7, LCX claimed that around 60% of the stolen cash had been frozen, with investigations ongoing in Liechtenstein, Ireland, Spain, and the United States. Based on a court judgment from the New York Supreme Court, Centre Consortium, a company created by USDC issuer Circle and crypto exchange Coinbase, has frozen around $1.3 million in USDC.
The monies were laundered through Tornado Cash, according to LCX, but were later tracked using "algorithmic forensic analysis." The organization was also able to identify wallets linked to the hacker as a result of the investigation.
In light of these findings, the law firms representing LCX, Holland & Knight and Bluestone, served the unnamed defendant with a temporary restraining order issued on-chain using an NFT. According to LCX, this system "was allowed by the New York Supreme Court and is an example of how innovation can bring legitimacy and transparency to a market that some say is ungovernable."
More on Web3 & Crypto

Franz Schrepf
3 years ago
What I Wish I'd Known About Web3 Before Building
Cryptoland rollercoaster

I've lost money in crypto.
Unimportant.
The real issue: I didn’t understand how.
I'm surrounded with winners. To learn more, I created my own NFTs, currency, and DAO.
Web3 is a hilltop castle. Everything is valuable, decentralized, and on-chain.
The castle is Disneyland: beautiful in images, but chaotic with lengthy lines and kids spending too much money on dressed-up animals.
When the throng and businesses are gone, Disneyland still has enchantment.

The Real Story of Web3
NFTs
Scarcity. Scarce NFTs. That's their worth.
Skull. Rare-looking!
Nonsense.
Bored Ape Yacht Club vs. my NFTs?
Marketing.
BAYC is amazing, but not for the reasons people believe. Apecoin and Otherside's art, celebrity following, and innovation? Stunning.
No other endeavor captured the zeitgeist better. Yet how long did you think it took to actually mint the NFTs?
1 hour? Maybe a week for the website?
Minting NFTs is incredibly easy. Kid-friendly. Developers are rare. Think about that next time somebody posts “DevS dO SMt!?”
NFTs will remain popular. These projects are like our Van Goghs and Monets. Still, be wary. It still uses exclusivity and wash selling like the OG art market.
Not all NFTs are art-related.
Soulbound and anonymous NFTs could offer up new use cases. Property rights, privacy-focused ID, open-source project verification. Everything.
NFTs build online trust through ownership.
We just need to evolve from the apes first.
NFTs' superpower is marketing until then.
Crypto currency
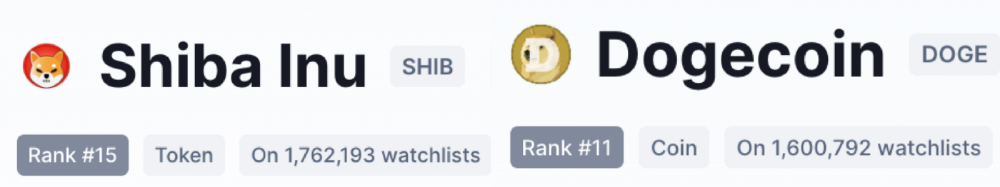
What the hell is a token?
99% of people are clueless.
So I invested in both coins and tokens. Same same. Only that they are not.
Coins have their own blockchain and developer/validator community. It's hard.
Creating a token on top of a blockchain? Five minutes.
Most consumers don’t understand the difference, creating an arbitrage opportunity: pretend you’re a serious project without having developers on your payroll.
Few market sites help. Take a look. See any tokens?
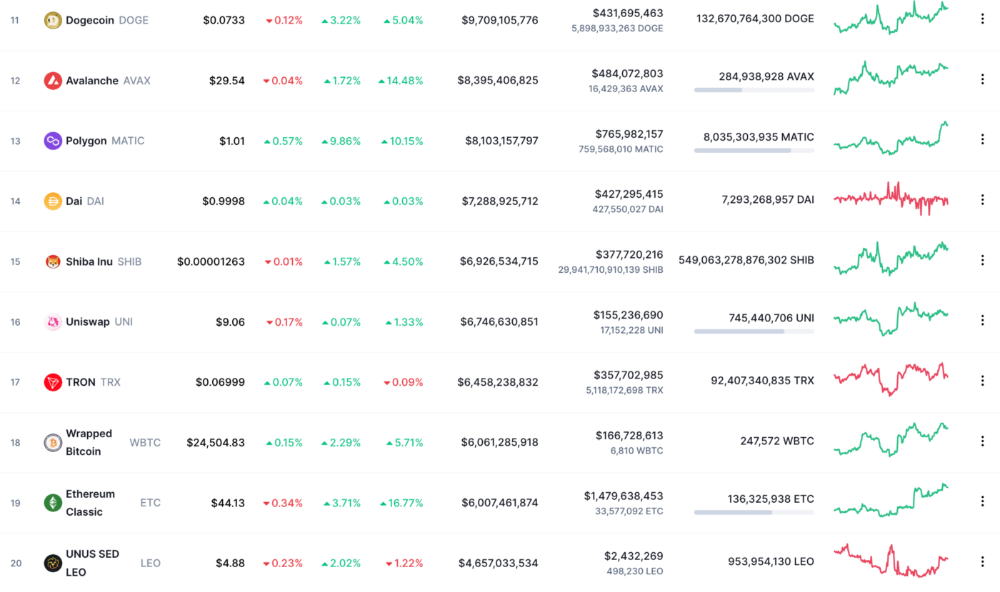
There's a hint one click deeper.
Some tokens are legitimate. Some coins are bad investments.
Tokens are utilized for DAO governance and DApp payments. Still, know who's behind a token. They might be 12 years old.
Coins take time and money. The recent LUNA meltdown indicates that currency investing requires research.
DAOs
Decentralized Autonomous Organizations (DAOs) don't work as you assume.
Yes, members can vote.
A productive organization requires more.
I've observed two types of DAOs.
Total decentralization total dysfunction
Centralized just partially. Community-driven.
A core team executes the DAO's strategy and roadmap in successful DAOs. The community owns part of the organization, votes on decisions, and holds the team accountable.
DAOs are public companies.
Amazing.
A shareholder meeting's logistics are staggering. DAOs may hold anonymous, secure voting quickly. No need for intermediaries like banks to chase up every shareholder.
Successful DAOs aren't totally decentralized. Large-scale voting and collaboration have never been easier.
And that’s all that matters.
Scale, speed.
My Web3 learnings
Disneyland is enchanting. Web3 too.
In a few cycles, NFTs may be used to build trust, not clout. Not speculating with coins. DAOs run organizations, not themselves.
Finally, some final thoughts:
NFTs will be a very helpful tool for building trust online. NFTs are successful now because of excellent marketing.
Tokens are not the same as coins. Look into any project before making a purchase. Make sure it isn't run by three 9-year-olds piled on top of one another in a trench coat, at the very least.
Not entirely decentralized, DAOs. We shall see a future where community ownership becomes the rule rather than the exception once we acknowledge this fact.
Crypto Disneyland is a rollercoaster with loops that make you sick.
Always buckle up.
Have fun!

Ajay Shrestha
2 years ago
Bitcoin's technical innovation: addressing the issue of the Byzantine generals
The 2008 Bitcoin white paper solves the classic computer science consensus problem.
Issue Statement
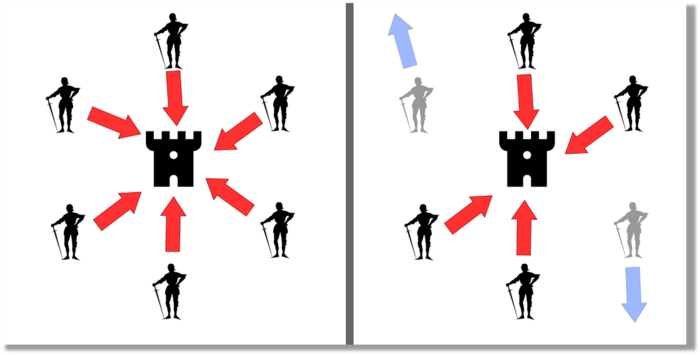
The Byzantine Generals Problem (BGP) is called after an allegory in which several generals must collaborate and attack a city at the same time to win (figure 1-left). Any general who retreats at the last minute loses the fight (figure 1-right). Thus, precise messengers and no rogue generals are essential. This is difficult without a trusted central authority.
In their 1982 publication, Leslie Lamport, Robert Shostak, and Marshall Please termed this topic the Byzantine Generals Problem to simplify distributed computer systems.
Consensus in a distributed computer network is the issue. Reaching a consensus on which systems work (and stay in the network) and which don't makes maintaining a network tough (i.e., needs to be removed from network). Challenges include unreliable communication routes between systems and mis-reporting systems.
Solving BGP can let us construct machine learning solutions without single points of failure or trusted central entities. One server hosts model parameters while numerous workers train the model. This study describes fault-tolerant Distributed Byzantine Machine Learning.
Bitcoin invented a mechanism for a distributed network of nodes to agree on which transactions should go into the distributed ledger (blockchain) without a trusted central body. It solved BGP implementation. Satoshi Nakamoto, the pseudonymous bitcoin creator, solved the challenge by cleverly combining cryptography and consensus mechanisms.
Disclaimer
This is not financial advice. It discusses a unique computer science solution.
Bitcoin
Bitcoin's white paper begins:
“A purely peer-to-peer version of electronic cash would allow online payments to be sent directly from one party to another without going through a financial institution.” Source: https://www.ussc.gov/sites/default/files/pdf/training/annual-national-training-seminar/2018/Emerging_Tech_Bitcoin_Crypto.pdf
Bitcoin's main parts:
The open-source and versioned bitcoin software that governs how nodes, miners, and the bitcoin token operate.
The native kind of token, known as a bitcoin token, may be created by mining (up to 21 million can be created), and it can be transferred between wallet addresses in the bitcoin network.
Distributed Ledger, which contains exact copies of the database (or "blockchain") containing each transaction since the first one in January 2009.
distributed network of nodes (computers) running the distributed ledger replica together with the bitcoin software. They broadcast the transactions to other peer nodes after validating and accepting them.
Proof of work (PoW) is a cryptographic requirement that must be met in order for a miner to be granted permission to add a new block of transactions to the blockchain of the cryptocurrency bitcoin. It takes the form of a valid hash digest. In order to produce new blocks on average every 10 minutes, Bitcoin features a built-in difficulty adjustment function that modifies the valid hash requirement (length of nonce). PoW requires a lot of energy since it must continually generate new hashes at random until it satisfies the criteria.
The competing parties known as miners carry out continuous computing processing to address recurrent cryptography issues. Transaction fees and some freshly minted (mined) bitcoin are the rewards they receive. The amount of hashes produced each second—or hash rate—is a measure of mining capacity.
Cryptography, decentralization, and the proof-of-work consensus method are Bitcoin's most unique features.
Bitcoin uses encryption
Bitcoin employs this established cryptography.
Hashing
digital signatures based on asymmetric encryption
Hashing (SHA-256) (SHA-256)
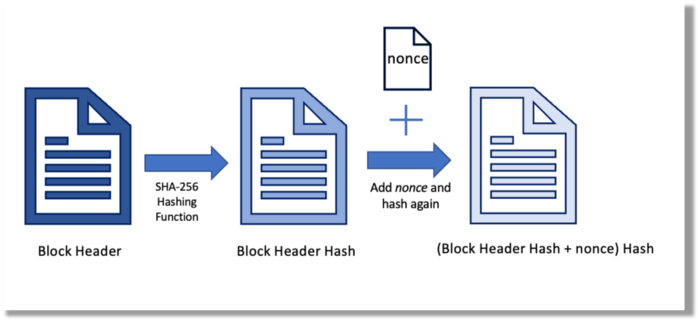
Hashing converts unique plaintext data into a digest. Creating the plaintext from the digest is impossible. Bitcoin miners generate new hashes using SHA-256 to win block rewards.
A new hash is created from the current block header and a variable value called nonce. To achieve the required hash, mining involves altering the nonce and re-hashing.
The block header contains the previous block hash and a Merkle root, which contains hashes of all transactions in the block. Thus, a chain of blocks with increasing hashes links back to the first block. Hashing protects new transactions and makes the bitcoin blockchain immutable. After a transaction block is mined, it becomes hard to fabricate even a little entry.
Asymmetric Cryptography Digital Signatures
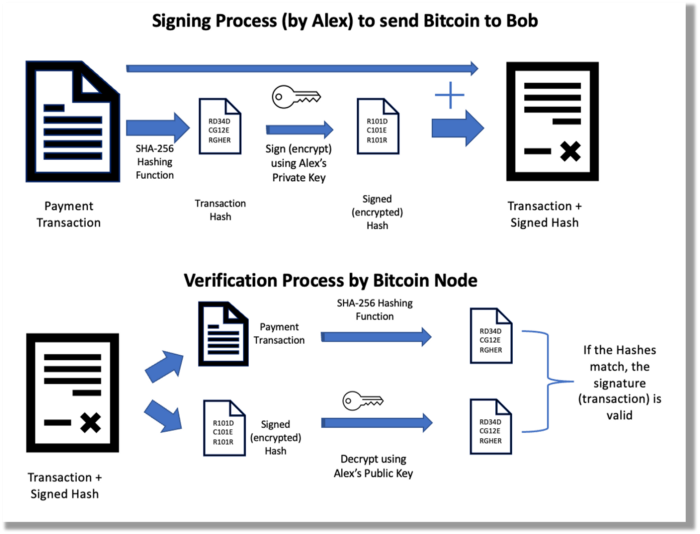
Asymmetric cryptography (public-key encryption) requires each side to have a secret and public key. Public keys (wallet addresses) can be shared with the transaction party, but private keys should not. A message (e.g., bitcoin payment record) can only be signed by the owner (sender) with the private key, but any node or anybody with access to the public key (visible in the blockchain) can verify it. Alex will submit a digitally signed transaction with a desired amount of bitcoin addressed to Bob's wallet to a node to send bitcoin to Bob. Alex alone has the secret keys to authorize that amount. Alex's blockchain public key allows anyone to verify the transaction.
Solution
Now, apply bitcoin to BGP. BGP generals resemble bitcoin nodes. The generals' consensus is like bitcoin nodes' blockchain block selection. Bitcoin software on all nodes can:
Check transactions (i.e., validate digital signatures)
2. Accept and propagate just the first miner to receive the valid hash and verify it accomplished the task. The only way to guess the proper hash is to brute force it by repeatedly producing one with the fixed/current block header and a fresh nonce value.
Thus, PoW and a dispersed network of nodes that accept blocks from miners that solve the unfalsifiable cryptographic challenge solve consensus.
Suppose:
Unreliable nodes
Unreliable miners
Bitcoin accepts the longest chain if rogue nodes cause divergence in accepted blocks. Thus, rogue nodes must outnumber honest nodes in accepting/forming the longer chain for invalid transactions to reach the blockchain. As of November 2022, 7000 coordinated rogue nodes are needed to takeover the bitcoin network.
Dishonest miners could also try to insert blocks with falsified transactions (double spend, reverse, censor, etc.) into the chain. This requires over 50% (51% attack) of miners (total computational power) to outguess the hash and attack the network. Mining hash rate exceeds 200 million (source). Rewards and transaction fees encourage miners to cooperate rather than attack. Quantum computers may become a threat.
Visit my Quantum Computing post.
Quantum computers—what are they? Quantum computers will have a big influence. towardsdatascience.com
Nodes have more power than miners since they can validate transactions and reject fake blocks. Thus, the network is secure if honest nodes are the majority.
Summary
Table 1 compares three Byzantine Generals Problem implementations.
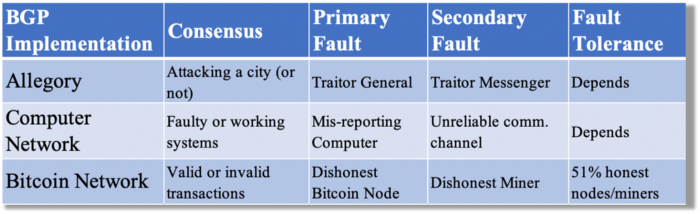
Bitcoin white paper and implementation solved the consensus challenge of distributed systems without central governance. It solved the illusive Byzantine Generals Problem.
Resources
Resources
Source-code for Bitcoin Core Software — https://github.com/bitcoin/bitcoin
Bitcoin white paper — https://bitcoin.org/bitcoin.pdf
https://www.microsoft.com/en-us/research/publication/byzantine-generals-problem/
https://www.microsoft.com/en-us/research/uploads/prod/2016/12/The-Byzantine-Generals-Problem.pdf
Genuinely Distributed Byzantine Machine Learning, El-Mahdi El-Mhamdi et al., 2020. ACM, New York, NY, https://doi.org/10.1145/3382734.3405695
Elnaz Sarraf
3 years ago
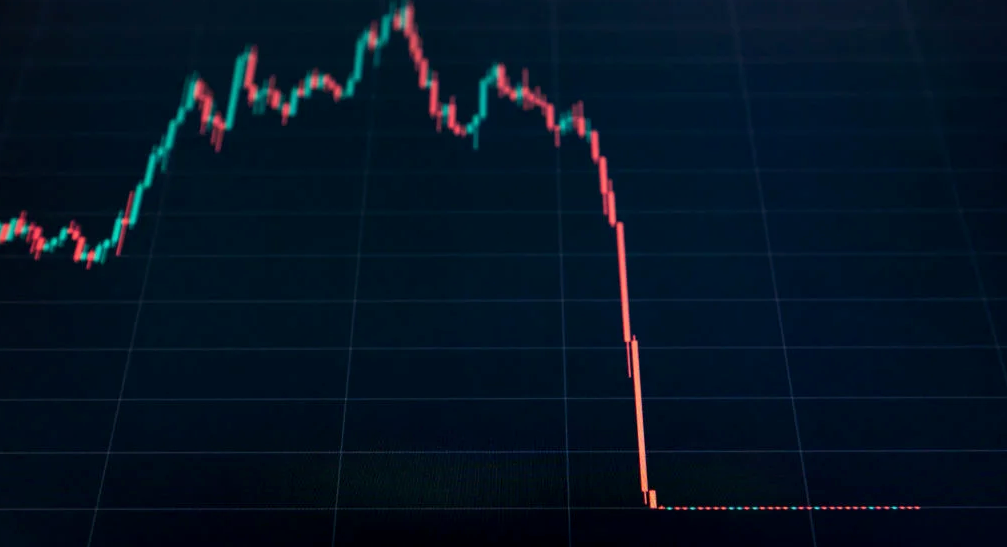
Why Bitcoin's Crash Could Be Good for Investors

The crypto market crashed in June 2022. Bitcoin and other cryptocurrencies hit their lowest prices in over a year, causing market panic. Some believe this crash will benefit future investors.
Before I discuss how this crash might help investors, let's examine why it happened. Inflation in the U.S. reached a 30-year high in 2022 after Russia invaded Ukraine. In response, the U.S. Federal Reserve raised interest rates by 0.5%, the most in almost 20 years. This hurts cryptocurrencies like Bitcoin. Higher interest rates make people less likely to invest in volatile assets like crypto, so many investors sold quickly.
The crypto market collapsed. Bitcoin, Ethereum, and Binance dropped 40%. Other cryptos crashed so hard they were delisted from almost every exchange. Bitcoin peaked in April 2022 at $41,000, but after the May interest rate hike, it crashed to $28,000. Bitcoin investors were worried. Even in bad times, this crash is unprecedented.
Bitcoin wasn't "doomed." Before the crash, LUNA was one of the top 5 cryptos by market cap. LUNA was trading around $80 at the start of May 2022, but after the rate hike?
Less than 1 cent. LUNA lost 99.99% of its value in days and was removed from every crypto exchange. Bitcoin's "crash" isn't as devastating when compared to LUNA.
Many people said Bitcoin is "due" for a LUNA-like crash and that the only reason it hasn't crashed is because it's bigger. Still false. If so, Bitcoin should be worth zero by now. We didn't. Instead, Bitcoin reached 28,000, then 29k, 30k, and 31k before falling to 18k. That's not the world's greatest recovery, but it shows Bitcoin's safety.
Bitcoin isn't falling constantly. It fell because of the initial shock of interest rates, but not further. Now, Bitcoin's value is more likely to rise than fall. Bitcoin's low price also attracts investors. They know what prices Bitcoin can reach with enough hype, and they want to capitalize on low prices before it's too late.

Bitcoin's crash was bad, but in a way it wasn't. To understand, consider 2021. In March 2021, Bitcoin surpassed $60k for the first time. Elon Musk's announcement in May that he would no longer support Bitcoin caused a massive crash in the crypto market. In May 2017, Bitcoin's price hit $29,000. Elon Musk's statement isn't worth more than the Fed raising rates. Many expected this big announcement to kill Bitcoin.

Not so. Bitcoin crashed from $58k to $31k in 2021. Bitcoin fell from $41k to $28k in 2022. This crash is smaller. Bitcoin's price held up despite tensions and stress, proving investors still believe in it. What happened after the initial crash in the past?
Bitcoin fell until mid-July. This is also something we’re not seeing today. After a week, Bitcoin began to improve daily. Bitcoin's price rose after mid-July. Bitcoin's price fluctuated throughout the rest of 2021, but it topped $67k in November. Despite no major changes, the peak occurred after the crash. Elon Musk seemed uninterested in crypto and wasn't likely to change his mind soon. What triggered this peak? Nothing, really. What really happened is that people got over the initial statement. They forgot.
Internet users have goldfish-like attention spans. People quickly forgot the crash's cause and were back investing in crypto months later. Despite the market's setbacks, more crypto investors emerged by the end of 2017. Who gained from these peaks? Bitcoin investors who bought low. Bitcoin not only recovered but also doubled its ROI. It was like a movie, and it shows us what to expect from Bitcoin in the coming months.
The current Bitcoin crash isn't as bad as the last one. LUNA is causing market panic. LUNA and Bitcoin are different cryptocurrencies. LUNA crashed because Terra wasn’t able to keep its peg with the USD. Bitcoin is unanchored. It's one of the most decentralized investments available. LUNA's distrust affected crypto prices, including Bitcoin, but it won't last forever.
This is why Bitcoin will likely rebound in the coming months. In 2022, people will get over the rise in interest rates and the crash of LUNA, just as they did with Elon Musk's crypto stance in 2021. When the world moves on to the next big controversy, Bitcoin's price will soar.
Bitcoin may recover for another reason. Like controversy, interest rates fluctuate. The Russian invasion caused this inflation. World markets will stabilize, prices will fall, and interest rates will drop.
Next, lower interest rates could boost Bitcoin's price. Eventually, it will happen. The U.S. economy can't sustain such high interest rates. Investors will put every last dollar into Bitcoin if interest rates fall again.
Bitcoin has proven to be a stable investment. This boosts its investment reputation. Even if Ethereum dethrones Bitcoin as crypto king one day (or any other crypto, for that matter). Bitcoin may stay on top of the crypto ladder for a while. We'll have to wait a few months to see if any of this is true.
This post is a summary. Read the full article here.
You might also like

Alex Mathers
3 years ago
8 guidelines to help you achieve your objectives 5x fast

If you waste time every day, even though you're ambitious, you're not alone.
Many of us could use some new time-management strategies, like these:
Focus on the following three.
You're thinking about everything at once.
You're overpowered.
It's mental. We just have what's in front of us. So savor the moment's beauty.
Prioritize 1-3 things.
To be one of the most productive people you and I know, follow these steps.
Get along with boredom.
Many of us grow bored, sweat, and turn on Netflix.
We shout, "I'm rarely bored!" Look at me! I'm happy.
Shut it, Sally.
You're not making wonderful things for the world. Boredom matters.
If you can sit with it for a second, you'll get insight. Boredom? Breathe.
Go blank.
Then watch your creativity grow.
Check your MacroVision once more.
We don't know what to do with our time, which contributes to time-wasting.
Nobody does, either. Jeff Bezos won't hand-deliver that crap to you.
Daily vision checks are required.
Also:
What are 5 things you'd love to create in the next 5 years?
You're soul-searching. It's food.
Return here regularly, and you'll adore the high you get from doing valuable work.
Improve your thinking.
What's Alex's latest nonsense?
I'm talking about overcoming our own thoughts. Worrying wastes so much time.
Too many of us are assaulted by lies, myths, and insecurity.
Stop letting your worries massage you into a worried coma like a Thai woman.
Optimizing your thoughts requires accepting what you can't control.
It means letting go of unhelpful thoughts and returning to the moment.
Keep your blood sugar level.
I gave up gluten, donuts, and sweets.
This has really boosted my energy.
Blood-sugar-spiking carbs make us irritable and tired.
These day-to-day ups and downs aren't productive. It's crucial.
Know how your diet affects insulin levels. Now I have more energy and can do more without clenching my teeth.
Reduce harmful carbs to boost energy.
Create a focused setting for yourself.
When we optimize the mind, we have more energy and use our time better because we're not tense.
Changing our environment can also help us focus. Disabling alerts is one example.
Too hot makes me procrastinate and irritable.
List five items that hinder your productivity.
You may be amazed at how much you may improve by removing distractions.
Be responsible.
Accountability is a time-saver.
Creating an emotional pull to finish things.
Writing down our goals makes us accountable.
We can engage a coach or work with an accountability partner to feel horrible if we don't show up and finish on time.
‘Hey Jake, I’m going to write 1000 words every day for 30 days — you need to make sure I do.’ ‘Sure thing, Nathan, I’ll be making sure you check in daily with me.’
Tick.
You might also blog about your ambitions to show your dedication.
Now you can't hide when you promised to appear.
Acquire a liking for bravery.
Boldness changes everything.
I sometimes feel lazy and wonder why. If my food and sleep are in order, I should assess my footing.
Most of us live backward. Doubtful. Uncertain. Feelings govern us.
Backfooting isn't living. It's lame, and you'll soon melt. Live boldly now.
Be assertive.
Get disgustingly into everything. Expand.
Even if it's hard, stop being a b*tch.
Those that make Mr. Bold Bear their spirit animal benefit. Save time to maximize your effect.

Frederick M. Hess
2 years ago
The Lessons of the Last Two Decades for Education Reform
My colleague Ilana Ovental and I examined pandemic media coverage of education at the end of last year. That analysis examined coverage changes. We tracked K-12 topic attention over the previous two decades using Lexis Nexis. See the results here.
I was struck by how cleanly the past two decades can be divided up into three (or three and a half) eras of school reform—a framing that can help us comprehend where we are and how we got here. In a time when epidemic, political unrest, frenetic news cycles, and culture war can make six months seem like a lifetime, it's worth pausing for context.
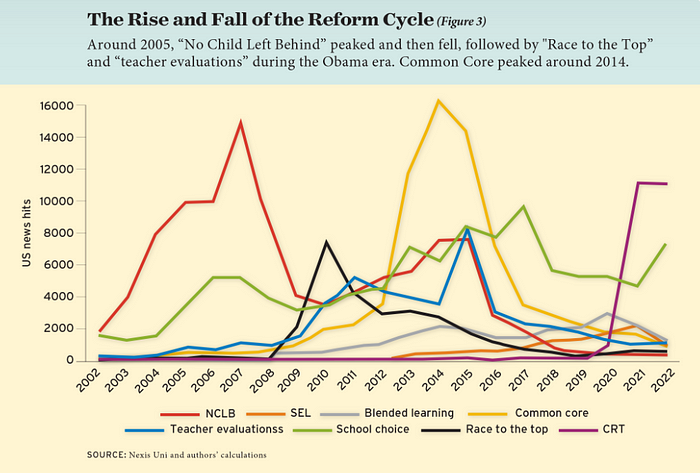
If you look at the peaks in the above graph, the 21st century looks to be divided into periods. The decade-long rise and fall of No Child Left Behind began during the Bush administration. In a few years, NCLB became the dominant K-12 framework. Advocates and financiers discussed achievement gaps and measured success with AYP.
NCLB collapsed under the weight of rigorous testing, high-stakes accountability, and a race to the bottom by the Obama years. Obama's Race to the Top garnered attention, but its most controversial component, the Common Core State Standards, rose quickly.
Academic standards replaced assessment and accountability. New math, fiction, and standards were hotly debated. Reformers and funders chanted worldwide benchmarking and systems interoperability.
We went from federally driven testing and accountability to government encouraged/subsidized/mandated (pick your verb) reading and math standardization. Last year, Checker Finn and I wrote The End of School Reform? The 2010s populist wave thwarted these objectives. The Tea Party, Occupy Wall Street, Black Lives Matter, and Trump/MAGA all attacked established institutions.
Consequently, once the Common Core fell, no alternative program emerged. Instead, school choice—the policy most aligned with populist suspicion of institutional power—reached a half-peak. This was less a case of choice erupting to prominence than of continuous growth in a vacuum. Even with Betsy DeVos' determined, controversial efforts, school choice received only half the media attention that NCLB and Common Core did at their heights.
Recently, culture clash-fueled attention to race-based curriculum and pedagogy has exploded (all playing out under the banner of critical race theory). This third, culture war-driven wave may not last as long as the other waves.
Even though I don't understand it, the move from slow-building policy debate to fast cultural confrontation over two decades is notable. I don't know if it's cyclical or permanent, or if it's about schooling, media, public discourse, or all three.
One final thought: After doing this work for decades, I've noticed how smoothly advocacy groups, associations, and other activists adapt to the zeitgeist. In 2007, mission statements focused on accomplishment disparities. Five years later, they promoted standardization. Language has changed again.
Part of this is unavoidable and healthy. Chasing currents can also make companies look unprincipled, promote scepticism, and keep them spinning the wheel. Bearing in mind that these tides ebb and flow may give educators, leaders, and activists more confidence to hold onto their values and pause when they feel compelled to follow the crowd.

Glorin Santhosh
3 years ago
In his final days, Steve Jobs sent an email to himself. What It Said Was This
An email capturing Steve Jobs's philosophy.

Steve Jobs may have been the most inspired and driven entrepreneur.
He worked on projects because he wanted to leave a legacy.
Steve Jobs' final email to himself encapsulated his philosophy.
After his death from pancreatic cancer in October 2011, Laurene Powell Jobs released the email. He was 56.
Read: Steve Jobs by Walter Isaacson (#BestSeller)
The Email:
September 2010 Steve Jobs email:
“I grow little of the food I eat, and of the little I do grow, I do not breed or perfect the seeds.” “I do not make my own clothing. I speak a language I did not invent or refine,” he continued. “I did not discover the mathematics I use… I am moved by music I did not create myself.”
Jobs ended his email by reflecting on how others created everything he uses.
He wrote:
“When I needed medical attention, I was helpless to help myself survive.”
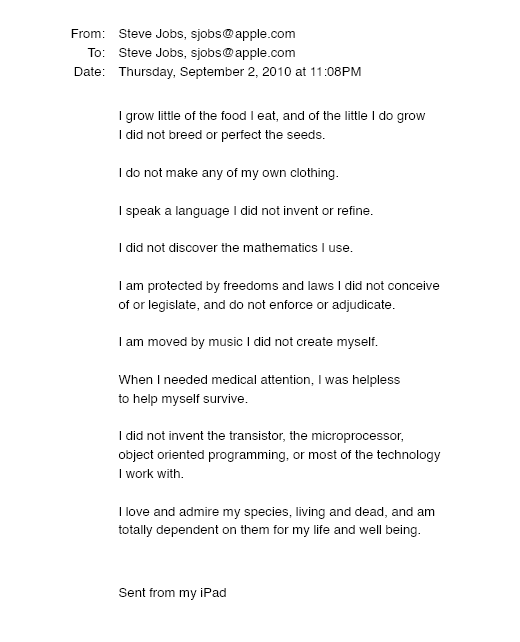
The Apple co-founder concluded by praising humanity.
“I did not invent the transistor, the microprocessor, object-oriented programming, or most of the technology I work with. I love and admire my species, living and dead, and am totally dependent on them for my life and well-being,” he concluded.
The email was made public as a part of the Steve Jobs Archive, a website that was launched in tribute to his legacy.
Steve Jobs' widow founded the internet archive. Apple CEO Tim Cook and former design leader Jony Ive were prominent guests.
Steve Jobs has always inspired because he shows how even the best can be improved.
High expectations were always there, and they were consistently met.
We miss him because he was one of the few with lifelong enthusiasm and persona.