


A quick guide to formatting your text on INTΞGRITY
[06/20/2022 update] We have now implemented a powerful text editor, but you can still use markdown.
Markdown:
Headers
SYNTAX:
# This is a heading 1
## This is a heading 2
### This is a heading 3
#### This is a heading 4
RESULT:
This is a heading 1
This is a heading 2
This is a heading 3
This is a heading 4
Emphasis
SYNTAX:
**This text will be bold**
~~Strikethrough~~
*You **can** combine them*
RESULT:
This text will be italic
This text will be bold
You can combine them
Images
SYNTAX:

RESULT:
Videos
SYNTAX:
https://www.youtube.com/watch?v=7KXGZAEWzn0
RESULT:
Links
SYNTAX:
[Int3grity website](https://www.int3grity.com)
RESULT:
Tweets
SYNTAX:
https://twitter.com/samhickmann/status/1503800505864130561
RESULT:
Blockquotes
SYNTAX:
> Human beings face ever more complex and urgent problems, and their effectiveness in dealing with these problems is a matter that is critical to the stability and continued progress of society. \- Doug Engelbart, 1961
RESULT:
Human beings face ever more complex and urgent problems, and their effectiveness in dealing with these problems is a matter that is critical to the stability and continued progress of society. - Doug Engelbart, 1961
Inline code
SYNTAX:
Text inside `backticks` on a line will be formatted like code.
RESULT:
Text inside backticks on a line will be formatted like code.
Code blocks
SYNTAX:
'''js
function fancyAlert(arg) {
  if(arg) {
    $.facebox({div:'#foo'})
  }
}
'''
RESULT:
function fancyAlert(arg) {
if(arg) {
$.facebox({div:'#foo'})
}
}
Maths
We support LaTex to typeset math. We recommend reading the full documentation on the official website
SYNTAX:
$$[x^n+y^n=z^n]$$
RESULT:
[x^n+y^n=z^n]
Tables
SYNTAX:
| header a | header b |
| ---- | ---- |
| row 1 col 1 | row 1 col 2 |
RESULT:
| header a | header b | header c |
|---|---|---|
| row 1 col 1 | row 1 col 2 | row 1 col 3 |
(Edited)
More on Web3 & Crypto
Olga Kharif
3 years ago
A month after freezing customer withdrawals, Celsius files for bankruptcy.
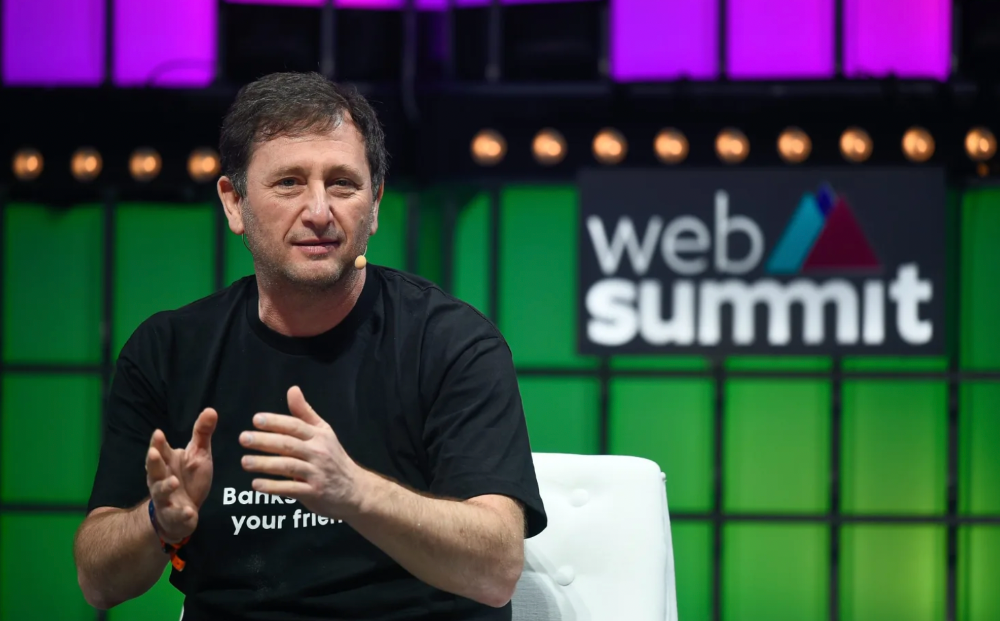
Alex Mashinsky, CEO of Celsius, speaks at Web Summit 2021 in Lisbon.
Celsius Network filed for Chapter 11 bankruptcy a month after freezing customer withdrawals, joining other crypto casualties.
Celsius took the step to stabilize its business and restructure for all stakeholders. The filing was done in the Southern District of New York.
The company, which amassed more than $20 billion by offering 18% interest on cryptocurrency deposits, paused withdrawals and other functions in mid-June, citing "extreme market conditions."
As the Fed raises interest rates aggressively, it hurts risk sentiment and squeezes funding costs. Voyager Digital Ltd. filed for Chapter 11 bankruptcy this month, and Three Arrows Capital has called in liquidators.
Celsius called the pause "difficult but necessary." Without the halt, "the acceleration of withdrawals would have allowed certain customers to be paid in full while leaving others to wait for Celsius to harvest value from illiquid or longer-term asset deployment activities," it said.
Celsius declined to comment. CEO Alex Mashinsky said the move will strengthen the company's future.
The company wants to keep operating. It's not requesting permission to allow customer withdrawals right now; Chapter 11 will handle customer claims. The filing estimates assets and liabilities between $1 billion and $10 billion.
Celsius is advised by Kirkland & Ellis, Centerview Partners, and Alvarez & Marsal.
Yield-promises
Celsius promised 18% returns on crypto loans. It lent those coins to institutional investors and participated in decentralized-finance apps.
When TerraUSD (UST) and Luna collapsed in May, Celsius pulled its funds from Terra's Anchor Protocol, which offered 20% returns on UST deposits. Recently, another large holding, staked ETH, or stETH, which is tied to Ether, became illiquid and discounted to Ether.
The lender is one of many crypto companies hurt by risky bets in the bear market. Also, Babel halted withdrawals. Voyager Digital filed for bankruptcy, and crypto hedge fund Three Arrows Capital filed for Chapter 15 bankruptcy.
According to blockchain data and tracker Zapper, Celsius repaid all of its debt in Aave, Compound, and MakerDAO last month.
Celsius charged Symbolic Capital Partners Ltd. 2,000 Ether as collateral for a cash loan on June 13. According to company filings, Symbolic was charged 2,545.25 Ether on June 11.
In July 6 filings, it said it reshuffled its board, appointing two new members and firing others.

Caleb Naysmith
3 years ago Draft
A Myth: Decentralization
It’s simply not conceivable, or at least not credible.
One of the most touted selling points of Crypto has always been this grandiose idea of decentralization. Bitcoin first arose in 2009 after the housing crisis and subsequent crash that came with it. It aimed to solve this supposed issue of centralization. Nobody “owns” Bitcoin in theory, so the idea then goes that it won’t be subject to the same downfalls that led to the 2008 crash or similarly speculative events that led to the 2008 disaster. The issue is the banks, not the human nature associated with the greedy individuals running them.
Subsequent blockchains have attempted to fix many of the issues of Bitcoin by increasing capacity, decreasing the costs and processing times associated with Bitcoin, and expanding what can be done with their blockchains. Since nobody owns Bitcoin, it hasn’t really been able to be expanded on. You have people like Vitalk Buterin, however, that actively work on Ethereum though.
The leap from Bitcoin to Ethereum was a massive leap toward centralization, and the trend has only gotten worse. In fact, crypto has since become almost exclusively centralized in recent years.
Decentralization is only good in theory
It’s a good idea. In fact, it’s a wonderful idea. However, like other utopian societies, individuals misjudge human nature and greed. In a perfect world, decentralization would certainly be a wonderful idea because sure, people may function as their own banks, move payments immediately, remain anonymous, and so on. However, underneath this are a couple issues:
You can already send money instantaneously today.
They are not decentralized.
Decentralization is a bad idea.
Being your own bank is a stupid move.
Let’s break these down. Some are quite simple, but lets have a look.
Sending money right away
One thing with crypto is the idea that you can send payments instantly. This has pretty much been entirely solved in current times. You can transmit significant sums of money instantly for a nominal cost and it’s instantaneously cleared. Venmo was launched in 2009 and has since increased to prominence, and currently is on most people's phones. I can directly send ANY amount of money quickly from my bank to another person's Venmo account.
Comparing that with ETH and Bitcoin, Venmo wins all around. I can send money to someone for free instantly in dollars and the only fee paid is optional depending on when you want it.
Both Bitcoin and Ethereum are subject to demand. If the blockchains have a lot of people trying to process transactions fee’s go up, and the time that it takes to receive your crypto takes longer. When Ethereum gets bad, people have reported spending several thousand of dollars on just 1 transaction.
These transactions take place via “miners” bundling and confirming transactions, then recording them on the blockchain to confirm that the transaction did indeed happen. They charge fees to do this and are also paid in Bitcoin/ETH. When a transaction is confirmed, it's then sent to the other users wallet. This within itself is subject to lots of controversy because each transaction needs to be confirmed 6 times, this takes massive amounts of power, and most of the power is wasted because this is an adversarial system in which the person that mines the transaction gets paid, and everyone else is out of luck. Also, these could theoretically be subject to a “51% attack” in which anyone with over 51% of the mining hash rate could effectively control all of the transactions, and reverse transactions while keeping the BTC resulting in “double spending”.
There are tons of other issues with this, but essentially it means: They rely on these third parties to confirm the transactions. Without people confirming these transactions, Bitcoin stalls completely, and if anyone becomes too dominant they can effectively control bitcoin.
Not to mention, these transactions are in Bitcoin and ETH, not dollars. So, you need to convert them to dollars still, and that's several more transactions, and likely to take several days anyway as the centralized exchange needs to send you the money by traditional methods.
They are not distributed
That takes me to the following point. This isn’t decentralized, at all. Bitcoin is the closest it gets because Satoshi basically closed it to new upgrades, although its still subject to:
Whales
Miners
It’s vital to realize that these are often the same folks. While whales aren’t centralized entities typically, they can considerably effect the price and outcome of Bitcoin. If the largest wallets holding as much as 1 million BTC were to sell, it’d effectively collapse the price perhaps beyond repair. However, Bitcoin can and is pretty much controlled by the miners. Further, Bitcoin is more like an oligarchy than decentralized. It’s been effectively used to make the rich richer, and both the mining and price is impacted by the rich. The overwhelming minority of those actually using it are retail investors. The retail investors are basically never the ones generating money from it either.
As far as ETH and other cryptos go, there is realistically 0 case for them being decentralized. Vitalik could not only kill it but even walking away from it would likely lead to a significant decline. It has tons of issues right now that Vitalik has promised to fix with the eventual Ethereum 2.0., and stepping away from it wouldn’t help.
Most tokens as well are generally tied to some promise of future developments and creators. The same is true for most NFT projects. The reason 99% of crypto and NFT projects fail is because they failed to deliver on various promises or bad dev teams, or poor innovation, or the founders just straight up stole from everyone. I could go more in-depth than this but go find any project and if there is a dev team, company, or person tied to it then it's likely, not decentralized. The success of that project is directly tied to the dev team, and if they wanted to, most hold large wallets and could sell it all off effectively killing the project. Not to mention, any crypto project that doesn’t have a locked contract can 100% be completely rugged and they can run off with all of the money.
Decentralization is undesirable
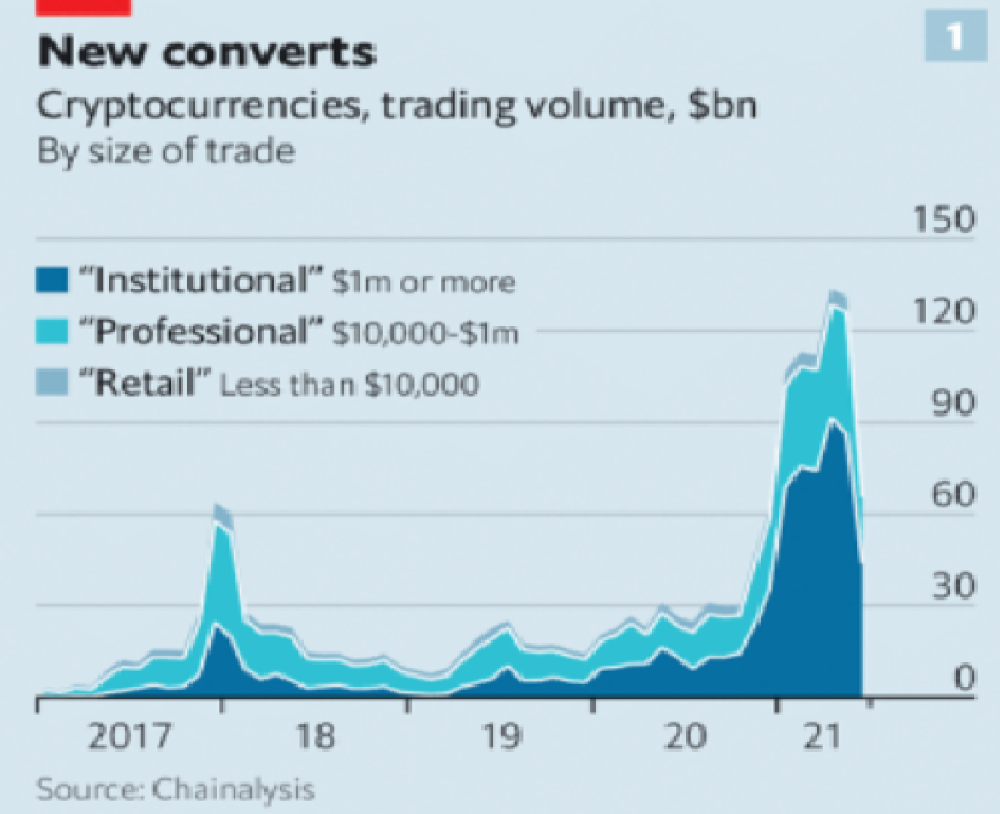
Even if they were decentralized then it would not be a good thing. The graphic above indicates this is effectively a rich person’s unregulated playground… so it’s exactly like… the very issue it tried to solve?
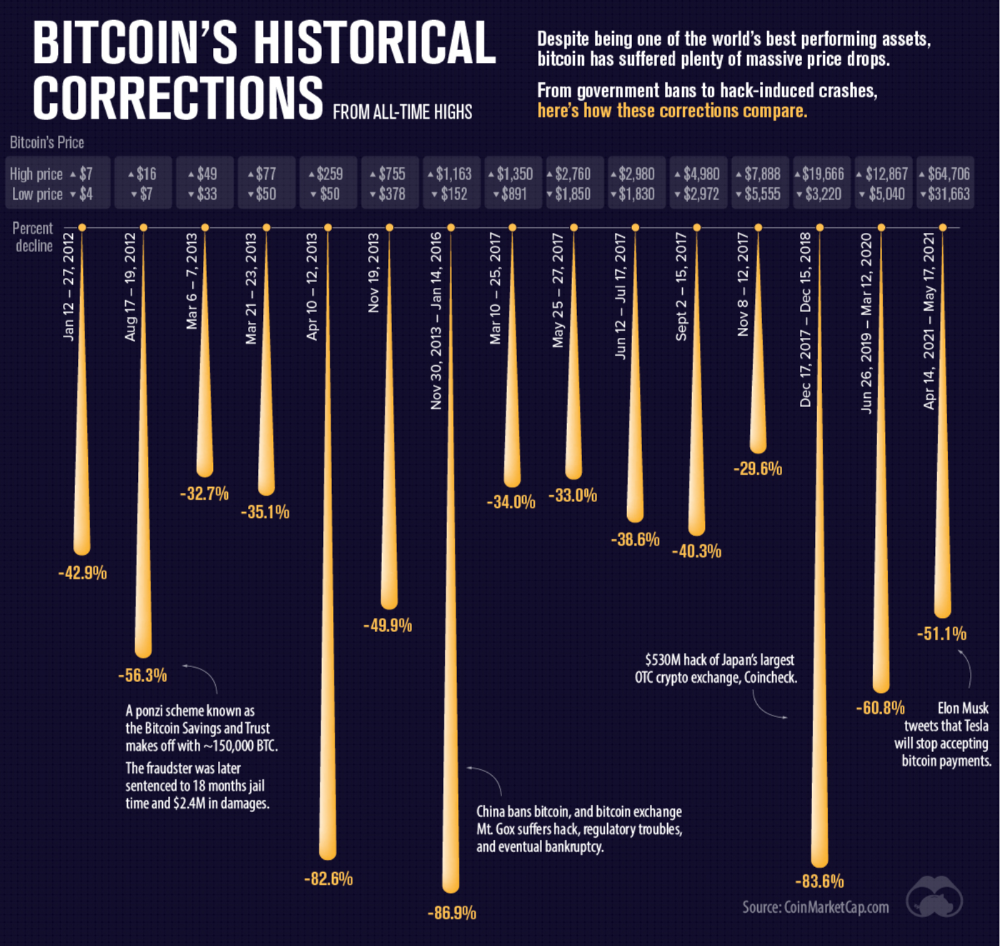
Not to mention, it’s supposedly meant to prevent things like 2008, but is regularly subjected to 50–90% drawdowns in value? Back when Bitcoin was only known in niche parts of the dark web and illegal markets, it would regularly drop as much as 90% and has a long history of massive drawdowns.
The majority of crypto is blatant scams, and ALL of crypto is a “zero” or “negative” sum game in that it relies on the next person buying for people to make money. This is not a good thing. This has yet to solve any issues around what caused the 2008 crisis. Rather, it seemingly amplified all of the bad parts of it actually. Crypto is the ultimate speculative asset and realistically has no valuation metric. People invest in Apple because it has revenue and cash on hand. People invest in crypto purely for speculation. The lack of regulation or accountability means this is amplified to the most extreme degree where anything goes: Fraud, deception, pump and dumps, scams, etc. This results in a pure speculative madhouse where, unsurprisingly, only the rich win. Not only that but the deck is massively stacked in against the everyday investor because you can’t do a pump and dump without money.
At the heart of all of this is still the same issues: greed and human nature. However, in setting out to solve the issues that allowed 2008 to happen, they made something that literally took all of the bad parts of 2008 and then amplified it. 2008, similarly, was due to greed and human nature but was allowed to happen due to lack of oversite, rich people's excessive leverage over the poor, and excessive speculation. Crypto trades SOLELY on human emotion, has 0 oversite, is pure speculation, and the power dynamic is just as bad or worse.
Why should each individual be their own bank?
This is the last one, and it's short and basic. Why do we want people functioning as their own bank? Everything we do relies on another person. Without the internet, and internet providers there is no crypto. We don’t have people functioning as their own home and car manufacturers or internet service providers. Sure, you might specialize in some of these things, but masquerading as your own bank is a horrible idea.
I am not in the banking industry so I don’t know all the issues with banking. Most people aren’t in banking or crypto, so they don’t know the ENDLESS scams associated with it, and they are bound to lose their money eventually.
If you appreciate this article and want to read more from me and authors like me, without any limits, consider buying me a coffee: buymeacoffee.com/calebnaysmith
:max_bytes(150000):strip_icc():gifv():format(webp)/reiff_headshot-5bfc2a60c9e77c00519a70bd.jpg)
Nathan Reiff
3 years ago
Howey Test and Cryptocurrencies: 'Every ICO Is a Security'
What Is the Howey Test?
To determine whether a transaction qualifies as a "investment contract" and thus qualifies as a security, the Howey Test refers to the U.S. Supreme Court cass: the Securities Act of 1933 and the Securities Exchange Act of 1934. According to the Howey Test, an investment contract exists when "money is invested in a common enterprise with a reasonable expectation of profits from others' efforts."
The test applies to any contract, scheme, or transaction. The Howey Test helps investors and project backers understand blockchain and digital currency projects. ICOs and certain cryptocurrencies may be found to be "investment contracts" under the test.
Understanding the Howey Test
The Howey Test comes from the 1946 Supreme Court case SEC v. W.J. Howey Co. The Howey Company sold citrus groves to Florida buyers who leased them back to Howey. The company would maintain the groves and sell the fruit for the owners. Both parties benefited. Most buyers had no farming experience and were not required to farm the land.
The SEC intervened because Howey failed to register the transactions. The court ruled that the leaseback agreements were investment contracts.
This established four criteria for determining an investment contract. Investing contract:
- An investment of money
- n a common enterprise
- With the expectation of profit
- To be derived from the efforts of others
In the case of Howey, the buyers saw the transactions as valuable because others provided the labor and expertise. An income stream was obtained by only investing capital. As a result of the Howey Test, the transaction had to be registered with the SEC.
Howey Test and Cryptocurrencies
Bitcoin is notoriously difficult to categorize. Decentralized, they evade regulation in many ways. Regardless, the SEC is looking into digital assets and determining when their sale qualifies as an investment contract.
The SEC claims that selling digital assets meets the "investment of money" test because fiat money or other digital assets are being exchanged. Like the "common enterprise" test.
Whether a digital asset qualifies as an investment contract depends on whether there is a "expectation of profit from others' efforts."
For example, buyers of digital assets may be relying on others' efforts if they expect the project's backers to build and maintain the digital network, rather than a dispersed community of unaffiliated users. Also, if the project's backers create scarcity by burning tokens, the test is met. Another way the "efforts of others" test is met is if the project's backers continue to act in a managerial role.
These are just a few examples given by the SEC. If a project's success is dependent on ongoing support from backers, the buyer of the digital asset is likely relying on "others' efforts."
Special Considerations
If the SEC determines a cryptocurrency token is a security, many issues arise. It means the SEC can decide whether a token can be sold to US investors and forces the project to register.
In 2017, the SEC ruled that selling DAO tokens for Ether violated federal securities laws. Instead of enforcing securities laws, the SEC issued a warning to the cryptocurrency industry.
Due to the Howey Test, most ICOs today are likely inaccessible to US investors. After a year of ICOs, then-SEC Chair Jay Clayton declared them all securities.
SEC Chairman Gensler Agrees With Predecessor: 'Every ICO Is a Security'
Howey Test FAQs
How Do You Determine If Something Is a Security?
The Howey Test determines whether certain transactions are "investment contracts." Securities are transactions that qualify as "investment contracts" under the Securities Act of 1933 and the Securities Exchange Act of 1934.
The Howey Test looks for a "investment of money in a common enterprise with a reasonable expectation of profits from others' efforts." If so, the Securities Act of 1933 and the Securities Exchange Act of 1934 require disclosure and registration.
Why Is Bitcoin Not a Security?
Former SEC Chair Jay Clayton clarified in June 2018 that bitcoin is not a security: "Cryptocurrencies: Replace the dollar, euro, and yen with bitcoin. That type of currency is not a security," said Clayton.
Bitcoin, which has never sought public funding to develop its technology, fails the SEC's Howey Test. However, according to Clayton, ICO tokens are securities.
A Security Defined by the SEC
In the public and private markets, securities are fungible and tradeable financial instruments. The SEC regulates public securities sales.
The Supreme Court defined a security offering in SEC v. W.J. Howey Co. In its judgment, the court defines a security using four criteria:
- An investment contract's existence
- The formation of a common enterprise
- The issuer's profit promise
- Third-party promotion of the offering
Read original post.
You might also like

James White
3 years ago
Ray Dalio suggests reading these three books in 2022.
An inspiring reading list
I'm no billionaire or hedge-fund manager. My bank account doesn't have millions. Ray Dalio's love of reading motivates me to think differently.
Here are some books recommended by Ray Dalio. Each influenced me. Hope they'll help you.
Sapiens by Yuval Noah Harari
Page Count: 512
Rating on Goodreads: 4.39
My favorite nonfiction book.
Sapiens explores human evolution. It explains how Homo Sapiens developed from hunter-gatherers to a dominant species. Amazing!
Sapiens will teach you about human history. Yuval Noah Harari has a follow-up book on human evolution.
My favorite book quotes are:
The tendency for luxuries to turn into necessities and give rise to new obligations is one of history's few unbreakable laws.
Happiness is not dependent on material wealth, physical health, or even community. Instead, it depends on how closely subjective expectations and objective circumstances align.
The romantic comparison between today's industry, which obliterates the environment, and our forefathers, who coexisted well with nature, is unfounded. Homo sapiens held the record among all organisms for eradicating the most plant and animal species even before the Industrial Revolution. The unfortunate distinction of being the most lethal species in the history of life belongs to us.
The Power Of Habit by Charles Duhigg
Page Count: 375
Rating on Goodreads: 4.13
Great book: The Power Of Habit. It illustrates why habits are everything. The book explains how healthier habits can improve your life, career, and society.
The Power of Habit rocks. It's a great book on productivity. Its suggestions helped me build healthier behaviors (and drop bad ones).
Read ASAP!
My favorite book quotes are:
Change may not occur quickly or without difficulty. However, almost any behavior may be changed with enough time and effort.
People who exercise begin to eat better and produce more at work. They are less smokers and are more patient with friends and family. They claim to feel less anxious and use their credit cards less frequently. A fundamental habit that sparks broad change is exercise.
Habits are strong but also delicate. They may develop independently of our awareness or may be purposefully created. They frequently happen without our consent, but they can be altered by changing their constituent pieces. They have a much greater influence on how we live than we realize; in fact, they are so powerful that they cause our brains to adhere to them above all else, including common sense.
Tribe Of Mentors by Tim Ferriss
Page Count: 561
Rating on Goodreads: 4.06
Unusual book structure. It's worth reading if you want to learn from successful people.
The book is Q&A-style. Tim questions everyone. Each chapter features a different person's life-changing advice. In the book, Pressfield, Willink, Grylls, and Ravikant are interviewed.
Amazing!
My favorite book quotes are:
According to one's courage, life can either get smaller or bigger.
Don't engage in actions that you are aware are immoral. The reputation you have with yourself is all that constitutes self-esteem. Always be aware.
People mistakenly believe that focusing means accepting the task at hand. However, that is in no way what it represents. It entails rejecting the numerous other worthwhile suggestions that exist. You must choose wisely. Actually, I'm just as proud of the things we haven't accomplished as I am of what I have. Saying no to 1,000 things is what innovation is.

Anton Franzen
3 years ago
This is the driving force for my use of NFTs, which will completely transform the world.
Its not a fuc*ing fad.

It's not about boring monkeys or photos as nfts; that's just what's been pushed up and made a lot of money. The technology underlying those ridiculous nft photos will one day prove your house and automobile ownership and tell you where your banana came from. Are you ready for web3? Soar!
People don't realize that absolutely anything can and will be part of the blockchain and smart contracts, making them even better. I'll tell you a secret: it will and is happening.
Why?
Why is something blockchain-based a good idea? So let’s speak about cars!
So a new Tesla car is manufactured, and when you buy it, it is bound to an NFT on the blockchain that proves current ownership. The NFT in the smart contract can contain some data about the current owner of the car and some data about the car's status, such as the number of miles driven, the car's overall quality, and so on, as well as a reference to a digital document bound to the NFT that has more information.
Now, 40 years from now, if you want to buy a used automobile, you can scan the car's serial number to view its NFT and see all of its history, each owner, how long they owned it, if it had damages, and more. Since it's on the blockchain, it can't be tampered with.
When you're ready to buy it, the owner posts it for sale, you buy it, and it's sent to your wallet. 5 seconds to change owner, 100% safe and verifiable.
Incorporate insurance logic into the car contract. If you crashed, your car's smart contract would take money from your insurance contract and deposit it in an insurance company wallet.
It's limitless. Your funds may be used by investors to provide insurance as they profit from everyone's investments.
Or suppose all car owners in a country deposit a fixed amount of money into an insurance smart contract that promises if something happens, we'll take care of it. It could be as little as $100-$500 per year, and in a country with 10 million people, maybe 3 million would do that, which would be $500 000 000 in that smart contract and it would be used by the insurance company to invest in assets or take a cut, literally endless possibilities.
Instead of $300 per month, you may pay $300 per year to be covered if something goes wrong, and that may include multiple insurances.
What about your grocery store banana, though?
Yes that too.
You can scan a banana to learn its complete history. You'll be able to see where it was cultivated, every middleman in the supply chain, and hopefully the banana's quality, farm, and ingredients used.
If you want locally decent bananas, you can only buy them, offering you transparency and options. I believe it will be an online marketplace where farmers publish their farms and products for trust and transparency. You might also buy bananas from the farmer.
And? Food security to finish the article. If an order of bananas included a toxin, you could easily track down every banana from the same origin and supply chain and uncover the root cause. This is a tremendous thing that will save lives and have a big impact; did you realize that 1 in 6 Americans gets poisoned by food every year? This could lower the number.
To summarize:
Smart contracts can issue nfts as proof of ownership and include functionality.

Charlie Brown
3 years ago
What Happens When You Sell Your House, Never Buying It Again, Reverse the American Dream
Homeownership isn't the only life pattern.

Want to irritate people?
My party trick is to say I used to own a house but no longer do.
I no longer wish to own a home, not because I lost it or because I'm moving.
It was a long-term plan. It was more deliberate than buying a home. Many people are committed for this reason.
Poppycock.
Anyone who told me that owning a house (or striving to do so) is a must is wrong.
Because, URGH.
One pattern for life is to own a home, but there are millions of others.
You can afford to buy a home? Go, buddy.
You think you need 1,000 square feet (or more)? You think it's non-negotiable in life?
Nope.
It's insane that society forces everyone to own real estate, regardless of income, wants, requirements, or situation. As if this trade brings happiness, stability, and contentment.
Take it from someone who thought this for years: drywall isn't happy. Living your way brings contentment.
That's in real estate. It may also be renting a small apartment in a city that makes your soul sing, but you can't afford the downpayment or mortgage payments.
Living or traveling abroad is difficult when your life savings are connected to something that eats your money the moment you sign.
#vanlife, which seems like torment to me, makes some people feel alive.
I've seen co-living, vacation rental after holiday rental, living with family, and more work.
Insisting that home ownership is the only path in life is foolish and reduces alternative options.
How little we question homeownership is a disgrace.
No one challenges a homebuyer's motives. We congratulate them, then that's it.
When you offload one, you must answer every question, even if you have a loose screw.
Why do you want to sell?
Do you have any concerns about leaving the market?
Why would you want to renounce what everyone strives for?
Why would you want to abandon a beautiful place like that?
Why would you mismanage your cash in such a way?
But surely it's only temporary? RIGHT??
Incorrect questions. Buying a property requires several inquiries.
The typical American has $4500 saved up. When something goes wrong with the house (not if, it’s never if), can you actually afford the repairs?
Are you certain that you can examine a home in less than 15 minutes before committing to buying it outright and promising to pay more than twice the asking price on a 30-year 7% mortgage?
Are you certain you're ready to leave behind friends, family, and the services you depend on in order to acquire something?
Have you thought about the connotation that moving to a suburb, which more than half of Americans do, means you will be dependent on a car for the rest of your life?
Plus:
Are you sure you want to prioritize home ownership over debt, employment, travel, raising kids, and daily routines?
Homeownership entails that. This ex-homeowner says it will rule your life from the time you put the key in the door.
This isn't questioned. We don't question enough. The holy home-ownership grail was set long ago, and we don't challenge it.
Many people question after signing the deeds. 70% of homeowners had at least one regret about buying a property, including the expense.
Exactly. Tragic.
Homes are different from houses
We've been fooled into thinking home ownership will make us happy.
Some may agree. No one.
Bricks and brick hindered me from living the version of my life that made me most comfortable, happy, and steady.
I'm spending the next month in a modest apartment in southern Spain. Even though it's late November, today will be 68 degrees. My spouse and I will soon meet his visiting parents. We'll visit a Sherry store. We'll eat, nap, walk, and drink Sherry. Writing. Jerez means flamenco.
That's my home. This is such a privilege. Living a fulfilling life brings me the contentment that buying a home never did.
I'm happy and comfortable knowing I can make almost all of my days good. Rejecting home ownership is partly to blame.
I'm broke like most folks. I had to choose between home ownership and comfort. I said, I didn't find them together.
Feeling at home trumps owning brick-and-mortar every day.
The following is the reality of what it's like to turn the American Dream around.
Leaving the housing market.
Sometimes I wish I owned a home.
I miss having my own yard and bed. My kitchen, cookbooks, and pizza oven are missed.
But I rarely do.
Someone else's life plan pushed home ownership on me. I'm grateful I figured it out at 35. Many take much longer, and some never understand homeownership stinks (for them).
It's confusing. People will think you're dumb or suicidal.
If you read what I write, you'll know. You'll realize that all you've done is choose to live intentionally. Find a home beyond four walls and a picket fence.
Miss? As I said, they're not home. If it were, a pizza oven, a good mattress, and a well-stocked kitchen would bring happiness.
No.
If you can afford a house and desire one, more power to you.
There are other ways to discover home. Find calm and happiness. For fun.
For it, look deeper than your home's foundation.