


More on Web3 & Crypto
David Z. Morris
3 years ago
FTX's crash was no accident, it was a crime
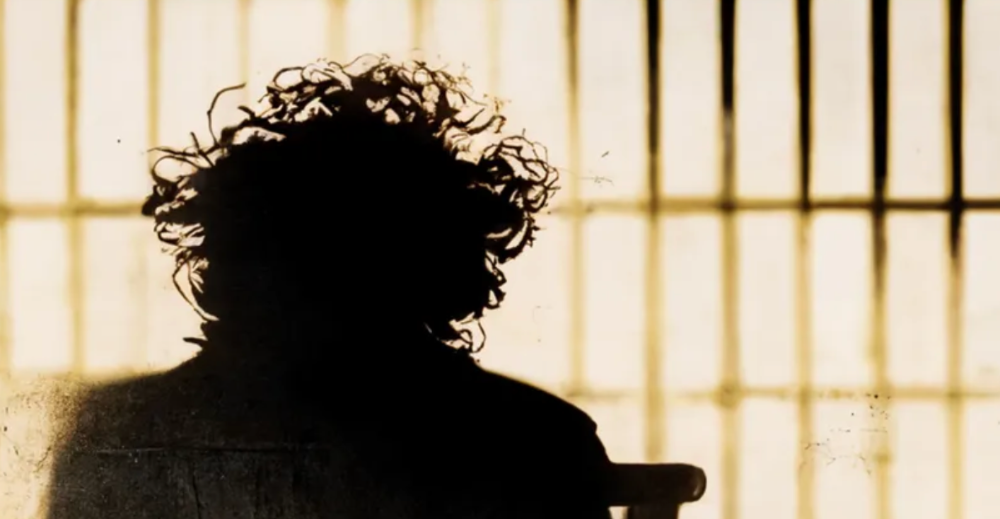
Sam Bankman Fried (SDBF) is a legendary con man. But the NYT might not tell you that...
Since SBF's empire was revealed to be a lie, mainstream news organizations and commentators have failed to give readers a straightforward assessment. The New York Times and Wall Street Journal have uncovered many key facts about the scandal, but they have also soft-peddled Bankman-Fried's intent and culpability.
It's clear that the FTX crypto exchange and Alameda Research committed fraud to steal money from users and investors. That’s why a recent New York Times interview was widely derided for seeming to frame FTX’s collapse as the result of mismanagement rather than malfeasance. A Wall Street Journal article lamented FTX's loss of charitable donations, bolstering Bankman's philanthropic pose. Matthew Yglesias, court chronicler of the neoliberal status quo, seemed to whitewash his own entanglements by crediting SBF's money with helping Democrats in 2020 – sidestepping the likelihood that the money was embezzled.
Many outlets have called what happened to FTX a "bank run" or a "run on deposits," but Bankman-Fried insists the company was overleveraged and disorganized. Both attempts to frame the fallout obscure the core issue: customer funds misused.
Because banks lend customer funds to generate returns, they can experience "bank runs." If everyone withdraws at once, they can experience a short-term cash crunch but there won't be a long-term problem.
Crypto exchanges like FTX aren't banks. They don't do bank-style lending, so a withdrawal surge shouldn't strain liquidity. FTX promised customers it wouldn't lend or use their crypto.
Alameda's balance sheet blurs SBF's crypto empire.
The funds were sent to Alameda Research, where they were apparently gambled away. This is massive theft. According to a bankruptcy document, up to 1 million customers could be affected.
In less than a month, reporting and the bankruptcy process have uncovered a laundry list of decisions and practices that would constitute financial fraud if FTX had been a U.S.-regulated entity, even without crypto-specific rules. These ploys may be litigated in U.S. courts if they enabled the theft of American property.
The list is very, very long.
The many crimes of Sam Bankman-Fried and FTX
At the heart of SBF's fraud are the deep and (literally) intimate ties between FTX and Alameda Research, a hedge fund he co-founded. An exchange makes money from transaction fees on user assets, but Alameda trades and invests its own funds.
Bankman-Fried called FTX and Alameda "wholly separate" and resigned as Alameda's CEO in 2019. The two operations were closely linked. Bankman-Fried and Alameda CEO Caroline Ellison were romantically linked.
These circumstances enabled SBF's sin. Within days of FTX's first signs of weakness, it was clear the exchange was funneling customer assets to Alameda for trading, lending, and investing. Reuters reported on Nov. 12 that FTX sent $10 billion to Alameda. As much as $2 billion was believed to have disappeared after being sent to Alameda. Now the losses look worse.
It's unclear why those funds were sent to Alameda or when Bankman-Fried betrayed his depositors. On-chain analysis shows most FTX to Alameda transfers occurred in late 2021, and bankruptcy filings show both lost $3.7 billion in 2021.
SBF's companies lost millions before the 2022 crypto bear market. They may have stolen funds before Terra and Three Arrows Capital, which killed many leveraged crypto players.
FTT loans and prints
CoinDesk's report on Alameda's FTT holdings ignited FTX and Alameda Research. FTX created this instrument, but only a small portion was traded publicly; FTX and Alameda held the rest. These holdings were illiquid, meaning they couldn't be sold at market price. Bankman-Fried valued its stock at the fictitious price.
FTT tokens were reportedly used as collateral for loans, including FTX loans to Alameda. Close ties between FTX and Alameda made the FTT token harder or more expensive to use as collateral, reducing the risk to customer funds.
This use of an internal asset as collateral for loans between clandestinely related entities is similar to Enron's 1990s accounting fraud. These executives served 12 years in prison.
Alameda's margin liquidation exemption
Alameda Research had a "secret exemption" from FTX's liquidation and margin trading rules, according to legal filings by FTX's new CEO.
FTX, like other crypto platforms and some equity or commodity services, offered "margin" or loans for trades. These loans are usually collateralized, meaning borrowers put up other funds or assets. If a margin trade loses enough money, the exchange will sell the user's collateral to pay off the initial loan.
Keeping asset markets solvent requires liquidating bad margin positions. Exempting Alameda would give it huge advantages while exposing other FTX users to hidden risks. Alameda could have kept losing positions open while closing out competitors. Alameda could lose more on FTX than it could pay back, leaving a hole in customer funds.
The exemption is criminal in multiple ways. FTX was fraudulently marketed overall. Instead of a level playing field, there were many customers.
Above them all, with shotgun poised, was Alameda Research.
Alameda front-running FTX listings
Argus says there's circumstantial evidence that Alameda Research had insider knowledge of FTX's token listing plans. Alameda was able to buy large amounts of tokens before the listing and sell them after the price bump.
If true, these claims would be the most brazenly illegal of Alameda and FTX's alleged shenanigans. Even if the tokens aren't formally classified as securities, insider trading laws may apply.
In a similar case this year, an OpenSea employee was charged with wire fraud for allegedly insider trading. This employee faces 20 years in prison for front-running monkey JPEGs.
Huge loans to executives
Alameda Research reportedly lent FTX executives $4.1 billion, including massive personal loans. Bankman-Fried received $1 billion in personal loans and $2.3 billion for an entity he controlled, Paper Bird. Nishad Singh, director of engineering, was given $543 million, and FTX Digital Markets co-CEO Ryan Salame received $55 million.
FTX has more smoking guns than a Texas shooting range, but this one is the smoking bazooka – a sign of criminal intent. It's unclear how most of the personal loans were used, but liquidators will have to recoup the money.
The loans to Paper Bird were even more worrisome because they created another related third party to shuffle assets. Forbes speculates that some Paper Bird funds went to buy Binance's FTX stake, and Paper Bird committed hundreds of millions to outside investments.
FTX Inner Circle: Who's Who
That included many FTX-backed VC funds. Time will tell if this financial incest was criminal fraud. It fits Bankman-pattern Fried's of using secret flows, leverage, and funny money to inflate asset prices.
FTT or loan 'bailouts'
Also. As the crypto bear market continued in 2022, Bankman-Fried proposed bailouts for bankrupt crypto lenders BlockFi and Voyager Digital. CoinDesk was among those deceived, welcoming SBF as a J.P. Morgan-style sector backstop.
In a now-infamous interview with CNBC's "Squawk Box," Bankman-Fried referred to these decisions as bets that may or may not pay off.
But maybe not. Bloomberg's Matt Levine speculated that FTX backed BlockFi with FTT money. This Monopoly bailout may have been intended to hide FTX and Alameda liabilities that would have been exposed if BlockFi went bankrupt sooner. This ploy has no name, but it echoes other corporate frauds.
Secret bank purchase
Alameda Research invested $11.5 million in the tiny Farmington State Bank, doubling its net worth. As a non-U.S. entity and an investment firm, Alameda should have cleared regulatory hurdles before acquiring a U.S. bank.
In the context of FTX, the bank's stake becomes "ominous." Alameda and FTX could have done more shenanigans with bank control. Compare this to the Bank for Credit and Commerce International's failed attempts to buy U.S. banks. BCCI was even nefarious than FTX and wanted to buy U.S. banks to expand its money-laundering empire.
The mainstream's mistakes
These are complex and nuanced forms of fraud that echo traditional finance models. This obscurity helped Bankman-Fried masquerade as an honest player and likely kept coverage soft after the collapse.
Bankman-Fried had a scruffy, nerdy image, like Mark Zuckerberg and Adam Neumann. In interviews, he spoke nonsense about an industry full of jargon and complicated tech. Strategic donations and insincere ideological statements helped him gain political and social influence.
SBF' s'Effective' Altruism Blew Up FTX
Bankman-Fried has continued to muddy the waters with disingenuous letters, statements, interviews, and tweets since his con collapsed. He's tried to portray himself as a well-intentioned but naive kid who made some mistakes. This is a softer, more pernicious version of what Trump learned from mob lawyer Roy Cohn. Bankman-Fried doesn't "deny, deny, deny" but "confuse, evade, distort."
It's mostly worked. Kevin O'Leary, who plays an investor on "Shark Tank," repeats Bankman-SBF's counterfactuals. O'Leary called Bankman-Fried a "savant" and "probably one of the most accomplished crypto traders in the world" in a Nov. 27 interview with Business Insider, despite recent data indicating immense trading losses even when times were good.
O'Leary's status as an FTX investor and former paid spokesperson explains his continued affection for Bankman-Fried despite contradictory evidence. He's not the only one promoting Bankman-Fried. The disgraced son of two Stanford law professors will defend himself at Wednesday's DealBook Summit.
SBF's fraud and theft rival those of Bernie Madoff and Jho Low. Whether intentionally or through malign ineptitude, the fraud echoes Worldcom and Enron.
The Perverse Impacts of Anti-Money-Laundering
The principals in all of those scandals wound up either sentenced to prison or on the run from the law. Sam Bankman-Fried clearly deserves to share their fate.
Read the full article here.

Ren & Heinrich
3 years ago
200 DeFi Projects were examined. Here is what I learned.
I analyze the top 200 DeFi crypto projects in this article.
This isn't a study. The findings benefit crypto investors.
Let’s go!
A set of data
I analyzed data from defillama.com. In my analysis, I used the top 200 DeFis by TVL in October 2022.
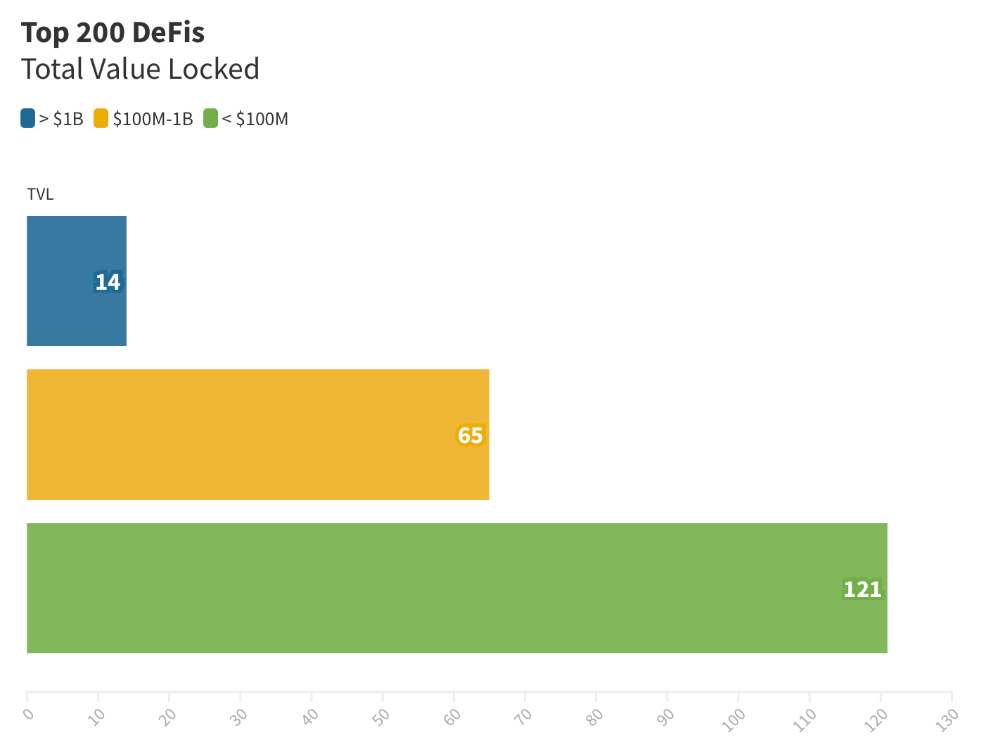
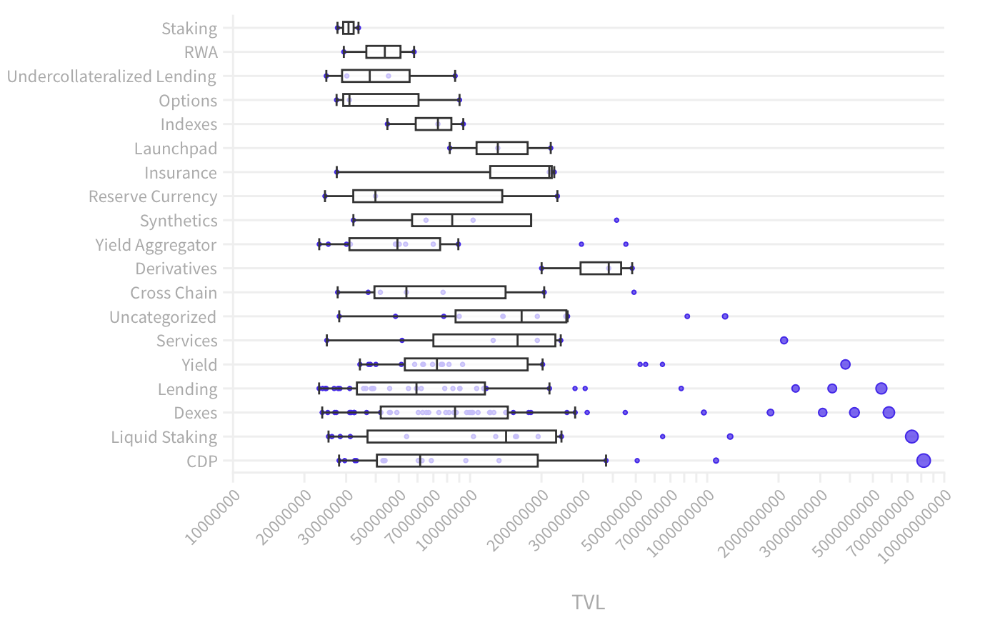
Total Locked Value
The chart below shows platform-specific locked value.
14 platforms had $1B+ TVL. 65 platforms have $100M-$1B TVL. The remaining 121 platforms had TVLs below $100 million, with the lowest being $23 million.
TVLs are distributed Pareto. Top 40% of DeFis account for 80% of TVLs.
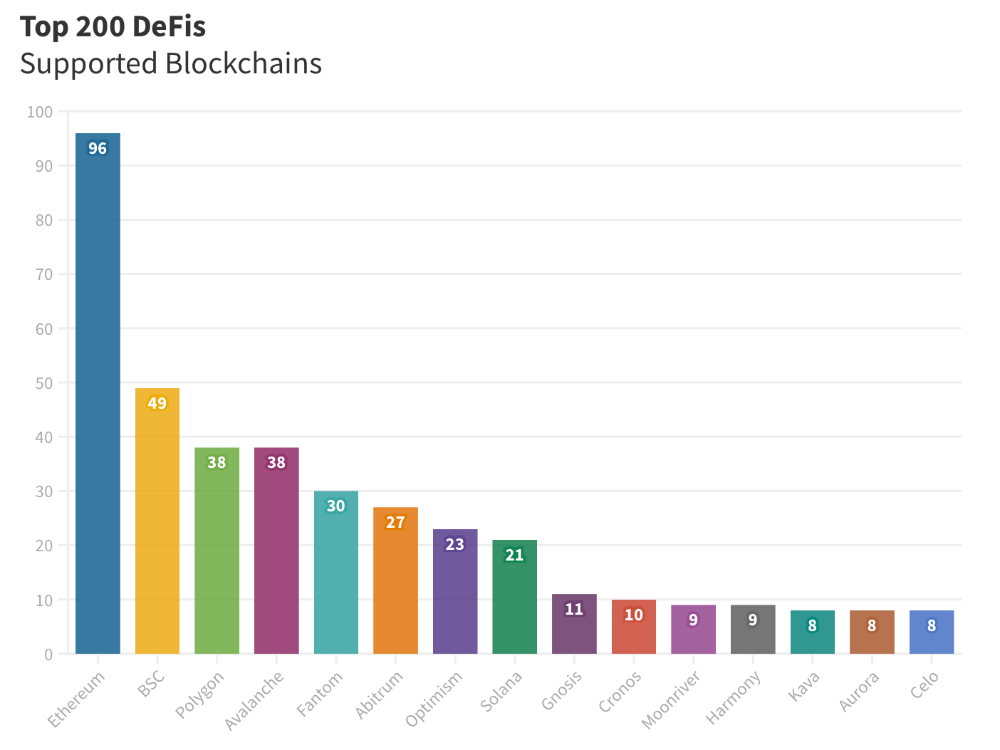
Compliant Blockchains
Ethereum's blockchain leads DeFi. 96 of the examined projects offer services on Ethereum. Behind BSC, Polygon, and Avalanche.
Five platforms used 10+ blockchains. 36 between 2-10 159 used 1 blockchain.
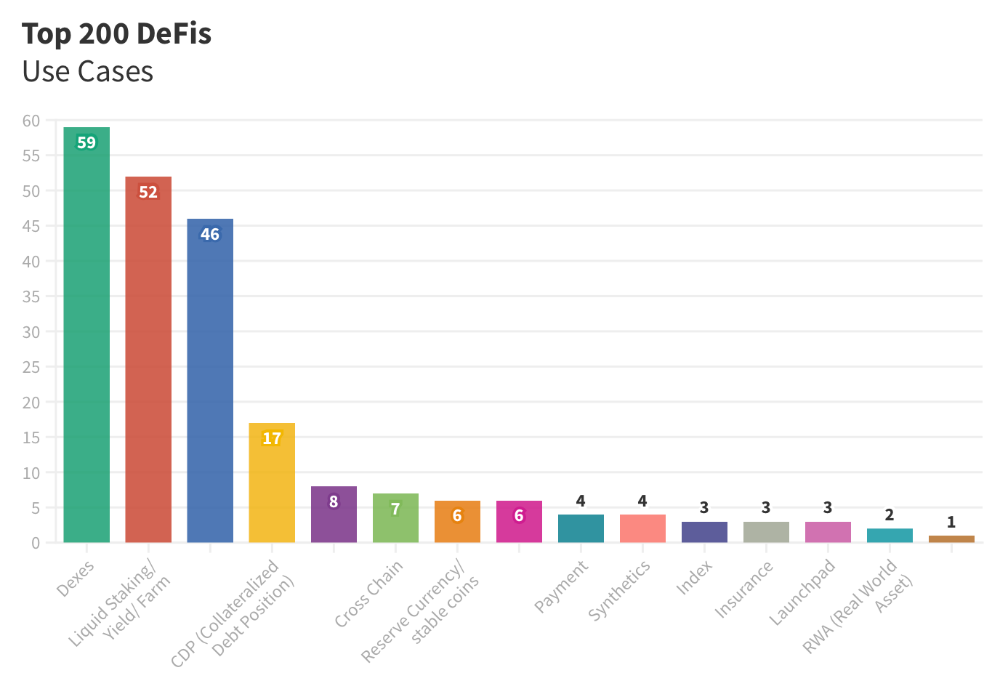
Use Cases for DeFi
The chart below shows platform use cases. Each platform has decentralized exchanges, liquid staking, yield farming, and lending.
These use cases are DefiLlama's main platform features.
Which use case costs the most? Chart explains. Collateralized debt, liquid staking, dexes, and lending have high TVLs.
The DeFi Industry
I compared three high-TVL platforms (Maker DAO, Balancer, AAVE). The columns show monthly TVL and token price changes. The graph shows monthly Bitcoin price changes.
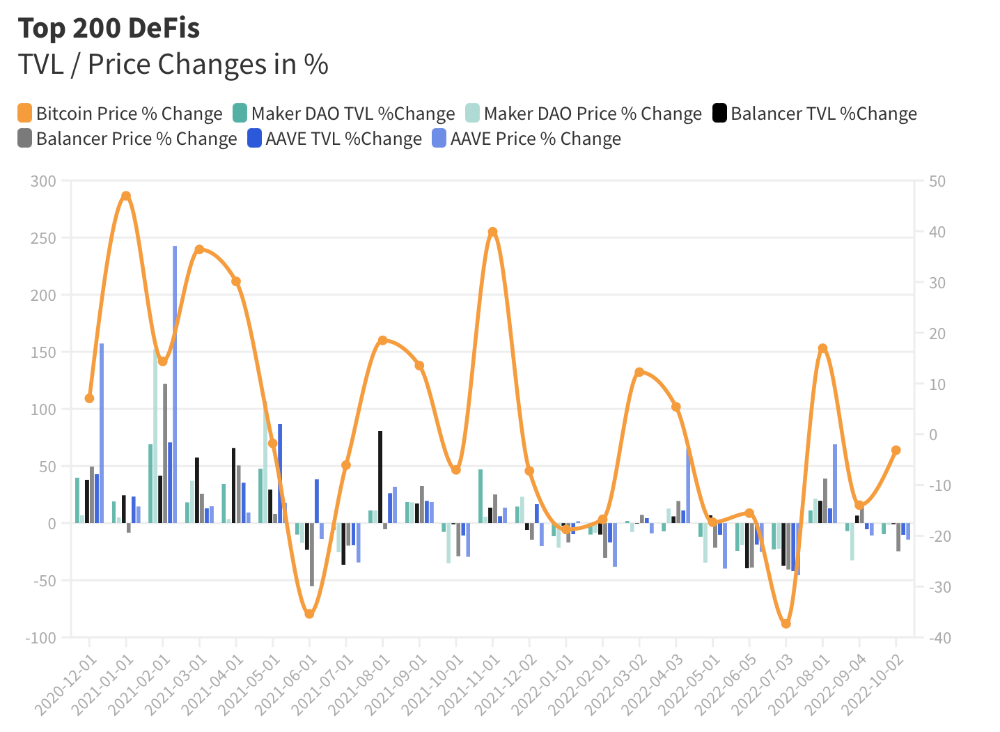
Each platform's market moves similarly.
Probably because most DeFi deposits are cryptocurrencies. Since individual currencies are highly correlated with Bitcoin, it's not surprising that they move in unison.
Takeaways
This analysis shows that the most common DeFi services (decentralized exchanges, liquid staking, yield farming, and lending) also have the highest average locked value.
Some projects run on one or two blockchains, while others use 15 or 20. Our analysis shows that a project's blockchain count has no correlation with its success.
It's hard to tell if certain use cases are rising. Bitcoin's price heavily affects the entire DeFi market.
TVL seems to be a good indicator of a DeFi platform's success and quality. Higher TVL platforms are cheaper. They're a better long-term investment because they gain or lose less value than DeFis with lower TVLs.

Sam Bourgi
3 years ago
DAOs are legal entities in Marshall Islands.
The Pacific island state recognizes decentralized autonomous organizations.
The Republic of the Marshall Islands has recognized decentralized autonomous organizations (DAOs) as legal entities, giving collectively owned and managed blockchain projects global recognition.
The Marshall Islands' amended the Non-Profit Entities Act 2021 that now recognizes DAOs, which are blockchain-based entities governed by self-organizing communities. Incorporating Admiralty LLC, the island country's first DAO, was made possible thanks to the amendement. MIDAO Directory Services Inc., a domestic organization established to assist DAOs in the Marshall Islands, assisted in the incorporation.
The new law currently allows any DAO to register and operate in the Marshall Islands.
“This is a unique moment to lead,” said Bobby Muller, former Marshall Islands chief secretary and co-founder of MIDAO. He believes DAOs will help create “more efficient and less hierarchical” organizations.
A global hub for DAOs, the Marshall Islands hopes to become a global hub for DAO registration, domicile, use cases, and mass adoption. He added:
"This includes low-cost incorporation, a supportive government with internationally recognized courts, and a technologically open environment."
According to the World Bank, the Marshall Islands is an independent island state in the Pacific Ocean near the Equator. To create a blockchain-based cryptocurrency that would be legal tender alongside the US dollar, the island state has been actively exploring use cases for digital assets since at least 2018.
In February 2018, the Marshall Islands approved the creation of a new cryptocurrency, Sovereign (SOV). As expected, the IMF has criticized the plan, citing concerns that a digital sovereign currency would jeopardize the state's financial stability. They have also criticized El Salvador, the first country to recognize Bitcoin (BTC) as legal tender.
Marshall Islands senator David Paul said the DAO legislation does not pose the same issues as a government-backed cryptocurrency. “A sovereign digital currency is financial and raises concerns about money laundering,” . This is more about giving DAOs legal recognition to make their case to regulators, investors, and consumers.
You might also like

Jari Roomer
3 years ago
5 ways to never run out of article ideas
“Perfectionism is the enemy of the idea muscle. " — James Altucher

Writer's block is a typical explanation for low output. Success requires productivity.
In four years of writing, I've never had writer's block. And you shouldn't care.
You'll never run out of content ideas if you follow a few tactics. No, I'm not overpromising.
Take Note of Ideas
Brains are strange machines. Blank when it's time to write. Idiot. Nothing. We get the best article ideas when we're away from our workstation.
In the shower
Driving
In our dreams
Walking
During dull chats
Meditating
In the gym
No accident. The best ideas come in the shower, in nature, or while exercising.
(Your workstation is the worst place for creativity.)
The brain has time and space to link 'dots' of information during rest. It's eureka! New idea.
If you're serious about writing, capture thoughts as they come.
Immediately write down a new thought. Capture it. Don't miss it. Your future self will thank you.
As a writer, entrepreneur, or creative, letting ideas slide is bad.
I recommend using Evernote, Notion, or your device's basic note-taking tool to capture article ideas.
It doesn't matter whatever app you use as long as you collect article ideas.
When you practice 'idea-capturing' enough, you'll have an unending list of article ideas when writer's block hits.
High-Quality Content
More books, films, Medium pieces, and Youtube videos I consume, the more I'm inspired to write.
What you eat shapes who you are.
Celebrity gossip and fear-mongering news won't help your writing. It won't help you write regularly.
Instead, read expert-written books. Watch documentaries to improve your worldview. Follow amazing people online.
Develop your 'idea muscle' Daily creativity takes practice. The more you exercise your 'idea muscles,' the easier it is to generate article ideas.
I've trained my 'concept muscle' using James Altucher's exercise.
Write 10 ideas daily.
Write ten book ideas every day if you're an author. Write down 10 business ideas per day if you're an entrepreneur. Write down 10 investing ideas per day.
Write 10 article ideas per day. You become a content machine.
It doesn't state you need ten amazing ideas. You don't need 10 ideas. Ten ideas, regardless of quality.
Like at the gym, reps are what matter. With each article idea, you gain creativity. Writer's block is no match for this workout.
Quit Perfectionism
Perfectionism is bad for writers. You'll have bad articles. You'll have bad ideas. OK. It's creative.
Writing success requires prolificacy. You can't have 'perfect' articles.
“Perfectionism is the enemy of the idea muscle. Perfectionism is your brain trying to protect you from harm.” — James Altucher
Vincent van Gogh painted 900 pieces. The Starry Night is the most famous.
Thomas Edison invented 1093 things, but not all were as important as the lightbulb or the first movie camera.
Mozart composed nearly 600 compositions, but only Serenade No13 became popular.
Always do your best. Perfectionism shouldn't stop you from working. Write! Publicize. Make. Even if imperfect.
Write Your Story
Living an interesting life gives you plenty to write about. If you travel a lot, share your stories or lessons learned.
Describe your business's successes and shortcomings.
Share your experiences with difficulties or addictions.
More experiences equal more writing material.
If you stay indoors, perusing social media, you won't be inspired to write.
Have fun. Travel. Strive. Build a business. Be bold. Live a life worth writing about, and you won't run out of material.

caroline sinders
3 years ago
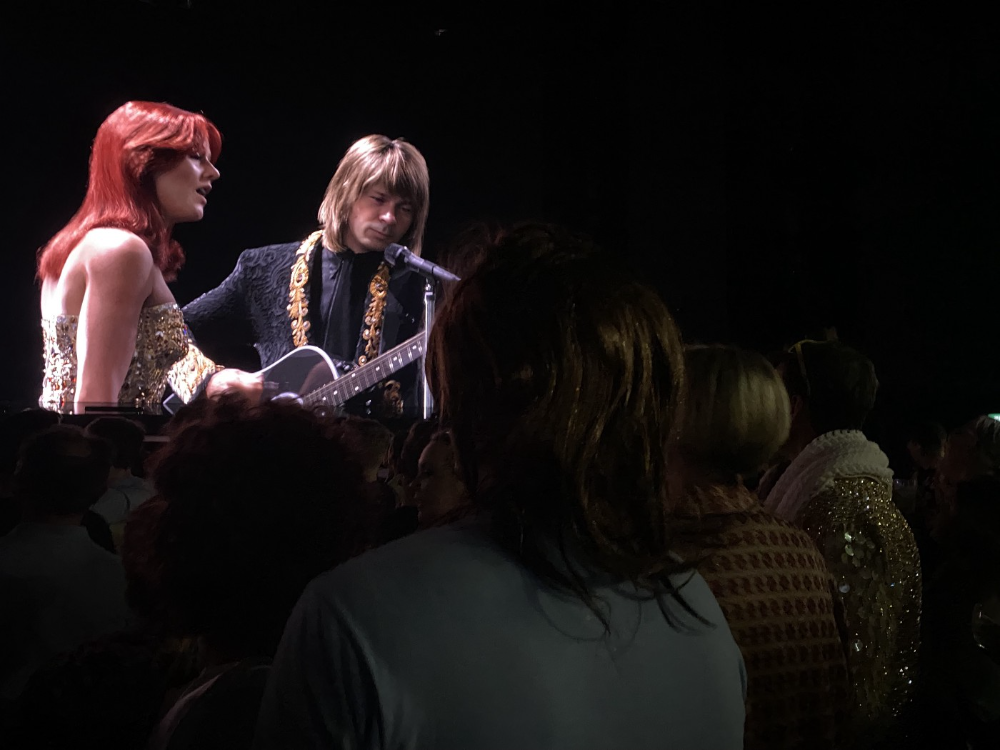
Holographic concerts are the AI of the Future.
A few days ago, I was discussing dall-e with two art and tech pals. One artist acquaintance said she knew a frightened illustrator. Would the ability to create anything with a click derail her career? The artist feared this. My curator friend smiled and said this has always been a dread among artists. When the camera was invented, didn't painters say this? Even in the Instagram era, painting exists.
When art and technology collide, there's room for innovation, experimentation, and fear — especially if the technology replicates or replaces art making. What is art's future with dall-e? How does technology affect music, beyond visual art? Recently, I saw "ABBA Voyage," a holographic ABBA concert in London.
"Abba voyage?" my phone asked in early March. A Gen X friend I met through a fashion blogging ring texted me.
"What's abba Voyage?" I asked while opening my front door with keys and coffee.
We're going! Marti, visiting London, took me to a show.
"Absolutely no ABBA songs here." I responded.
My parents didn't play ABBA much, so I don't know much about them. Dad liked Jimi Hendrix, Cream, Deep Purple, and New Orleans jazz. Marti told me ABBA Voyage was a holographic ABBA show with a live band.
The show was fun, extraordinary fun. Nearly everyone on the dance floor wore wigs, ankle-breaking platforms, sequins, and bellbottoms. I saw some millennials and Zoomers among the boomers.
I was intoxicated by the experience.
Automatons date back to the 18th-century mechanical turk. The mechanical turk was a chess automaton operated by a person. The mechanical turk seemed to perform like a human without human intervention, but it required a human in the loop to work properly.
Humans have used non-humans in entertainment for centuries, such as puppets, shadow play, and smoke and mirrors. A show can have animatronic, technological, and non-technological elements, and a live show can blur real and illusion. From medieval puppet shows to mechanical turks to AI filters, bots, and holograms, entertainment has evolved over time.
I'm not a hologram skeptic, but I'm skeptical of technology, especially since I work with it. I love live performances, I love hearing singers breathe, forget lines, and make jokes. Live shows are my favorite because I love watching performers make mistakes or interact with the audience. ABBA Voyage was different.
Marti and I traveled to Manchester after ABBA Voyage to see Liam Gallagher. Similar but different vibe. Similar in that thousands dressed up for the show. ABBA's energy was dizzying. 90s chic replaced sequins in the crowd. Doc Martens, nylon jackets, bucket hats, shaggy hair. The Charlatans and Liam Gallagher opened and closed, respectively. Fireworks. Incredible. People went crazy. Yelling exhausted my voice.
This week in music featured AI-enabled holograms and a decades-old rocker. Both are warm and gooey in our memories.
After seeing both, I'm wondering if we need AI hologram shows. Why? Is it good?
Like everything tech-related, my answer is "maybe." Because context and performance matter. Liam Gallagher and ABBA both had great, different shows.
For a hologram to work, it must be impossible and big. It must be big, showy, and improbable to justify a hologram. It must feel...expensive, like a stadium pop show. According to a quick search, ABBA broke up on bad terms. Reuniting is unlikely. This is also why Prince or Tupac hologram shows work. We can only engage with their legacy through covers or...holograms.
I drove around listening to the radio a few weeks ago. "Dreaming of You" by Selena played. Selena's music defined my childhood. I sang along and turned up the volume (or as loud as my husband would allow me while driving on the highway).
I discovered Selena's music six months after her death, so I never saw her perform live. My babysitter Melissa played me her album after I moved to Houston. Melissa took me to see the Selena movie five times when it came out. I quickly wore out my VHS copy. I constantly sang "Bibi Bibi Bom Bom" and "Como la Flor." I love Selena. A Selena hologram? Yes, probably.
Instagram advertised a cellist's Arthur Russell tribute show. Russell is another deceased artist I love. I almost walked down the aisle to "This is How We Walk on the Moon," but our cellist couldn't find it. Instead, I walked to Magnetic Fields' "The Book of Love." I "discovered" Russell after a friend introduced me to his music a few years ago.
I use these as analogies for the Liam Gallagher and ABBA concerts.
You have no idea how much I'd pay to see a hologram of Selena's 1995 Houston Livestock Show and Rodeo concert. Arthur Russell's hologram is unnecessary. Russell's work was intimate and performance-based. We can't separate his life from his legacy; popular audiences overlooked his genius. He died of AIDS broke. Like Selena, he died prematurely. Given his music and history, another performer would be a better choice than a hologram. He's no Selena. Selena could have rivaled Beyonce.
Pop shows' size works for holograms. Along with ABBA holograms, there was an anime movie and a light show that would put Tron to shame. ABBA created a tourable stadium show. The event was lavish, expensive, and well-planned. Pop, unlike rock, isn't gritty. Liam Gallagher hologram? No longer impossible, it wouldn't work. He's touring. I'm not sure if a rockstar alone should be rendered as a hologram; it was the show that made ABBA a hologram.
Holograms, like AI, are part of the future of entertainment, but not all of it. Because only modern interpretations of Arthur Russell's work reveal his legacy. That's his legacy.

Large-scale arena performers may use holograms in the future, but the experience must be impossible. A teacher once said that the only way to convey emotion in opera is through song, and I feel the same way about holograms, AR, VR, and mixed reality. A story's impossibility must make sense, like in opera. Impossibility and bombastic performance must be present for an immersive element to "work." ABBA was an impossible and improbable experience, which made it magical. It helped the holographic show work.
Marti told me about ABBA Voyage. She said it was a great concert. Marti has worked in music since the 1990s. She's a music expert; she's seen many shows.
Ai isn't a god or sentient, and the ABBA holograms aren't real. The renderings were glassy-eyed, flat, and robotic, like the Polar Express or the Jaws shark. Even today, the uncanny valley is insurmountable. We know it's not real because it's not about reality. It was about a suspended moment and performance feelings.
I knew this was impossible, an 'unreal' experience, but the emotions I felt were real, like watching a movie or tv show. Perhaps this is one of the better uses of AI, like CGI and special effects, like the beauty of entertainment- we were enraptured and entertained for hours. I've been playing ABBA since then.

Jenn Leach
3 years ago
How Much I Got Paid by YouTube for a 68 Million Views Video
My nameless, faceless channel case study

The Numbers
I anonymize this YouTube channel.
It's in a trendy, crowded niche. Sharing it publicly will likely enhance competition.
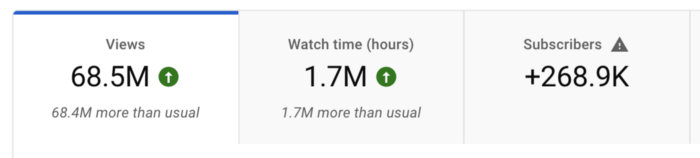
I'll still share my dashboard numbers:
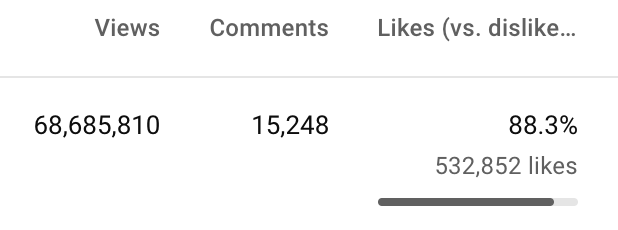
A year ago, the video was released.

What I earned
I'll stop stalling. Here's a screenshot of my YouTube statistics page displaying Adsense profits.
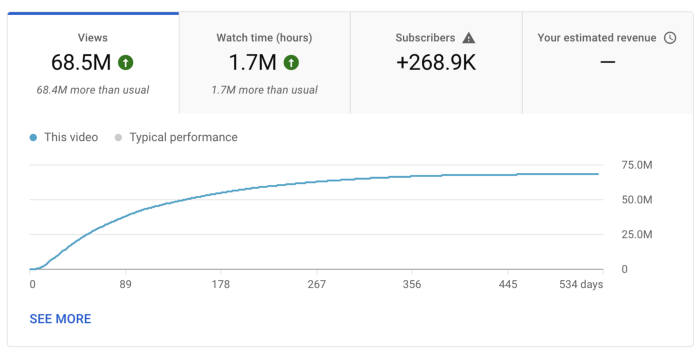
YouTube Adsense made me ZERO dollars.
OMG!
How is this possible?
YouTube Adsense can't monetize my niche. This is typical in faceless niches like TikTok's rain videos. If they were started a while ago, I'm sure certain rain accounts are monetized, but not today.
I actually started a soothing sounds faceless YouTube channel. This was another account of mine.
I looped Pexels films for hours. No background music, just wind, rain, etc.
People could watch these videos to relax or get ready for bed. They're ideal for background noise and relaxation.
They're long-lasting, too. It's easy to make a lot from YouTube Adsense if you insert ads.
Anyway, I tried to monetize it and couldn’t. This was about a year ago. That’s why I doubt new accounts in this genre would be able to get approved for ads.
Back to my faceless channel with 68 million views.
I received nothing from YouTube Adsense, but I made money elsewhere.
Getting paid by the gods of affiliate marketing
Place links in the video and other videos on the channel to get money. Visitors that buy through your affiliate link earn you a commission.
This video earned many clicks on my affiliate links.
I linked to a couple of Amazon products, a YouTube creator tool, my kofi link, and my subscribe link.
Sponsorships
Brands pay you to include ads in your videos.
This video led to many sponsorships.
I've done dozens of sponsorship campaigns that paid $40 to $50 for an end screen to $450 for a preroll ad.
Last word
Overall, I made less than $3,000.
If I had time, I'd be more proactive with sponsorships. You can pitch brand sponsorships. This actually works.
I'd do that if I could rewind time.
I still can, but I think the reaction rate would be higher closer to the viral video's premiere date.