

10 Sneaker Terms Every Beginner Should Know
So you want to get into sneakers? Buying a few sneakers and figuring it out seems simple. Then you miss out on the weekend's instant-sellout releases, so you head to eBay, Twitter, or your local sneaker group to see what's available, since you're probably not ready to pay Flight Club prices just yet.
That's when you're bombarded with new nicknames, abbreviations, and general sneaker slang. It would take months to explain every word and sneaker, so here's a starter kit of ten simple terms to get you started. (Yeah, mostly Jordan. Does anyone really start with Kith or Nike SB?)
10. Colorways
Colorways are a common term in fashion, design, and other visual fields. It's just the product's color scheme. In the case of sneakers, the colorway is often as important as the actual model. Are this year's "Chicago" Air Jordan 1s more durable than last year's "Black/Gum" colorway? Because of their colorway and rarity, the Chicagos are worth roughly three pairs of the Black/Gum kicks.
Pro Tip: A colorway with a well-known nickname is almost always worth more than one without, and the same goes for collaborations.
9. Beaters
A “beater” is a well-worn, likely older model of shoe that has significant wear and tear on it. Rarely sold with the original box or extra laces, beaters rarely sell for much. Unlike most “worn” sneakers, beaters are used for rainy days and the gym. It's exactly what it sounds like, a box full of beaters, and they're a good place to start if you're looking for some cheap old kicks.
Pro Tip: Know which shoes clean up nicely. The shape of lower top sneakers with wider profiles, like SB Dunk Lows and Air Jordan 3s, tends to hold better over time than their higher and narrower cousins.
8. Retro
In the world of Jordan Brand, a “Retro” release is simply a release (or re-release) of a colorway after the shoe model's initial release. For example, the original Air Jordan 7 was released in 1992, but the Bordeaux colorway was re-released in 2011 and recently (2015). An Air Jordan model is released every year, and while half of them are unpopular and unlikely to be Retroed soon, any of them could be re-released whenever Nike and Jordan felt like it.
Pro Tip: Now that the Air Jordan line has been around for so long, the model that tends to be heavily retroed in a year is whichever shoe came out 23 (Michael Jordan’s number during the prime of his career) years ago. The Air Jordan 6 (1991) got new colorways last year, the Air Jordan 7 this year, and more Air Jordan 8s will be released later this year and early next year (1993).
7. PP/Inv
In spite of the fact that eBay takes roughly 10% of the final price, many sneaker buyers and sellers prefer to work directly with PayPal. Selling sneakers for $100 via PayPal invoice or $100 via PayPal friends/family is common on social media. Because no one wants their eBay account suspended for promoting PayPal deals, many eBay sellers will simply state “Message me for a better price.”
Pro Tip: PayPal invoices protect buyers well, but gifting or using Google Wallet does not. Unless you're certain the seller is legitimate, only use invoiced goods/services payments.
6. Yeezy
Kanye West and his sneakers are known as Yeezys. The rapper's first two Yeezys were made by Nike before switching to Adidas. Everything Yeezy-related will be significantly more expensive (and therefore have significantly more fakes made). Not only is the Nike Air Yeezy 2 “Red October” one of the most sought-after sneakers, but the Yeezy influence can be seen everywhere.
Pro Tip: If you're going to buy Yeezys, make sure you buy them from a reputable retailer or reseller. With so many fakes out there, it's not worth spending a grand on something you're not 100% sure is real.
5. GR/Limited
Regardless of how visually repulsive, uncomfortable, and/or impractical a sneaker is, if it’s rare enough, people will still want it. GR stands for General Release, which means they're usually available at retail. Reselling a “Limited Edition” release is costly. Supply and demand, but in this case, the limited supply drives up demand. If you want to get some of the colorways made for rappers, NBA players (Player Exclusive or PE models), and other celebrities, be prepared to pay a premium.
Pro Tip: Limited edition sneakers, like the annual Doernbecher Freestyle sneakers Nike creates with kids from Portland's Doernbecher Children's Hospital, will always be more expensive and limited. Or, you can use automated sneaker-buying software.
4. Grails
A “grail” is a pair of sneakers that someone desires above all others. To obtain their personal grails, people are willing to pay significantly more than the retail price. There doesn't have to be any rhyme or reason why someone chose a specific pair as their grails.
Pro Tip: For those who don't have them, the OG "Bred" or "Royal" Air Jordan 1s, the "Concord" Air Jordan 11s, etc., are all grails.
3. Bred
Anything released in “Bred” (black and red) will sell out quickly. Most resale Air Jordans (and other sneakers) come in the Bred colorway, which is a fan favorite. Bred is a good choice for a first colorway, especially on a solid sneaker silhouette.
Pro Tip: Apart from satisfying the world's hypebeasts, Bred sneakers will probably match a lot of your closet.
2. DS
DS = Deadstock = New. That's it. If something has been worn or tried on, it is no longer DS. Very Near Deadstock (VNDS) Pass As Deadstock It's a cute way of saying your sneakers have been worn but are still in good shape. In the sneaker world, “worn” means they are no longer new, but not too old or beat up.
Pro Tip: Ask for photos of any marks or defects to see what you’re getting before you buy used shoes, also find out if they come with the original box and extra laces, because that can be a sign that they’re in better shape.
1. Fake/Unauthorized
The words “Unauthorized,” “Replica,” “B-grades,” and “Super Perfect” all mean the shoes are fake. It means they aren't made by the actual company, no matter how close or how good the quality. If that's what you want, go ahead and get them. Do not wear them if you do not want the rest of the sneaker world to mock them.
Pro Tip: If you’re not sure if shoes are real or not, do a “Legit Check” on Twitter or Facebook. You'll get dozens of responses in no time.
More on Lifestyle

Will Lockett
2 years ago
There Is A New EV King in Town

McMurtry Spéirling outperforms Tesla in speed and efficiency.
EVs were ridiculously slow for decades. However, the 2008 Tesla Roadster revealed that EVs might go extraordinarily fast. The Tesla Model S Plaid and Rimac Nevera are the fastest-accelerating road vehicles, despite combustion-engined road cars dominating the course. A little-known firm beat Tesla and Rimac in the 0-60 race, beat F1 vehicles on a circuit, and boasts a 350-mile driving range. The McMurtry Spéirling is completely insane.
Mat Watson of CarWow, a YouTube megastar, was recently handed a Spéirling and access to Silverstone Circuit (view video above). Mat ran a quarter-mile on Silverstone straight with former F1 driver Max Chilton. The little pocket-rocket automobile touched 100 mph in 2.7 seconds, completed the quarter mile in 7.97 seconds, and hit 0-60 in 1.4 seconds. When looking at autos quickly, 0-60 times can seem near. The Tesla Model S Plaid does 0-60 in 1.99 seconds, which is comparable to the Spéirling. Despite the meager statistics, the Spéirling is nearly 30% faster than Plaid!
My vintage VW Golf 1.4s has an 8.8-second 0-60 time, whereas a BMW Z4 3.0i is 30% faster (with a 0-60 time of 6 seconds). I tried to beat a Z4 off the lights in my Golf, but the Beamer flew away. If they challenge the Spéirling in a Model S Plaid, they'll feel as I did. Fast!
Insane quarter-mile drag time. Its road car record is 7.97 seconds. A Dodge Demon, meant to run extremely fast quarter miles, finishes so in 9.65 seconds, approximately 20% slower. The Rimac Nevera's 8.582-second quarter-mile record was miles behind drag racing. This run hampered the Spéirling. Because it was employing gearing that limited its top speed to 150 mph, it reached there in a little over 5 seconds without accelerating for most of the quarter mile! McMurtry can easily change the gearing, making the Spéirling run quicker.
McMurtry did this how? First, the Spéirling is a tiny single-seater EV with a 60 kWh battery pack, making it one of the lightest EVs ever. The 1,000-hp Spéirling has more than one horsepower per kg. The Nevera has 0.84 horsepower per kg and the Plaid 0.44.
However, you cannot simply construct a car light and power it. Instead of accelerating, it would spin. This makes the Spéirling a fan car. Its huge fans create massive downforce. These fans provide the Spéirling 2 tonnes of downforce while stationary, so you could park it on the ceiling. Its fast 0-60 time comes from its downforce, which lets it deliver all that power without wheel spin.
It also possesses complete downforce at all speeds, allowing it to tackle turns faster than even race vehicles. Spéirlings overcame VW IDRs and F1 cars to set the Goodwood Hill Climb record (read more here). The Spéirling is a dragstrip winner and track dominator, unlike the Plaid and Nevera.
The Spéirling is astonishing for a single-seater. Fan-generated downforce is more efficient than wings and splitters. It also means the vehicle has very minimal drag without the fan. The Spéirling can go 350 miles per charge (WLTP) or 20-30 minutes at full speed on a track despite its 60 kWh battery pack. The G-forces would hurt your neck before the battery died if you drove around a track for longer. The Spéirling can charge at over 200 kW in about 30 minutes. Thus, driving to track days, having fun, and returning is possible. Unlike other high-performance EVs.
Tesla, Rimac, or Lucid will struggle to defeat the Spéirling. They would need to build a fan automobile because adding power to their current vehicle would make it uncontrollable. The EV and automobile industries now have a new, untouchable performance king.

Michael Le
3 years ago
Union LA x Air Jordan 2 “Future Is Now” PREVIEW
With the help of Virgil Abloh and Union LA‘s Chris Gibbs, it's now clear that Jordan Brand intended to bring the Air Jordan 2 back in 2022.
The “Future Is Now” collection includes two colorways of MJ's second signature as well as an extensive range of apparel and accessories.
“We wanted to juxtapose what some futuristic gear might look like after being worn and patina'd,”
Union stated on the collaboration's landing page.
“You often see people's future visions that are crisp and sterile. We thought it would be cool to wear it in and make it organic...”
The classic co-branding appears on short-sleeve tees, hoodies, and sweat shorts/sweat pants, all lightly distressed at the hems and seams.
Also, a filtered black-and-white photo of MJ graces the adjacent long sleeves, labels stitch into the socks, and the Jumpman logo adorns the four caps.
Liner jackets and flight pants will also be available, adding reimagined militaria to a civilian ensemble.
The Union LA x Air Jordan 2 (Grey Fog and Rattan) shares many of the same beats. Vintage suedes show age, while perforations and detailing reimagine Bruce Kilgore's design for the future.
The “UN/LA” tag across the modified eye stays, the leather patch across the tongue, and the label that wraps over the lateral side of the collar complete the look.
The footwear will also include a Crater Slide in the “Grey Fog” color scheme.
BUYING
On 4/9 and 4/10 from 9am-3pm, Union LA will be giving away a pair of Air Jordan 2s at their La Brea storefront (110 S. LA BREA AVE. LA, CA 90036). The raffle is only open to LA County residents with a valid CA ID. You must enter by 11:59pm on 4/10 to win. Winners will be notified via email.

Marcus Lu
3 years ago
The Brand Structure of U.S. Electric Vehicle Production
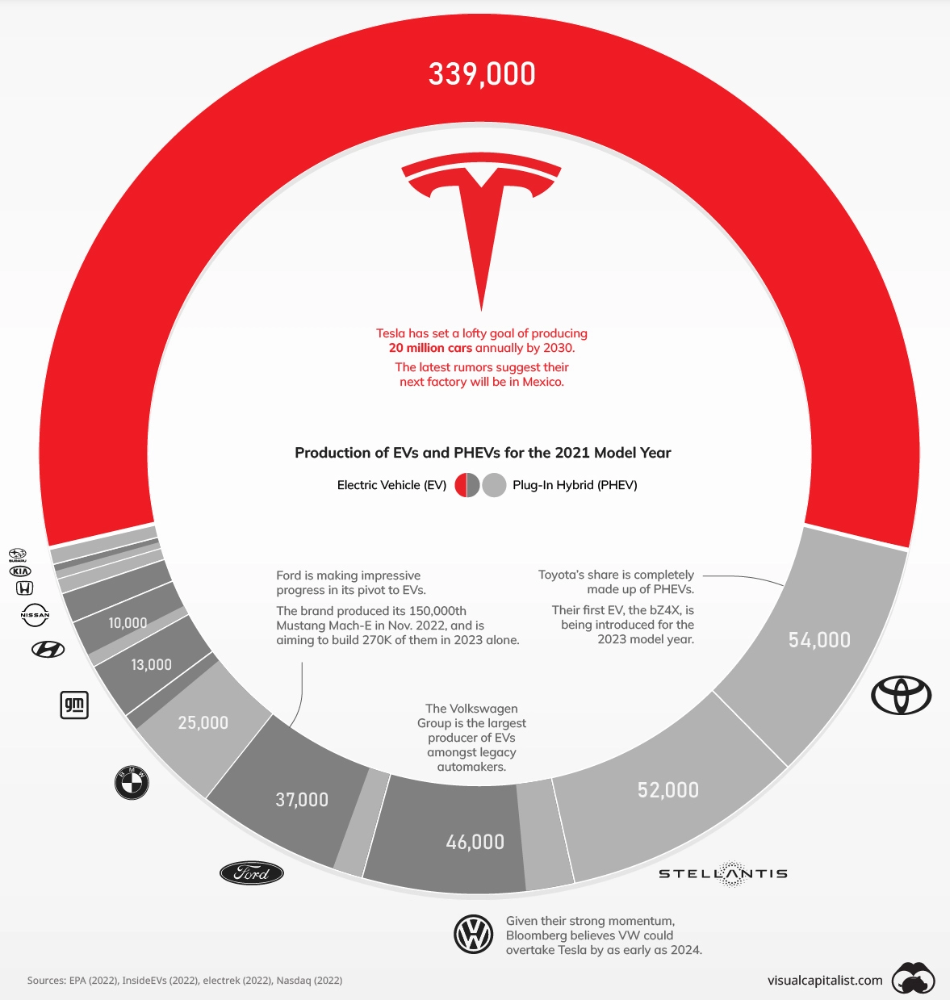
Will Tesla be able to maintain its lead in the EV market for very long?
This is one of the most pressing issues in the American auto sector today. One positive aspect of Tesla is the company's devoted customer base and recognizable name recognition (similar to Apple). It also invests more in research and development per vehicle than its rivals and has a head start in EV production.
Conversely, established automakers like Volkswagen are actively plotting their strategy to surpass Tesla. As the current market leaders, they have decades of experience in the auto industry and are spending billions to catch up.
We've visualized data from the EPA's 2022 Automotive Trends Report to bring you up to speed on this developing story.
Info for the Model Year of 2021
The full production data used in this infographic is for the 2021 model year, but it comes from a report for 2022.
Combined EV and PHEV output is shown in the table below (plug-in hybrid electric vehicle).
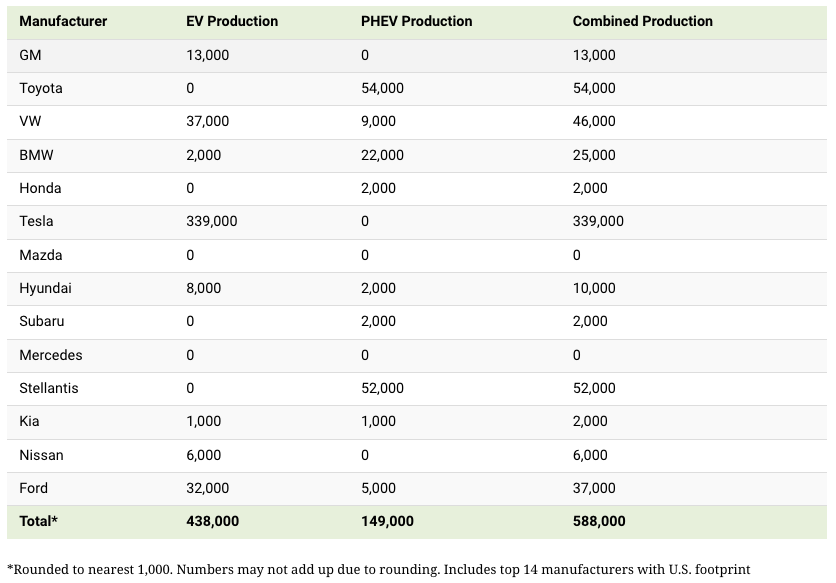
It is important to note that Toyota and Stellantis, the two largest legacy automakers in this dataset, only produced PHEVs. Toyota's first electric vehicle, the bZ4X, won't hit the market until 2023.
Stellantis seems to be falling even further behind, despite having enormous unrealized potential in its Jeep and Ram brands. Stellantis CEO Carlos Tavares said in a recent interview that the firm has budgeted $36 billion for electrification and software.
Legacy Brands with the Most Momentum
In the race to develop electric vehicles, some long-standing manufacturers have gotten the jump on their rivals.
Volkswagen, one of these storied manufacturers, has made a significant investment in electric vehicles (EVs) in the wake of the Dieselgate scandal. The company plans to roll out multiple EV models, including the ID.3 hatchback, ID.4 SUV, and ID. Buzz, with the goal of producing 22 million EVs by 2028. (an electric revival of the classic Microbus).
Even Ford is keeping up, having just announced an EV investment of $22 billion between 2021 and 2025. In November of 2022, the company manufactured their 150,000th Mustang Mach-E, and by the end of 2023, they hoped to have 270,000 of them in circulation.
Additionally, over 200,000 F-150 Lightnings have been reserved since Ford announced the truck. The Lightning is scheduled to have a production run of 15,000 in 2022, 55,000 in 2023, and 80,000 in 2024. Ford's main competitor in the electric pickup truck segment, Rivian, is on track to sell 25,000 vehicles by 2022.
You might also like

Vivek Singh
4 years ago
A Warm Welcome to Web3 and the Future of the Internet
Let's take a look back at the internet's history and see where we're going — and why.
Tim Berners Lee had a problem. He was at CERN, the world's largest particle physics factory, at the time. The institute's stated goal was to study the simplest particles with the most sophisticated scientific instruments. The institute completed the LEP Tunnel in 1988, a 27 kilometer ring. This was Europe's largest civil engineering project (to study smaller particles — electrons).
The problem Tim Berners Lee found was information loss, not particle physics. CERN employed a thousand people in 1989. Due to team size and complexity, people often struggled to recall past project information. While these obstacles could be overcome, high turnover was nearly impossible. Berners Lee addressed the issue in a proposal titled ‘Information Management'.
When a typical stay is two years, data is constantly lost. The introduction of new people takes a lot of time from them and others before they understand what is going on. An emergency situation may require a detective investigation to recover technical details of past projects. Often, the data is recorded but cannot be found. — Information Management: A Proposal
He had an idea. Create an information management system that allowed users to access data in a decentralized manner using a new technology called ‘hypertext'.
To quote Berners Lee, his proposal was “vague but exciting...”. The paper eventually evolved into the internet we know today. Here are three popular W3C standards used by billions of people today:
(credit: CERN)
HTML (Hypertext Markup)
A web formatting language.
URI (Unique Resource Identifier)
Each web resource has its own “address”. Known as ‘a URL'.
HTTP (Hypertext Transfer Protocol)
Retrieves linked resources from across the web.
These technologies underpin all computer work. They were the seeds of our quest to reorganize information, a task as fruitful as particle physics.
Tim Berners-Lee would probably think the three decades from 1989 to 2018 were eventful. He'd be amazed by the billions, the inspiring, the novel. Unlocking innovation at CERN through ‘Information Management'.
The fictional character would probably need a drink, walk, and a few deep breaths to fully grasp the internet's impact. He'd be surprised to see a few big names in the mix.
Then he'd say, "Something's wrong here."
We should review the web's history before going there. Was it a success after Berners Lee made it public? Web1 and Web2: What is it about what we are doing now that so many believe we need a new one, web3?
Per Outlier Ventures' Jamie Burke:
Web 1.0 was read-only.
Web 2.0 was the writable
Web 3.0 is a direct-write web.
Let's explore.
Web1: The Read-Only Web
Web1 was the digital age. We put our books, research, and lives ‘online'. The web made information retrieval easier than any filing cabinet ever. Massive amounts of data were stored online. Encyclopedias, medical records, and entire libraries were put away into floppy disks and hard drives.
In 2015, the web had around 305,500,000,000 pages of content (280 million copies of Atlas Shrugged).
Initially, one didn't expect to contribute much to this database. Web1 was an online version of the real world, but not yet a new way of using the invention.
One gets the impression that the web has been underutilized by historians if all we can say about it is that it has become a giant global fax machine. — Daniel Cohen, The Web's Second Decade (2004)
That doesn't mean developers weren't building. The web was being advanced by great minds. Web2 was born as technology advanced.
Web2: Read-Write Web
Remember when you clicked something on a website and the whole page refreshed? Is it too early to call the mid-2000s ‘the good old days'?
Browsers improved gradually, then suddenly. AJAX calls augmented CGI scripts, and applications began sending data back and forth without disrupting the entire web page. One button to ‘digg' a post (see below). Web experiences blossomed.
In 2006, Digg was the most active ‘Web 2.0' site. (Photo: Ethereum Foundation Taylor Gerring)
Interaction was the focus of new applications. Posting, upvoting, hearting, pinning, tweeting, liking, commenting, and clapping became a lexicon of their own. It exploded in 2004. Easy ways to ‘write' on the internet grew, and continue to grow.
Facebook became a Web2 icon, where users created trillions of rows of data. Google and Amazon moved from Web1 to Web2 by better understanding users and building products and services that met their needs.
Business models based on Software-as-a-Service and then managing consumer data within them for a fee have exploded.
Web2 Emerging Issues
Unbelievably, an intriguing dilemma arose. When creating this read-write web, a non-trivial question skirted underneath the covers. Who owns it all?
You have no control over [Web 2] online SaaS. People didn't realize this because SaaS was so new. People have realized this is the real issue in recent years.
Even if these organizations have good intentions, their incentive is not on the users' side.
“You are not their customer, therefore you are their product,” they say. With Laura Shin, Vitalik Buterin, Unchained
A good plot line emerges. Many amazing, world-changing software products quietly lost users' data control.
For example: Facebook owns much of your social graph data. Even if you hate Facebook, you can't leave without giving up that data. There is no ‘export' or ‘exit'. The platform owns ownership.
While many companies can pull data on you, you cannot do so.
On the surface, this isn't an issue. These companies use my data better than I do! A complex group of stakeholders, each with their own goals. One is maximizing shareholder value for public companies. Tim Berners-Lee (and others) dislike the incentives created.
“Show me the incentive and I will show you the outcome.” — Berkshire Hathaway's CEO
It's easy to see what the read-write web has allowed in retrospect. We've been given the keys to create content instead of just consume it. On Facebook and Twitter, anyone with a laptop and internet can participate. But the engagement isn't ours. Platforms own themselves.
Web3: The ‘Unmediated’ Read-Write Web
Tim Berners Lee proposed a decade ago that ‘linked data' could solve the internet's data problem.
However, until recently, the same principles that allowed the Web of documents to thrive were not applied to data...
The Web of Data also allows for new domain-specific applications. Unlike Web 2.0 mashups, Linked Data applications work with an unbound global data space. As new data sources appear on the Web, they can provide more complete answers.
At around the same time as linked data research began, Satoshi Nakamoto created Bitcoin. After ten years, it appears that Berners Lee's ideas ‘link' spiritually with cryptocurrencies.
What should Web 3 do?
Here are some quick predictions for the web's future.
Users' data:
Users own information and provide it to corporations, businesses, or services that will benefit them.
Defying censorship:
No government, company, or institution should control your access to information (1, 2, 3)
Connect users and platforms:
Create symbiotic rather than competitive relationships between users and platform creators.
Open networks:
“First, the cryptonetwork-participant contract is enforced in open source code. Their voices and exits are used to keep them in check.” Dixon, Chris (4)
Global interactivity:
Transacting value, information, or assets with anyone with internet access, anywhere, at low cost
Self-determination:
Giving you the ability to own, see, and understand your entire digital identity.
Not pull, push:
‘Push' your data to trusted sources instead of ‘pulling' it from others.
Where Does This Leave Us?
Change incentives, change the world. Nick Babalola
People believe web3 can help build a better, fairer system. This is not the same as equal pay or outcomes, but more equal opportunity.
It should be noted that some of these advantages have been discussed previously. Will the changes work? Will they make a difference? These unanswered questions are technical, economic, political, and philosophical. Unintended consequences are likely.
We hope Web3 is a more democratic web. And we think incentives help the user. If there’s one thing that’s on our side, it’s that open has always beaten closed, given a long enough timescale.
We are at the start.

Caspar Mahoney
3 years ago
Changing Your Mindset From a Project to a Product
Product game mindsets? How do these vary from Project mindset?

1950s spawned the Iron Triangle. Project people everywhere know and live by it. In stakeholder meetings, it is used to stretch the timeframe, request additional money, or reduce scope.
Quality was added to this triangle as things matured.
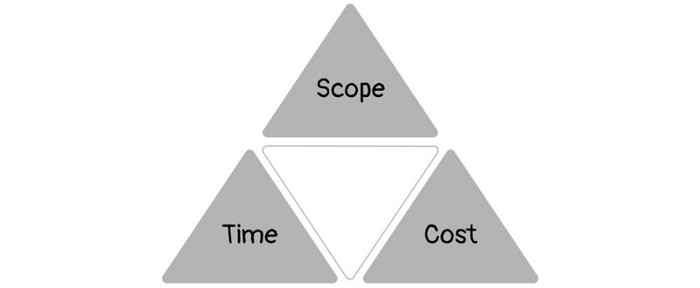
Quality was intended to be transformative, but none of these principles addressed why we conduct projects.
Value and benefits are key.
Product value is quantified by ROI, revenue, profit, savings, or other metrics. For me, every project or product delivery is about value.
Most project managers, especially those schooled 5-10 years or more ago (thousands working in huge corporations worldwide), understand the world in terms of the iron triangle. What does that imply? They worry about:
a) enough time to get the thing done.
b) have enough resources (budget) to get the thing done.
c) have enough scope to fit within (a) and (b) >> note, they never have too little scope, not that I have ever seen! although, theoretically, this could happen.
Boom—iron triangle.
To make the triangle function, project managers will utilize formal governance (Steering) to move those things. Increase money, scope, or both if time is short. Lacking funds? Increase time, scope, or both.
In current product development, shifting each item considerably may not yield value/benefit.
Even terrible. This approach will fail because it deprioritizes Value/Benefit by focusing the major stakeholders (Steering participants) and delivery team(s) on Time, Scope, and Budget restrictions.
Pre-agile, this problem was terrible. IT projects failed wildly. History is here.
Value, or benefit, is central to the product method. Product managers spend most of their time planning value-delivery paths.
Product people consider risk, schedules, scope, and budget, but value comes first. Let me illustrate.
Imagine managing internal products in an enterprise. Your core customer team needs a rapid text record of a chat to fix a problem. The consumer wants a feature/features added to a product you're producing because they think it's the greatest spot.
Project-minded, I may say;
Ok, I have budget as this is an existing project, due to run for a year. This is a new requirement to add to the features we’re already building. I think I can keep the deadline, and include this scope, as it sounds related to the feature set we’re building to give the desired result”.
This attitude repeats Scope, Time, and Budget.
Since it meets those standards, a project manager will likely approve it. If they have a backlog, they may add it and start specking it out assuming it will be built.
Instead, think like a product;
What problem does this feature idea solve? Is that problem relevant to the product I am building? Can that problem be solved quicker/better via another route ? Is it the most valuable problem to solve now? Is the problem space aligned to our current or future strategy? or do I need to alter/update the strategy?
A product mindset allows you to focus on timing, resource/cost, feasibility, feature detail, and so on after answering the aforementioned questions.
The above oversimplifies because
Leadership in discovery

Project managers are facilitators of ideas. This is as far as they normally go in the ‘idea’ space.
Business Requirements collection in classic project delivery requires extensive upfront documentation.
Agile project delivery analyzes requirements iteratively.
However, the project manager is a facilitator/planner first and foremost, therefore topic knowledge is not expected.
I mean business domain, not technical domain (to confuse matters, it is true that in some instances, it can be both technical and business domains that are important for a single individual to master).
Product managers are domain experts. They will become one if they are training/new.
They lead discovery.
Product Manager-led discovery is much more than requirements gathering.
Requirements gathering involves a Business Analyst interviewing people and documenting their requests.
The project manager calculates what fits and what doesn't using their Iron Triangle (presumably in their head) and reports back to Steering.
If this requirements-gathering exercise failed to identify requirements, what would a project manager do? or bewildered by project requirements and scope?
They would tell Steering they need a Business SME or Business Lead assigning or more of their time.
Product discovery requires the Product Manager's subject knowledge and a new mindset.
How should a Product Manager handle confusing requirements?
Product Managers handle these challenges with their talents and tools. They use their own knowledge to fill in ambiguity, but they have the discipline to validate those assumptions.
To define the problem, they may perform qualitative or quantitative primary research.
They might discuss with UX and Engineering on a whiteboard and test assumptions or hypotheses.
Do Product Managers escalate confusing requirements to Steering/Senior leaders? They would fix that themselves.
Product managers raise unclear strategy and outcomes to senior stakeholders. Open talks, soft skills, and data help them do this. They rarely raise requirements since they have their own means of handling them without top stakeholder participation.
Discovery is greenfield, exploratory, research-based, and needs higher-order stakeholder management, user research, and UX expertise.
Product Managers also aid discovery. They lead discovery. They will not leave customer/user engagement to a Business Analyst. Administratively, a business analyst could aid. In fact, many product organizations discourage business analysts (rely on PM, UX, and engineer involvement with end-users instead).
The Product Manager must drive user interaction, research, ideation, and problem analysis, therefore a Product professional must be skilled and confident.
Creating vs. receiving and having an entrepreneurial attitude

Product novices and project managers focus on details rather than the big picture. Project managers prefer spreadsheets to strategy whiteboards and vision statements.
These folks ask their manager or senior stakeholders, "What should we do?"
They then elaborate (in Jira, in XLS, in Confluence or whatever).
They want that plan populated fast because it reduces uncertainty about what's going on and who's supposed to do what.
Skilled Product Managers don't only ask folks Should we?
They're suggesting this, or worse, Senior stakeholders, here are some options. After asking and researching, they determine what value this product adds, what problems it solves, and what behavior it changes.
Therefore, to move into Product, you need to broaden your view and have courage in your ability to discover ideas, find insightful pieces of information, and collate them to form a valuable plan of action. You are constantly defining RoI and building Business Cases, so much so that you no longer create documents called Business Cases, it is simply ingrained in your work through metrics, intelligence, and insights.
Product Management is not a free lunch.
Plateless.
Plates and food must be prepared.
In conclusion, Product Managers must make at least three mentality shifts:
You put value first in all things. Time, money, and scope are not as important as knowing what is valuable.
You have faith in the field and have the ability to direct the search. YYou facilitate, but you don’t just facilitate. You wouldn't want to limit your domain expertise in that manner.
You develop concepts, strategies, and vision. You are not a waiter or an inbox where other people can post suggestions; you don't merely ask folks for opinion and record it. However, you excel at giving things that aren't clearly spoken or written down physical form.

Mike Meyer
3 years ago
Reality Distortion
Old power paradigm blocks new planetary paradigm

The difference between our reality and the media's reality is like a tale of two worlds. The greatest and worst of times, really.
Expanding information demands complex skills and understanding to separate important information from ignorance and crap. And that's just the start of determining the source's aim.
Trust who? We see people trust liars in public and then be destroyed by their decisions. Mistakes may be devastating.
Many give up and don't trust anyone. Reality is a choice, though. Same risks.
We must separate our needs and wants from reality. Needs and wants have rules. Greed and selfishness create an unlivable planet.
Culturally, we know this, but we ignore it as foolish. Selfish and greedy people obtain what they want, while others suffer.
We invade, plunder, rape, and burn. We establish civilizations by institutionalizing an exploitable underclass and denying its existence. These cultural lies promote greed and selfishness despite their destructiveness.
Controlling parts of society institutionalize these lies as fact. Many of each age are willing to gamble on greed because they were taught to see greed and selfishness as principles justified by prosperity.
Our cultural understanding recognizes the long-term benefits of collaboration and sharing. This older understanding generates an increasing tension between greedy people and those who see its planetary effects.
Survival requires distinguishing between global and regional realities. Simple, yet many can't do it. This is the first time human greed has had a global impact.
In the past, conflict stories focused on regional winners and losers. Losers lose, winners win, etc. Powerful people see potential decades of nuclear devastation as local, overblown, and not personally dangerous.
Mutually Assured Destruction (MAD) was a human choice that required people to acquiesce to irrational devastation. This prevented nuclear destruction. Most would refuse.
A dangerous “solution” relies on nuclear trigger-pullers not acting irrationally. Since then, we've collected case studies of sane people performing crazy things in experiments. We've been lucky, but the climate apocalypse could be different.
Climate disaster requires only continuing current behavior. These actions already cause global harm, but that's not a threat. These activities must be viewed differently.
Once grasped, denying planetary facts is hard to accept. Deniers can't think beyond regional power. Seeing planet-scale is unusual.
Decades of indoctrination defining any planetary perspective as un-American implies communal planetary assets are for plundering. The old paradigm limits any other view.
In the same way, the new paradigm sees the old regional power paradigm as a threat to planetary civilization and lifeforms. Insane!
While MAD relied on leaders not acting stupidly to trigger a nuclear holocaust, the delayed climatic holocaust needs correcting centuries of lunacy. We must stop allowing craziness in global leadership.
Nothing in our acknowledged past provides a paradigm for such. Only primitive people have failed to reach our level of sophistication.
Before European colonization, certain North American cultures built sophisticated regional nations but abandoned them owing to authoritarian cruelty and destruction. They were overrun by societies that saw no wrong in perpetual exploitation. David Graeber's The Dawn of Everything is an example of historical rediscovery, which is now crucial.
From the new paradigm's perspective, the old paradigm is irrational, yet it's too easy to see those in it as ignorant or malicious, if not both. These people are both, but the collapsing paradigm they promote is older or more ingrained than we think.
We can't shift that paradigm's view of a dead world. We must eliminate this mindset from our nations' leadership. No other way will preserve the earth.
Change is occurring. As always with tremendous transition, younger people are building the new paradigm.
The old paradigm's disintegration is insane. The ability to detect errors and abandon their sources is more important than age. This is gaining recognition.
The breakdown of the previous paradigm is not due to senile leadership, but to systemic problems that the current, conservative leadership cannot recognize.
Stop following the old paradigm.