


Here is the actual reason why Russia invaded Ukraine
Democracy's demise
Our Ukrainian brothers and sisters are being attacked by a far superior force.
It's the biggest invasion since WWII.
43.3 million peaceful Ukrainians awoke this morning to tanks, mortars, and missiles. Russia is already 15 miles away.
America and the West will not deploy troops.
They're sanctioning. Except railways. And luxuries. And energy. Diamonds. Their dependence on Russian energy exports means they won't even cut Russia off from SWIFT.
Ukraine is desperate enough to hand out guns on the street.
France, Austria, Turkey, and the EU are considering military aid, but Ukraine will fall without America or NATO.
The Russian goal is likely to encircle Kyiv and topple Zelenskyy's government. A proxy power will be reinstated once Russia has total control.
“Western security services believe Putin intends to overthrow the government and install a puppet regime,” says Financial Times foreign affairs commentator Gideon Rachman. This “decapitation” strategy includes municipalities. Ukrainian officials are being targeted for arrest or death.”
Also, Putin has never lost a war.
Why is Russia attacking Ukraine?
Putin, like a snowflake college student, “feels unsafe.”
Why?
Because Ukraine is full of “Nazi ideas.”
Putin claims he has felt threatened by Ukraine since the country's pro-Putin leader was ousted and replaced by a popular Jewish comedian.
Hee hee
He fears a full-scale enemy on his doorstep if Ukraine joins NATO. But he refuses to see it both ways. NATO has never invaded Russia, but Russia has always stolen land from its neighbors. Can you blame them for joining a mutual defense alliance when a real threat exists?
Nations that feel threatened can join NATO. That doesn't justify an attack by Russia. It allows them to defend themselves. But NATO isn't attacking Moscow. They aren't.
Russian President Putin's "special operation" aims to de-Nazify the Jewish-led nation.
To keep Crimea and the other two regions he has already stolen, he wants Ukraine undefended by NATO.
(Warlords have fought for control of the strategically important Crimea for over 2,000 years.)
Putin wants to own all of Ukraine.
Why?
The Black Sea is his goal.
Ports bring money and power, and Ukraine pipelines transport Russian energy products.
Putin wants their wheat, too — with 70% crop coverage, Ukraine would be their southern breadbasket, and Russia has no qualms about starving millions of Ukrainians to death to feed its people.
In the end, it's all about greed and power.
Putin wants to own everything Russia has ever owned. This year he turns 70, and he wants to be remembered like his hero Peter the Great.
In order to get it, he's willing to kill thousands of Ukrainians
Art imitates life
This story began when a Jewish TV comedian portrayed a teacher elected President after ranting about corruption.
Servant of the People, the hit sitcom, is now the leading centrist political party.
Right, President Zelenskyy won the hearts and minds of Ukrainians by imagining a fairer world.
A fair fight is something dictators, corporatists, monopolists, and warlords despise.
Now Zelenskyy and his people will die, allowing one of history's most corrupt leaders to amass even more power.
The poor always lose
Meanwhile, the West will impose economic sanctions on Russia.
China is likely to step in to help Russia — or at least the wealthy.
The poor and working class in Russia will suffer greatly if there is a hard crash or long-term depression.
Putin's friends will continue to drink champagne and eat caviar.
Russia cutting off oil, gas, and fertilizer could cause more inflation and possibly a recession if it cuts off supplies to the West. This causes more suffering and hardship for the Western poor and working class.
Why? a billionaire sociopath gets his dirt.
Yes, Russia is simply copying America. Some of us think all war is morally wrong, regardless of who does it.
But let's not kid ourselves right now.
The markets rallied after the biggest invasion in Europe since WWII.
Investors hope Ukraine collapses and Russian oil flows.
Unbridled capitalists value lifeless.
What we can do about Ukraine
When the Russian army invaded eastern Finland, my wife's grandmother fled as a child. 80 years later, Russia still has Karelia.
Russia invaded Ukraine today to retake two eastern provinces.
History has taught us nothing.
Past mistakes won't fix the future.
Instead, we should try:
- Pray and/or meditate on our actions with our families.
- Stop buying Russian products (vodka, obviously, but also pay more for hydro/solar/geothermal/etc.)
- Stop wasting money on frivolous items and donate it to Ukrainian charities.
Here are 35+ places to donate.
- To protest, gather a few friends, contact the media, and shake signs in front of the Russian embassy.
- Prepare to welcome refugees.
More war won't save the planet or change hearts.
Only love can work.
More on Current Events
Gill Pratt
3 years ago
War's Human Cost
War's Human Cost
I didn't start crying until I was outside a McDonald's in an Olempin, Poland rest area on highway S17.
Children pick toys at a refugee center, Olempin, Poland, March 4, 2022.
Refugee children, mostly alone with their mothers, but occasionally with a gray-haired grandfather or non-Ukrainian father, were coaxed into picking a toy from boxes provided by a kind-hearted company and volunteers.
I went to Warsaw to continue my research on my family's history during the Holocaust. In light of the ongoing Ukrainian conflict, I asked former colleagues in the US Department of Defense and Intelligence Community if it was safe to travel there. They said yes, as Poland was a NATO member.
I stayed in a hotel in the Warsaw Ghetto, where 90% of my mother's family was murdered in the Holocaust. Across the street was the first Warsaw Judenrat. It was two blocks away from the apartment building my mother's family had owned and lived in, now dilapidated and empty.
Building of my great-grandfather, December 2021.
A mass grave of thousands of rocks for those killed in the Warsaw Ghetto, I didn't cry when I touched its cold walls.
Warsaw Jewish Cemetery, 200,000–300,000 graves.
Mass grave, Warsaw Jewish Cemetery.
My mother's family had two homes, one in Warszawa and the rural one was a forest and sawmill complex in Western Ukraine. For the past half-year, a local Ukrainian historian had been helping me discover faint traces of her family’s life there — in fact, he had found some people still alive who remembered the sawmill and that it belonged to my mother’s grandfather. The historian was good at his job, and we had become close.
My historian friend, December 2021, talking to a Ukrainian.
With war raging, my second trip to Warsaw took on a different mission. To see his daughter and one-year-old grandson, I drove east instead of to Ukraine. They had crossed the border shortly after the war began, leaving men behind, and were now staying with a friend on Poland's eastern border.
I entered after walking up to the house and settling with the dog. The grandson greeted me with a huge smile and the Ukrainian word for “daddy,” “Tato!” But it was clear he was awaiting his real father's arrival, and any man he met would be so tentatively named.
After a few moments, the boy realized I was only a stranger. He had musical talent, like his mother and grandfather, both piano teachers, as he danced to YouTube videos of American children's songs dubbed in Ukrainian, picking the ones he liked and crying when he didn't.
Songs chosen by my historian friend's grandson, March 4, 2022
He had enough music and began crying regardless of the song. His mother picked him up and started nursing him, saying she was worried about him. She had no idea where she would live or how she would survive outside Ukraine. She showed me her father's family history of losses in the Holocaust, which matched my own research.
After an hour of drinking tea and trying to speak of hope, I left for the 3.5-hour drive west to Warsaw.
It was unlike my drive east. It was reminiscent of the household goods-filled carts pulled by horses and people fleeing war 80 years ago.
Jewish refugees relocating, USHMM Holocaust Encyclopaedia, 1939.
The carefully chosen trinkets by children to distract them from awareness of what is really happening and the anxiety of what lies ahead, made me cry despite all my research on the Holocaust. There is no way for them to communicate with their mothers, who are worried, absent, and without their fathers.
It's easy to see war as a contest of nations' armies, weapons, and land. The most costly aspect of war is its psychological toll. My father screamed in his sleep from nightmares of his own adolescent trauma in Warsaw 80 years ago.
Survivor father studying engineering, 1961.
In the airport, I waited to return home while Ukrainian public address systems announced refugee assistance. Like at McDonald's, many mothers were alone with their children, waiting for a flight to distant relatives.
That's when I had my worst trip experience.
A woman near me, clearly a refugee, answered her phone, cried out, and began wailing.
The human cost of war descended like a hammer, and I realized that while I was going home, she never would

B Kean
3 years ago
Russia's greatest fear is that no one will ever fear it again.
When everyone laughs at him, he's powerless.

1-2-3: Fold your hands and chuckle heartily. Repeat until you're really laughing.
We're laughing at Russia's modern-day shortcomings, if you hadn't guessed.
Watch Good Fellas' laughing scene on YouTube. Ray Liotta, Joe Pesci, and others laugh hysterically in a movie. Laugh at that scene, then think of Putin's macho guy statement on February 24 when he invaded Ukraine. It's cathartic to laugh at his expense.
Right? It makes me feel great that he was convinced the military action will be over in a week. I love reading about Putin's morning speech. Many stupid people on Earth supported him. Many loons hailed his speech historic.
Russia preys on the weak. Strong Ukraine overcame Russia. Ukraine's right. As usual, Russia is in the wrong.
A so-called thought leader recently complained on Russian TV that the West no longer fears Russia, which is why Ukraine is kicking Russia's ass.
Let's simplify for this Russian intellectual. Except for nuclear missiles, the West has nothing to fear from Russia. Russia is a weak, morally-empty country whose DNA has degraded to the point that evolution is already working to flush it out.
The West doesn't fear Russia since he heads a prominent Russian institution. Russian universities are intellectually barren. I taught at St. Petersburg University till June (since February I was virtually teaching) and was astounded by the lack of expertise.
Russians excel in science, math, engineering, IT, and anything that doesn't demand critical thinking or personal ideas.
Reflecting on many of the high-ranking individuals from around the West, Satanovsky said: “They are not interested in us. We only think we’re ‘big politics’ for them but for those guys we’re small politics. “We’re small politics, even though we think of ourselves as the descendants of the Russian Empire, of the USSR. We are not the Soviet Union, we don’t have enough weirdos and lunatics, we practically don’t have any (U.S. Has Stopped Fearing Us).”
Professor Dmitry Evstafiev, president of the Institute of the Middle East, praised Nikita Khrushchev's fiery nature because he made the world fear him, which made the Soviet Union great. If the world believes Putin is crazy, then Russia will be great, says this man. This is crazy.
Evstafiev covered his cowardice by saluting Putin. He praised his culture and Ukraine patience. This weakling professor ingratiates himself to Putin instead of calling him a cowardly, demonic shithead.
This is why we don't fear Russia, professor. Because you're all sycophantic weaklings who sold your souls to a Leningrad narcissist. Putin's nothing. He lacks intelligence. You've tied your country's fate and youth's future to this terrible monster. Disgraceful!
How can you loathe your country's youth so much to doom them to decades or centuries of ignominy? My son is half Russian and must now live with this portion of him.
We don't fear Russia because you don't realize that it should be appreciated, not frightened. That would need lobotomizing tens of millions of people like you.
Sadman. You let a Leningrad weakling castrate you and display your testicles. He shakes the container, saying, "Your balls are mine."
Why is Russia not feared?
Your self-inflicted national catastrophe is hilarious. Sadly, it's laugh-through-tears.

Cory Doctorow
3 years ago
The downfall of the Big Four accounting companies is just one (more) controversy away.
Economic mutual destruction.
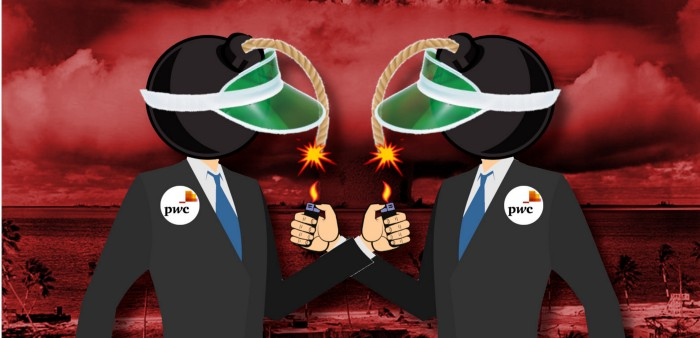
Multibillion-dollar corporations never bothered with an independent audit, and they all lied about their balance sheets.
It's easy to forget that the Big Four accounting firms are lousy fraud enablers. Just because they sign off on your books doesn't mean you're not a hoax waiting to erupt.
This is *crazy* Capitalism depends on independent auditors. Rich folks need to know their financial advisers aren't lying. Rich folks usually succeed.
No accounting. EY, KPMG, PWC, and Deloitte make more money consulting firms than signing off on their accounts.
The Big Four sign off on phony books because failing to make friends with unscrupulous corporations may cost them consulting contracts.
The Big Four are the only firms big enough to oversee bankruptcy when they sign off on fraudulent books, as they did for Carillion in 2018. All four profited from Carillion's bankruptcy.
The Big Four are corrupt without any consequences for misconduct. Who can forget when KPMG's top management was fined millions for helping auditors cheat on ethics exams?
Consulting and auditing conflict. Consultants help a firm cover its evil activities, such as tax fraud or wage theft, whereas auditors add clarity to a company's finances. The Big Four make more money from cooking books than from uncooking them, thus they are constantly embroiled in scandals.
If a major scandal breaks, it may bring down the entire sector and substantial parts of the economy. Jim Peterson explains system risk for The Dig.
The Big Four are voluntary private partnerships where accountants invest their time, reputations, and money. If a controversy threatens the business, partners who depart may avoid scandal and financial disaster.
When disaster looms, each partner should bolt for the door, even if a disciplined stay-and-hold posture could weather the storm. This happened to Arthur Andersen during Enron's collapse, and a 2006 EU report recognized the risk to other corporations.
Each partner at a huge firm knows how much dirty laundry they've buried in the company's garden, and they have well-founded suspicions about what other partners have buried, too. When someone digs, everyone runs.
If a firm confronts substantial litigation damages or enforcement penalties, it could trigger the collapse of one of the Big Four. That would be bad news for the firm's clients, who would have trouble finding another big auditor.
Most of the world's auditing capacity is concentrated in four enormous, brittle, opaque, compromised organizations. If one of them goes bankrupt, the other three won't be able to take on its clients.
Peterson: Another collapse would strand many of the world's large public businesses, leaving them unable to obtain audit views for their securities listings and regulatory compliance.
Count Down: The Past, Present, and Uncertain Future of the Big Four Accounting Firms is in its second edition.
https://www.emerald.com/insight/publication/doi/10.1108/9781787147003
You might also like

Joseph Mavericks
3 years ago
Apples Top 100 Meeting: Steve Jobs's Secret Agenda's Lessons
Jobs' secret emails became public due to a litigation with Samsung.
Steve Jobs sent Phil Schiller an email at the end of 2010. Top 100 A was the codename for Apple's annual Top 100 executive meetings. The 2011 one was scheduled.
Everything about this gathering is secret, even attendance. The location is hidden, and attendees can't even drive themselves. Instead, buses transport them to a 2-3 day retreat.
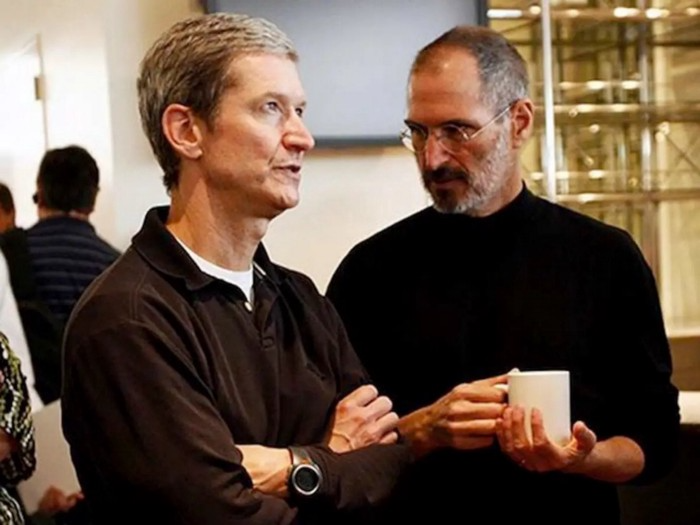
Due to a litigation with Samsung, this Top 100 meeting's agenda was made public in 2014. This was a critical milestone in Apple's history, not a Top 100 meeting. Apple had many obstacles in the 2010s to remain a technological leader. Apple made more money with non-PC goods than with its best-selling Macintosh series. This was the last Top 100 gathering Steve Jobs would attend before passing, and he wanted to make sure his messages carried on before handing over his firm to Tim Cook.
In this post, we'll discuss lessons from Jobs' meeting agenda. Two sorts of entrepreneurs can use these tips:
Those who manage a team in a business and must ensure that everyone is working toward the same goals, upholding the same principles, and being inspired by the same future.
Those who are sole proprietors or independent contractors and who must maintain strict self-discipline in order to stay innovative in their industry and adhere to their own growth strategy.
Here's Steve Jobs's email outlining the annual meeting agenda. It's an 11-part summary of the company's shape and strategy.
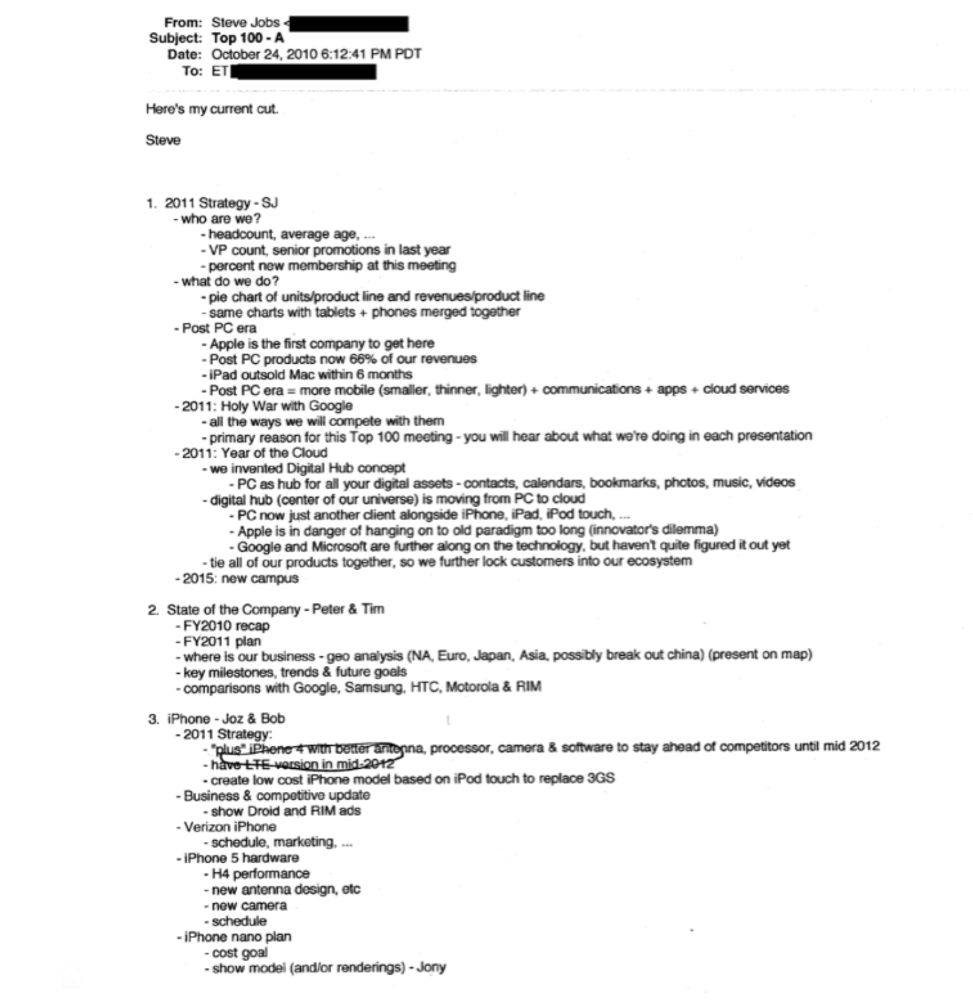

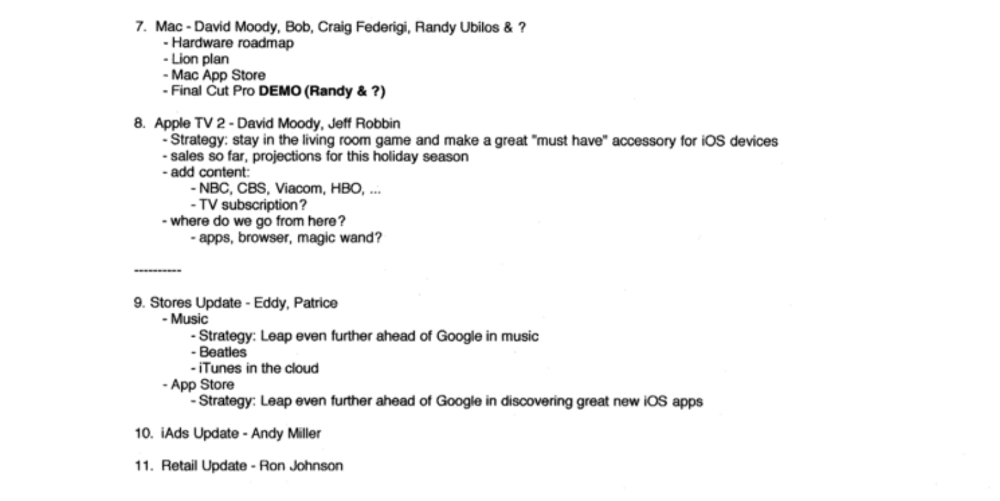
Steve Jobs outlines Apple's 2011 strategy, 10/24/10
1. Correct your data
Business leaders must comprehend their company's metrics. Jobs either mentions critical information he already knows or demands slides showing the numbers he wants. These numbers fall under 2 categories:
Metrics for growth and strategy
As we will see, this was a crucial statistic for Apple since it signaled the beginning of the Post PC era and required them to make significant strategic changes in order to stay ahead of the curve. Post PC products now account for 66% of our revenues.
Within six months, iPad outsold Mac, another sign of the Post-PC age. As we will see, Jobs thought the iPad would be the next big thing, and item number four on the agenda is one of the most thorough references to the iPad.
Geographical analysis: Here, Jobs emphasizes China, where the corporation has a slower start than anticipated. China was dominating Apple's sales growth with 16% of revenue one year after this meeting.
Metrics for people & culture
The individuals that make up a firm are more significant to its success than its headcount or average age. That holds true regardless of size, from a 5-person startup to a Fortune 500 firm. Jobs was aware of this, which is why his suggested agenda begins by emphasizing demographic data.
Along with the senior advancements in the previous year's requested statistic, it's crucial to demonstrate that if the business is growing, the employees who make it successful must also grow.
2. Recognize the vulnerabilities and strengths of your rivals
Steve Jobs was known for attacking his competition in interviews and in his strategies and roadmaps. This agenda mentions 18 competitors, including:
Google 7 times
Android 3 times
Samsung 2 times
Jobs' agenda email was issued 6 days after Apple's Q4 results call (2010). On the call, Jobs trashed Google and Android. His 5-minute intervention included:
Google has acknowledged that the present iteration of Android is not tablet-optimized.
Future Android tablets will not work (Dead On Arrival)
While Google Play only has 90,000 apps, the Apple App Store has 300,000.
Android is extremely fragmented and is continuing to do so.
The App Store for iPad contains over 35,000 applications. The market share of the latest generation of tablets (which debuted in 2011) will be close to nil.
Jobs' aim in blasting the competition on that call was to reassure investors about the upcoming flood of new tablets. Jobs often criticized Google, Samsung, and Microsoft, but he also acknowledged when they did a better job. He was great at detecting his competitors' advantages and devising ways to catch up.
Jobs doesn't hold back when he says in bullet 1 of his agenda: "We further lock customers into our ecosystem while Google and Microsoft are further along on the technology, but haven't quite figured it out yet tie all of our goods together."
The plan outlined in bullet point 5 is immediately clear: catch up to Android where we are falling behind (notifications, tethering, and speech), and surpass them (Siri,). It's important to note that Siri frequently let users down and never quite lived up to expectations.
Regarding MobileMe, see Bullet 6 Jobs admits that when it comes to cloud services like contacts, calendars, and mail, Google is far ahead of Apple.
3. Adapt or perish
Steve Jobs was a visionary businessman. He knew personal computers were the future when he worked on the first Macintosh in the 1980s.
Jobs acknowledged the Post-PC age in his 2010 D8 interview.
Will the tablet replace the laptop, Walt Mossberg questioned Jobs? Jobs' response:
“You know, when we were an agrarian nation, all cars were trucks, because that’s what you needed on the farm. As vehicles started to be used in the urban centers and America started to move into those urban and suburban centers, cars got more popular and innovations like automatic transmission and things that you didn’t care about in a truck as much started to become paramount in cars. And now, maybe 1 out of every 25 vehicles is a truck, where it used to be 100%. PCs are going to be like trucks. They’re still going to be around, still going to have a lot of value, but they’re going to be used by one out of X people.”
Imagine how forward-thinking that was in 2010, especially for the Macintosh creator. You have to be willing to recognize that things were changing and that it was time to start over and focus on the next big thing.
Post-PC is priority number 8 in his 2010 agenda's 2011 Strategy section. Jobs says Apple is the first firm to get here and that Post PC items account about 66% of our income. The iPad outsold the Mac in 6 months, and the Post-PC age means increased mobility (smaller, thinner, lighter). Samsung had just introduced its first tablet, while Apple was working on the iPad 3. (as mentioned in bullet 4).
4. Plan ahead (and different)
Jobs' agenda warns that Apple risks clinging to outmoded paradigms. Clayton Christensen explains in The Innovators Dilemma that huge firms neglect disruptive technologies until they become profitable. Samsung's Galaxy tab, released too late, never caught up to Apple.
Apple faces a similar dilemma with the iPhone, its cash cow for over a decade. It doesn't sell as much because consumers aren't as excited about new iPhone launches and because technology is developing and cell phones may need to be upgraded.
Large companies' established consumer base typically hinders innovation. Clayton Christensen emphasizes that loyal customers from established brands anticipate better versions of current products rather than something altogether fresh and new technologies.
Apple's marketing is smart. Apple's ecosystem is trusted by customers, and its products integrate smoothly. So much so that Apple can afford to be a disruptor by doing something no one has ever done before, something the world's largest corporation shouldn't be the first to try. Apple can test the waters and produce a tremendous innovation tsunami, something few corporations can do.
In March 2011, Jobs appeared at an Apple event. During his address, Steve reminded us about Apple's brand:
“It’s in Apple’s DNA, that technology alone is not enough. That it’s technology married with liberal arts, married with the humanities that yields us the results that make our hearts sink. And nowhere is that more true that in these Post-PC devices.“
More than a decade later, Apple remains one of the most innovative and trailblazing companies in the Post-PC world (industry-disrupting products like Airpods or the Apple Watch came out after that 2011 strategy meeting), and it has reinvented how we use laptops with its M1-powered line of laptops offering unprecedented performance.
A decade after Jobs' death, Apple remains the world's largest firm, and its former CEO had a crucial part in its expansion. If you can do 1% of what Jobs did, you may be 1% as successful.
Not bad.
Muhammad Rahmatullah
3 years ago
The Pyramid of Coding Principles
A completely operating application requires many processes and technical challenges. Implementing coding standards can make apps right, work, and faster.
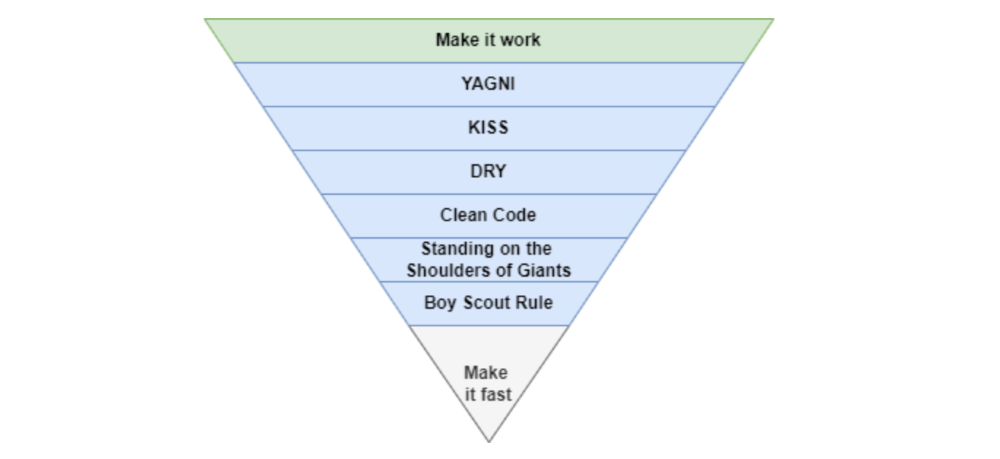
With years of experience working in software houses. Many client apps are scarcely maintained.
Why are these programs "barely maintainable"? If we're used to coding concepts, we can probably tell if an app is awful or good from its codebase.
This is how I coded much of my app.
Make It Work
Before adopting any concept, make sure the apps are completely functional. Why have a fully maintained codebase if the app can't be used?
The user doesn't care if the app is created on a super server or uses the greatest coding practices. The user just cares if the program helps them.
After the application is working, we may implement coding principles.
You Aren’t Gonna Need It
As a junior software engineer, I kept unneeded code, components, comments, etc., thinking I'd need them later.
In reality, I never use that code for weeks or months.
First, we must remove useless code from our primary codebase. If you insist on keeping it because "you'll need it later," employ version control.
If we remove code from our codebase, we can quickly roll back or copy-paste the previous code without preserving it permanently.
The larger the codebase, the more maintenance required.
Keep It Simple Stupid

Indeed. Keep things simple.
Why complicate something if we can make it simpler?
Our code improvements should lessen the server load and be manageable by others.
If our code didn't pass those benchmarks, it's too convoluted and needs restructuring. Using an open-source code critic or code smell library, we can quickly rewrite the code.
Simpler codebases and processes utilize fewer server resources.
Don't Repeat Yourself
Have you ever needed an action or process before every action, such as ensuring the user is logged in before accessing user pages?

As you can see from the above code, I try to call is user login? in every controller action, and it should be optimized, because if we need to rename the method or change the logic, etc. We can improve this method's efficiency.
We can write a constructor/middleware/before action that calls is_user_login?

The code is more maintainable and readable after refactoring.
Each programming language or framework handles this issue differently, so be adaptable.
Clean Code
Clean code is a broad notion that you've probably heard of before.
When creating a function, method, module, or variable name, the first rule of clean code is to be precise and simple.
The name should express its value or logic as a whole, and follow code rules because every programming language is distinct.
If you want to learn more about this topic, I recommend reading https://www.amazon.com/Clean-Code-Handbook-Software-Craftsmanship/dp/0132350882.
Standing On The Shoulder of Giants
Use industry standards and mature technologies, not your own(s).
There are several resources that explain how to build boilerplate code with tools, how to code with best practices, etc.
I propose following current conventions, best practices, and standardization since we shouldn't innovate on top of them until it gives us a competitive edge.
Boy Scout Rule
What reduces programmers' productivity?
When we have to maintain or build a project with messy code, our productivity decreases.
Having to cope with sloppy code will slow us down (shame of us).
How to cope? Uncle Bob's book says, "Always leave the campground cleaner than you found it."
When developing new features or maintaining current ones, we must improve our codebase. We can fix minor issues too. Renaming variables, deleting whitespace, standardizing indentation, etc.
Make It Fast
After making our code more maintainable, efficient, and understandable, we can speed up our app.
Whether it's database indexing, architecture, caching, etc.
A smart craftsman understands that refactoring takes time and it's preferable to balance all the principles simultaneously. Don't YAGNI phase 1.
Using these ideas in each iteration/milestone, while giving the bottom items less time/care.
You can check one of my articles for further information. https://medium.com/life-at-mekari/why-does-my-website-run-very-slowly-and-how-do-i-optimize-it-for-free-b21f8a2f0162

Onchain Wizard
3 years ago
Three Arrows Capital & Celsius Updates
I read 1k+ page 3AC liquidation documentation so you don't have to. Also sharing revised Celsius recovery plans.
3AC's liquidation documents:
Someone disclosed 3AC liquidation records in the BVI courts recently. I'll discuss the leak's timeline and other highlights.
Three Arrows Capital began trading traditional currencies in emerging markets in 2012. They switched to equities and crypto, then purely crypto in 2018.
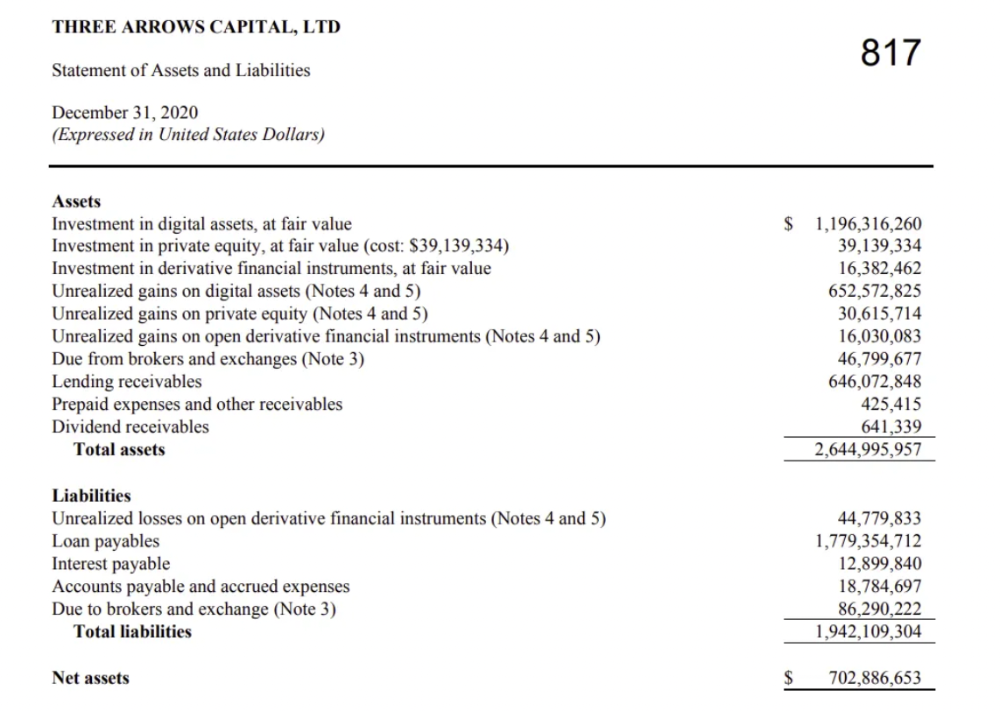
By 2020, the firm had $703mm in net assets and $1.8bn in loans (these guys really like debt).
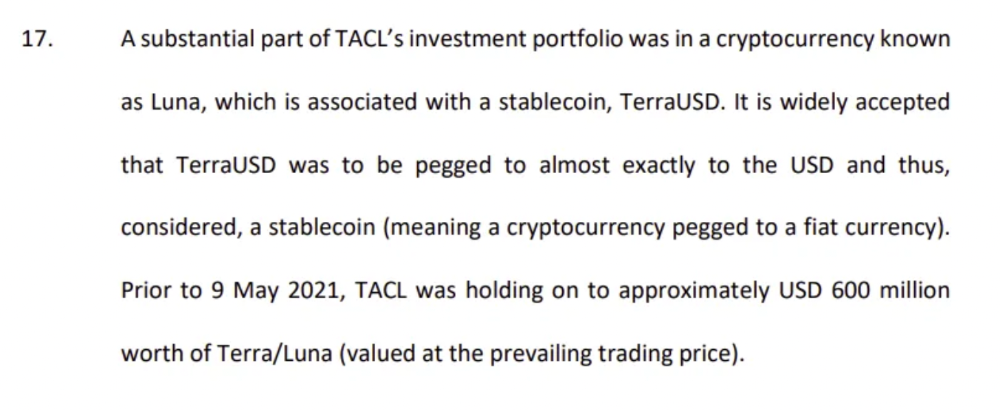
The firm's net assets under control reached $3bn in April 2022, according to the filings. 3AC had $600mm of LUNA/UST exposure before May 9th 2022, which put them over.
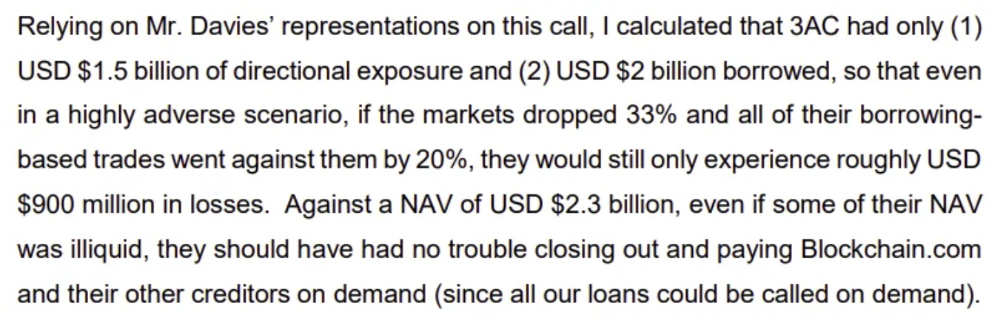
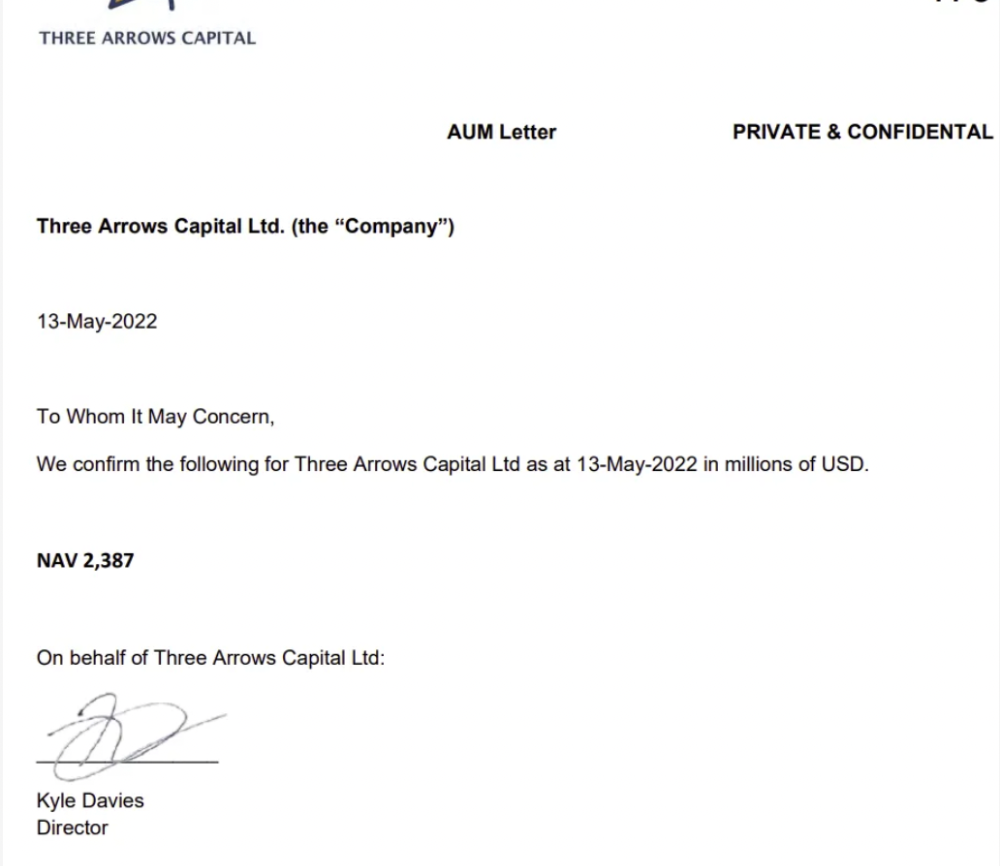
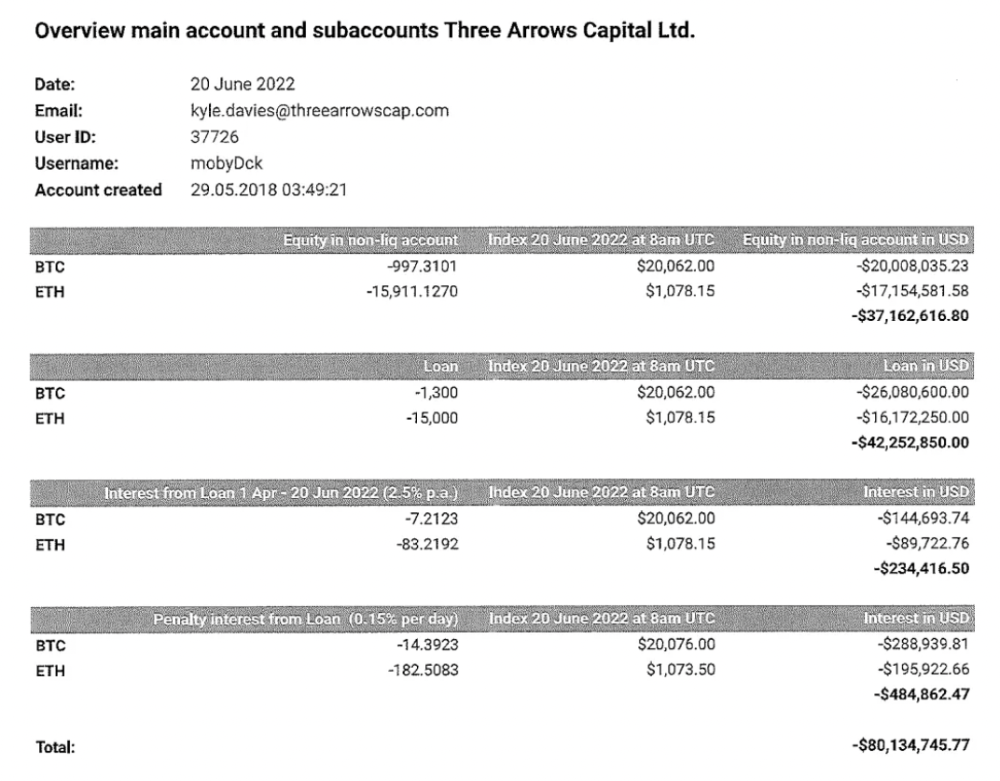
LUNA and UST go to zero quickly (I wrote about the mechanics of the blowup here). Kyle Davies, 3AC co-founder, told Blockchain.com on May 13 that they have $2.4bn in assets and $2.3bn NAV vs. $2bn in borrowings. As BTC and ETH plunged 33% and 50%, the company became insolvent by mid-2022.
3AC sent $32mm to Tai Ping Shen, a Cayman Islands business owned by Su Zhu and Davies' partner, Kelly Kaili Chen (who knows what is going on here).
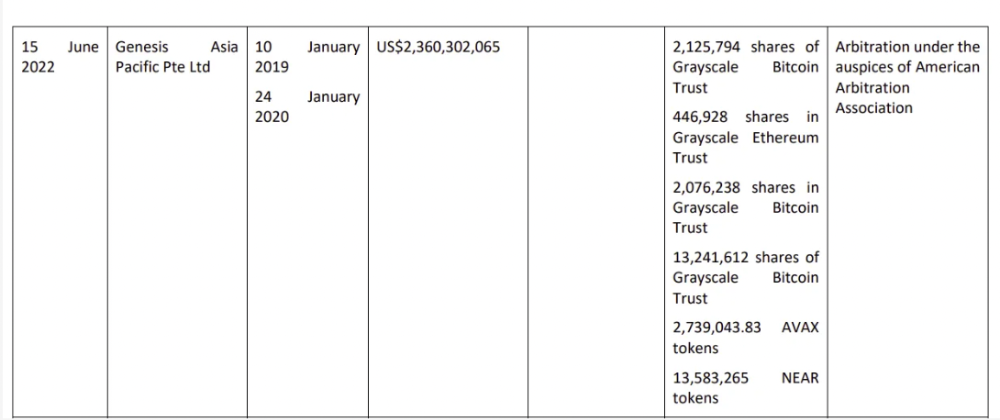
3AC had borrowed over $3.5bn in notional principle, with Genesis ($2.4bn) and Voyager ($650mm) having the most exposure.
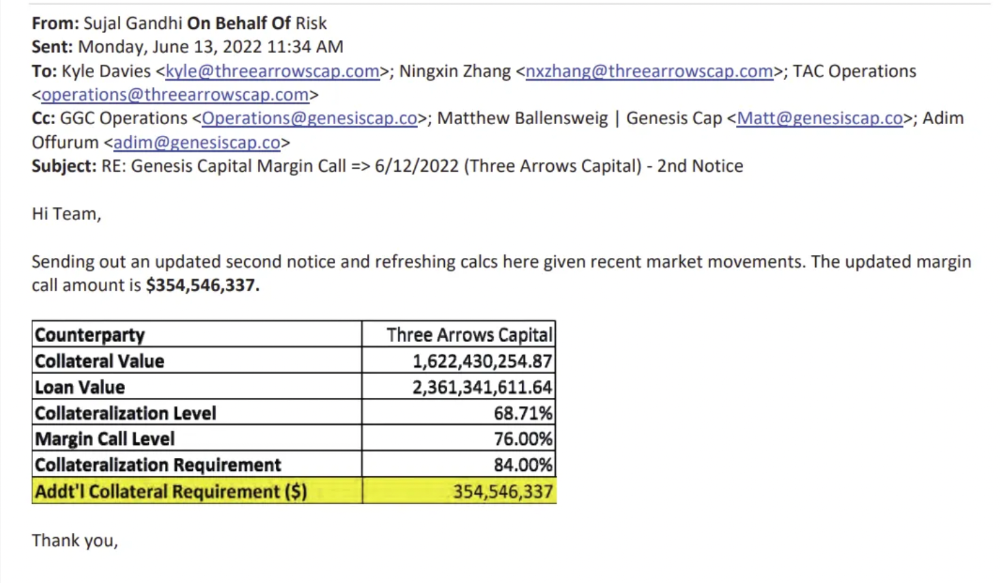
Genesis demanded $355mm in further collateral in June.
Deribit (another 3AC investment) called for $80 million in mid-June.
Even in mid-June, the corporation was trying to borrow more money to stay afloat. They approached Genesis for another $125mm loan (to pay another lender) and HODLnauts for BTC & ETH loans.
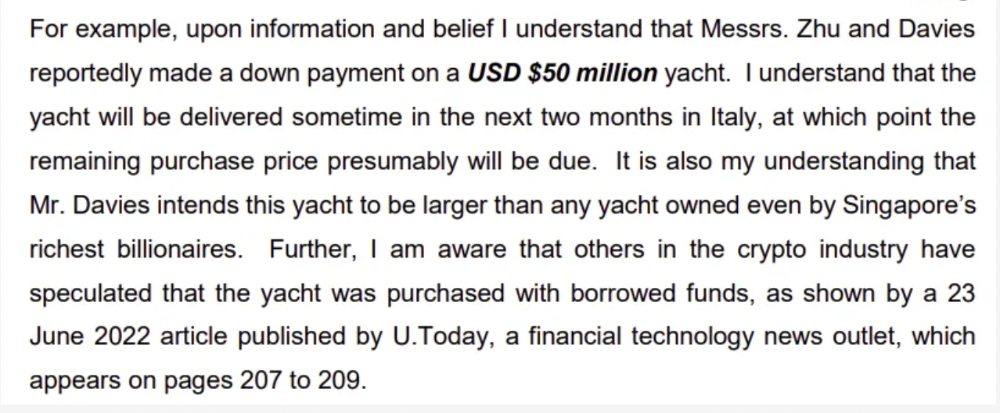
Pretty crazy. 3AC founders used borrowed money to buy a $50 million boat, according to the leak.
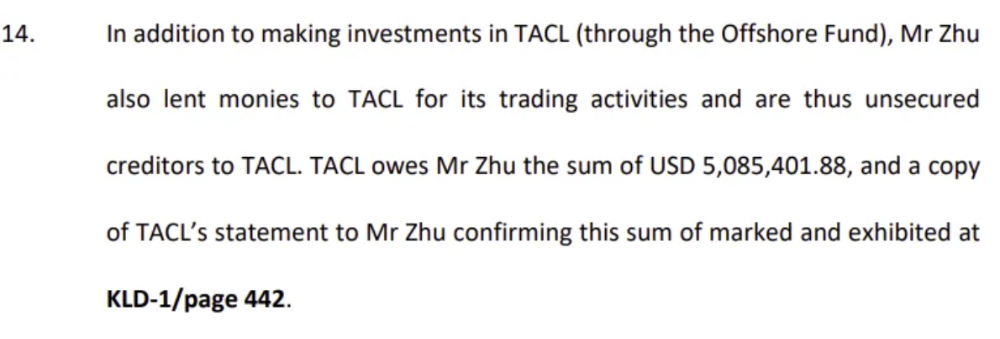
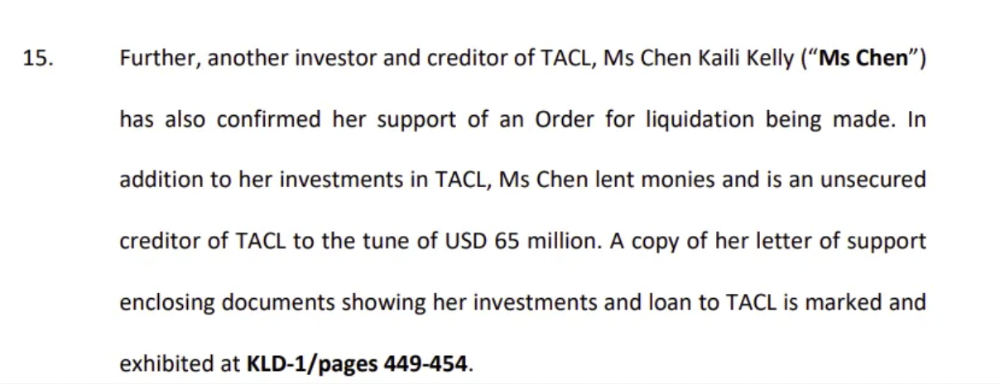
Su requesting for $5m + Chen Kaili Kelly asserting they loaned $65m unsecured to 3AC are identified as creditors.
Celsius:
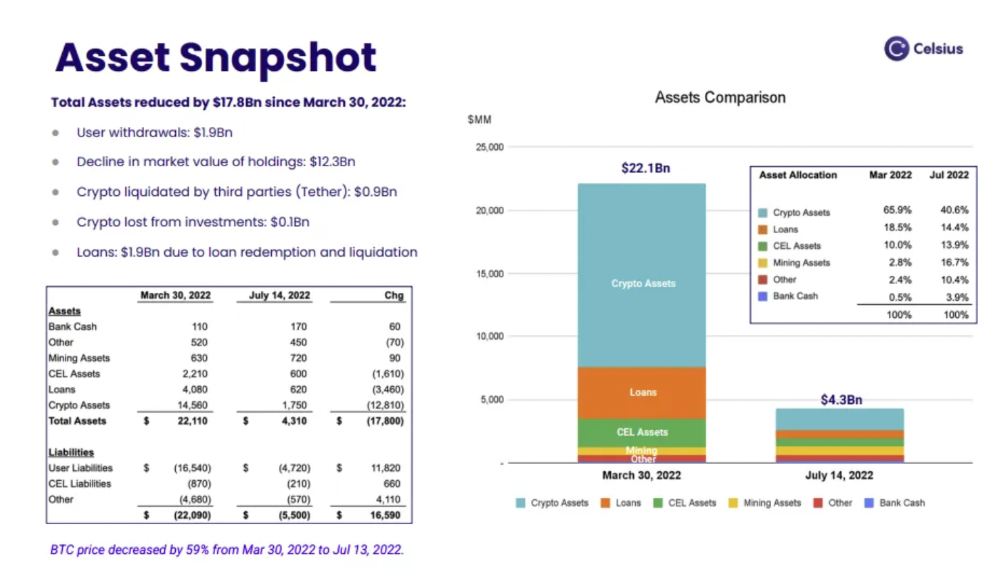
This bankruptcy presentation shows the Celsius breakdown from March to July 14, 2022. From $22bn to $4bn, crypto assets plummeted from $14.6bn to $1.8bn (ouch). $16.5bn in user liabilities dropped to $4.72bn.
In my recent post, I examined if "forced selling" is over, with Celsius' crypto assets being a major overhang. In this presentation, it looks that Chapter 11 will provide clients the opportunity to accept cash at a discount or remain long crypto. Provided that a fresh source of money is unlikely to enter the Celsius situation, cash at a discount or crypto given to customers will likely remain a near-term market risk - cash at a discount will likely come from selling crypto assets, while customers who receive crypto could sell at any time. I'll share any Celsius updates I find.
Conclusion
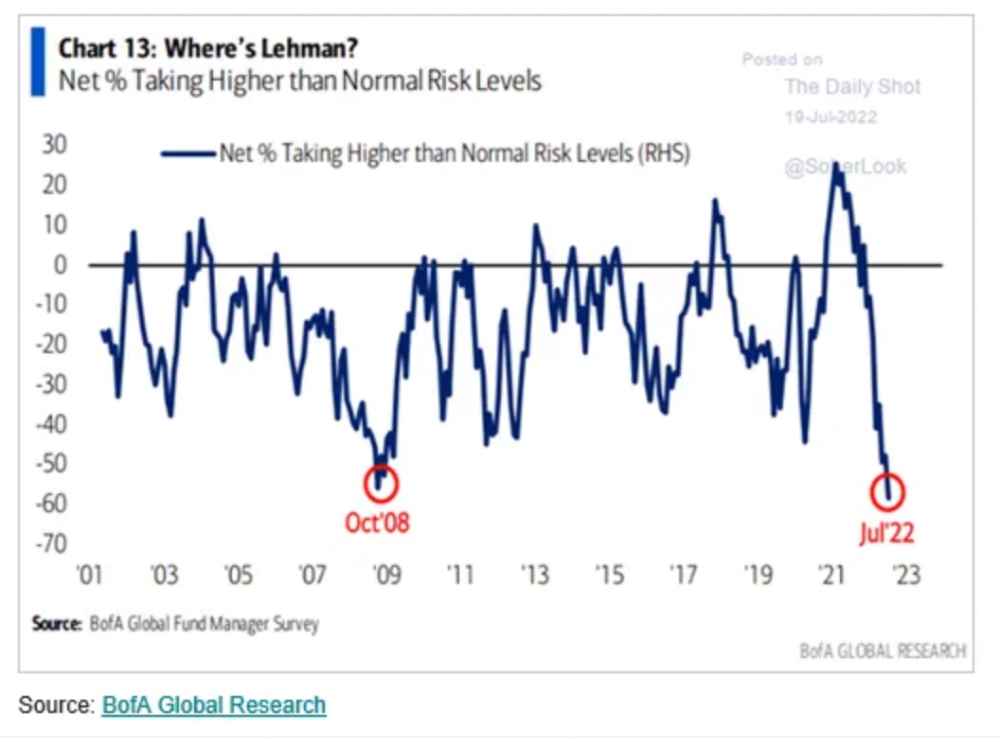
Only Celsius and the Mt Gox BTC unlock remain as forced selling catalysts. While everything went through a "relief" pump, with ETH up 75% from the bottom and numerous alts multiples higher, there are still macro dangers to equities + risk assets. There's a lot of wealth waiting to be deployed in crypto ($153bn in stables), but fund managers are risk apprehensive (lower than 2008 levels).
We're hopefully over crypto's "bottom," with peak anxiety and forced selling behind us, but we may chop around.
To see the full article, click here.