


More on Marketing

Jenn Leach
3 years ago
This clever Instagram marketing technique increased my sales to $30,000 per month.
No Paid Ads Required

I had an online store. After a year of running the company alongside my 9-to-5, I made enough to resign.
That day was amazing.
This Instagram marketing plan helped the store succeed.
How did I increase my sales to five figures a month without using any paid advertising?
I used customer event marketing.
I'm not sure this term exists. I invented it to describe what I was doing.
Instagram word-of-mouth, fan engagement, and interaction drove sales.
If a customer liked or disliked a product, the buzz would drive attention to the store.
I used customer-based events to increase engagement and store sales.
Success!
Here are the weekly Instagram customer events I coordinated while running my business:
Be the Buyer Days
Flash sales
Mystery boxes
Be the Buyer Days: How do they work?
Be the Buyer Days are exactly that.
You choose a day to share stock selections with social media followers.
This is an easy approach to engaging customers and getting fans enthusiastic about new releases.
First, pick a handful of items you’re considering ordering. I’d usually pick around 3 for Be the Buyer Day.
Then I'd poll the crowd on Instagram to vote on their favorites.
This was before Instagram stories, polls, and all the other cool features Instagram offers today. I think using these tools now would make this event even better.
I'd ask customers their favorite back then.
The growing comments excited customers.
Then I'd declare the winner, acquire the products, and start selling it.
How do flash sales work?
I mostly ran flash sales.
You choose a limited number of itemsdd for a few-hour sale.
We wanted most sales to result in sold-out items.
When an item sells out, it contributes to the sensation of scarcity and can inspire customers to visit your store to buy a comparable product, join your email list, become a fan, etc.
We hoped they'd act quickly.
I'd hold flash deals twice a week, which generated scarcity and boosted sales.
The store had a few thousand Instagram followers when I started flash deals.
Each flash sale item would make $400 to $600.
$400 x 3= $1,200
That's $1,200 on social media!
Twice a week, you'll make roughly $10K a month from Instagram.
$1,200/day x 8 events/month=$9,600
Flash sales did great.
We held weekly flash deals and sent social media and email reminders. That’s about it!
How are mystery boxes put together?
All you do is package a box of store products and sell it as a mystery box on TikTok or retail websites.
A $100 mystery box would cost $30.
You're discounting high-value boxes.
This is a clever approach to get rid of excess inventory and makes customers happy.
It worked!
Be the Buyer Days, flash deals, and mystery boxes helped build my company without paid advertisements.
All companies can use customer event marketing. Involving customers and providing an engaging environment can boost sales.
Try it!

Jon Brosio
3 years ago
This Landing Page is a (Legal) Money-Printing Machine
and it’s easy to build.

A landing page with good copy is a money-maker.
Let's be honest, page-builder templates are garbage.
They can help you create a nice-looking landing page, but not persuasive writing.
Over the previous 90 days, I've examined 200+ landing pages.
What's crazy?
Top digital entrepreneurs use a 7-part strategy to bring in email subscribers, generate prospects, and (passively) sell their digital courses.
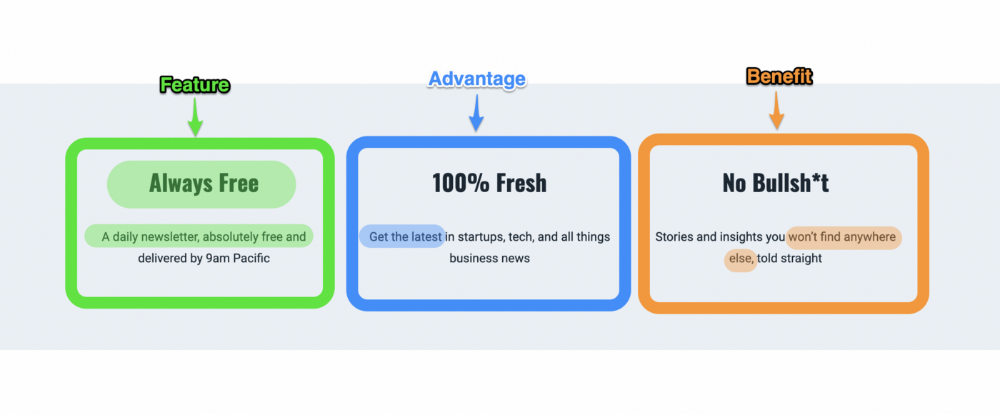
Steal this 7-part landing page architecture to maximize digital product sales.
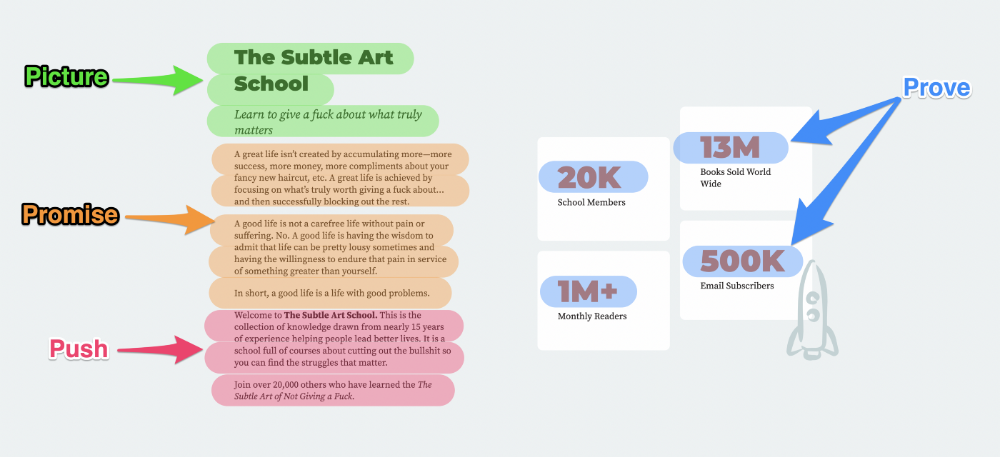
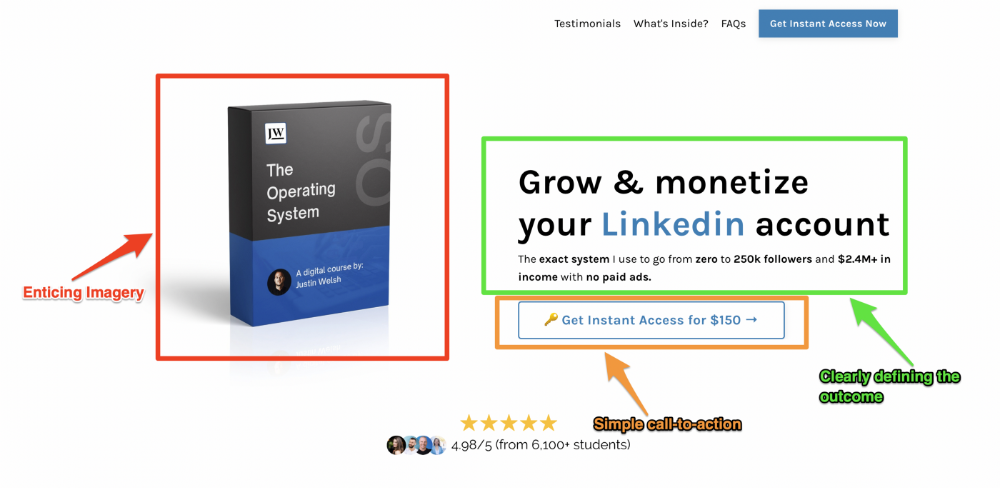
The offer
Landing pages require offers.
Newsletter, cohort, or course offer.
Your reader should see this offer first. Includind:
Headline
Imagery
Call-to-action
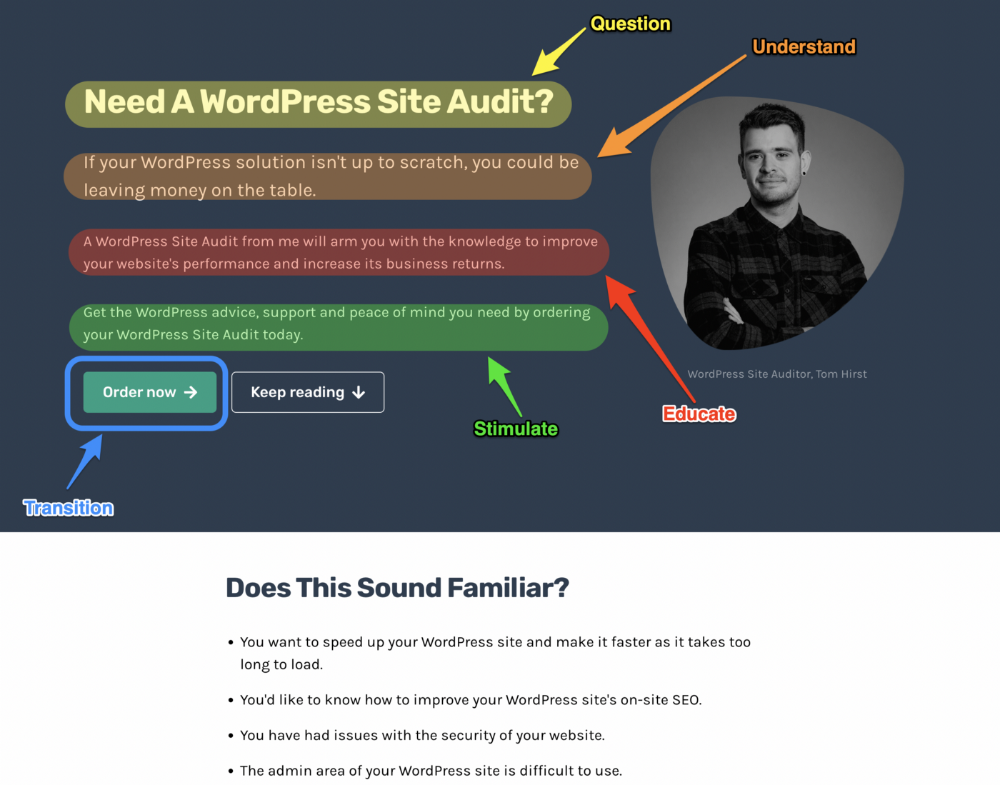
Clear, persuasive, and simplicity are key. Example: the Linkedin OS course home page of digital entrepreneur Justin Welsh offers:
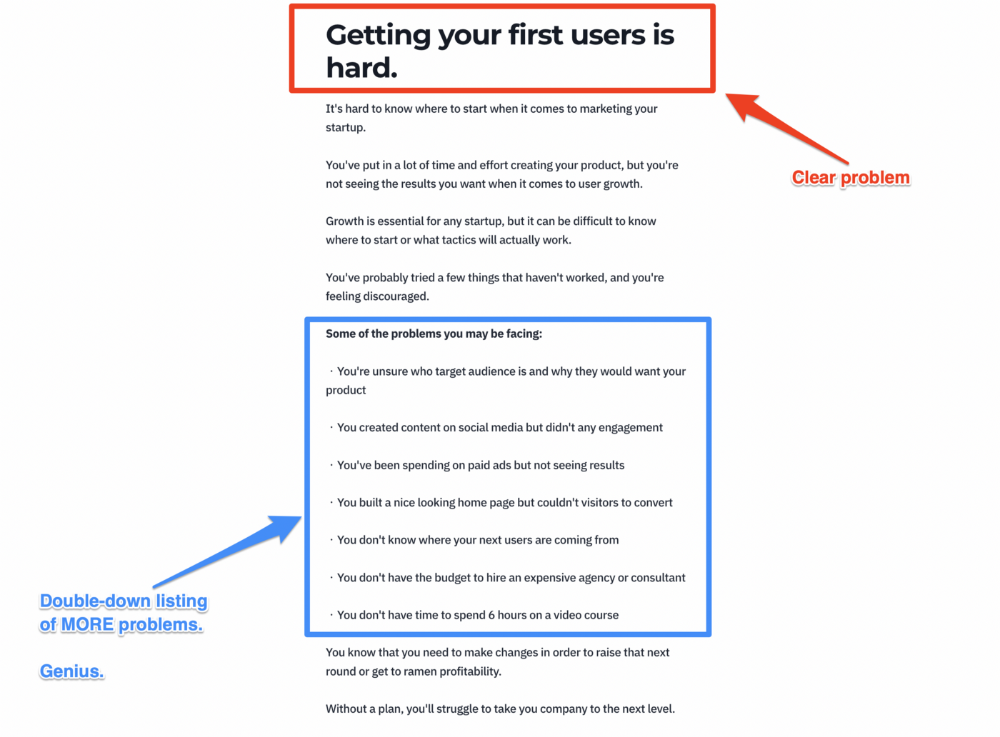
A distinctly defined problem
Everyone needs an enemy.
You need an opponent on your landing page. Problematic.
Next, employ psychology to create a struggle in your visitor's thoughts.
Don't be clever here; label your customer's problem. The more particular you are, the bigger the situation will seem.
When you build a clear monster, you invite defeat. I appreciate Theo Ohene's Growth Roadmaps landing page.
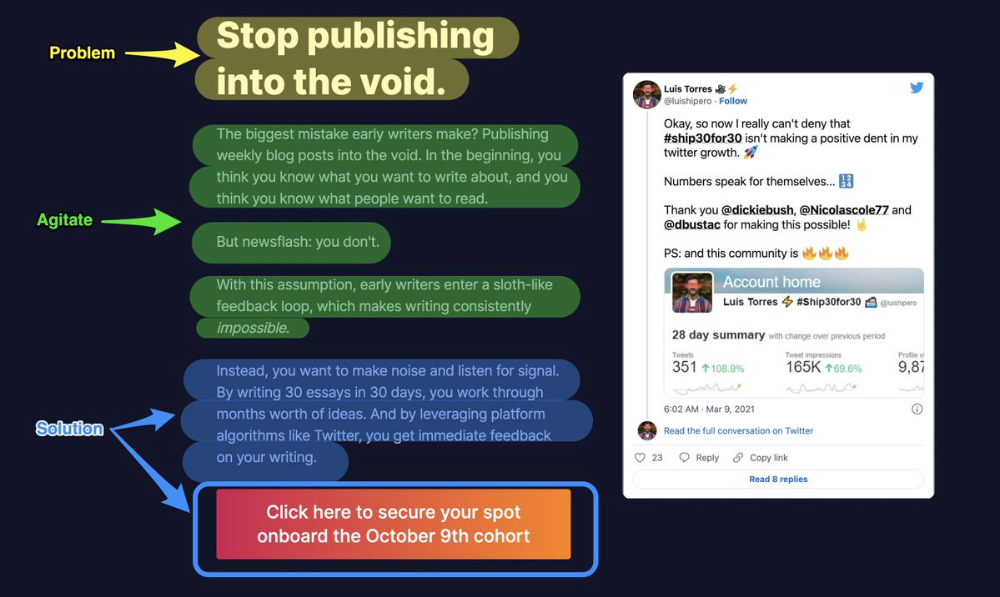
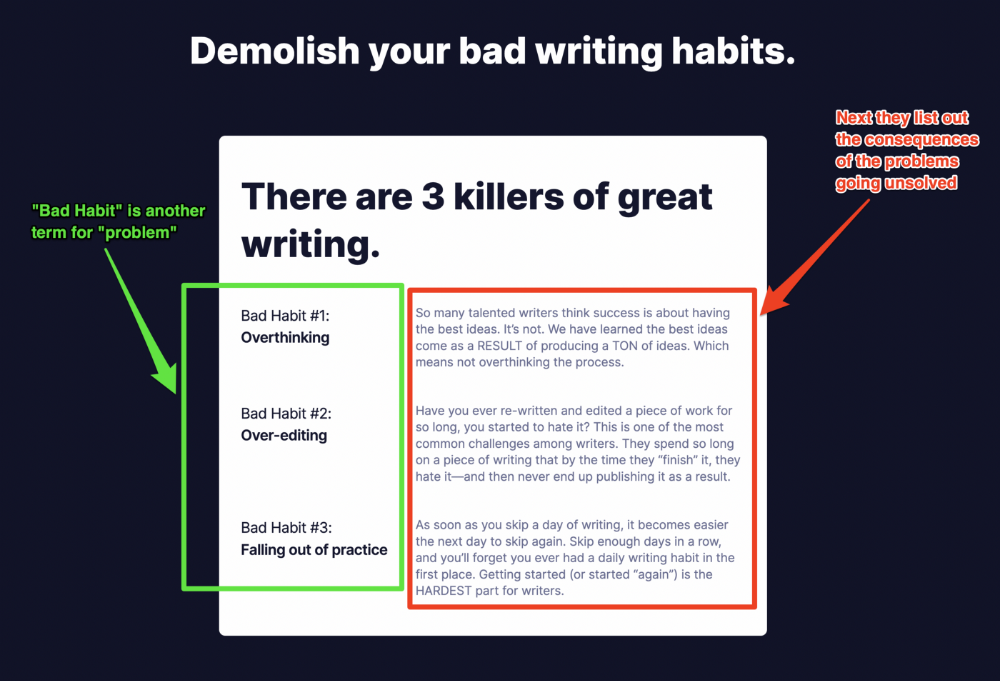
Exacerbation of the effects
Problem identification doesn't motivate action.
What would an unresolved problem mean?
This is landing page copy. When you describe the unsolved problem's repercussions, you accomplish several things:
You write a narrative (and stories are remembered better than stats)
You cause the reader to feel something.
You help the reader relate to the issue
Important!
My favorite script is:
"Sure, you can let [problem] go untreated. But what will happen if you do? Soon, you'll begin to notice [new problem 1] will start to arise. That might bring up [problem 2], etc."
Take the copywriting course, digital writer and entrepreneur Dickie Bush illustrates below when he labels the problem (see: "poor habit") and then illustrates the repercussions.
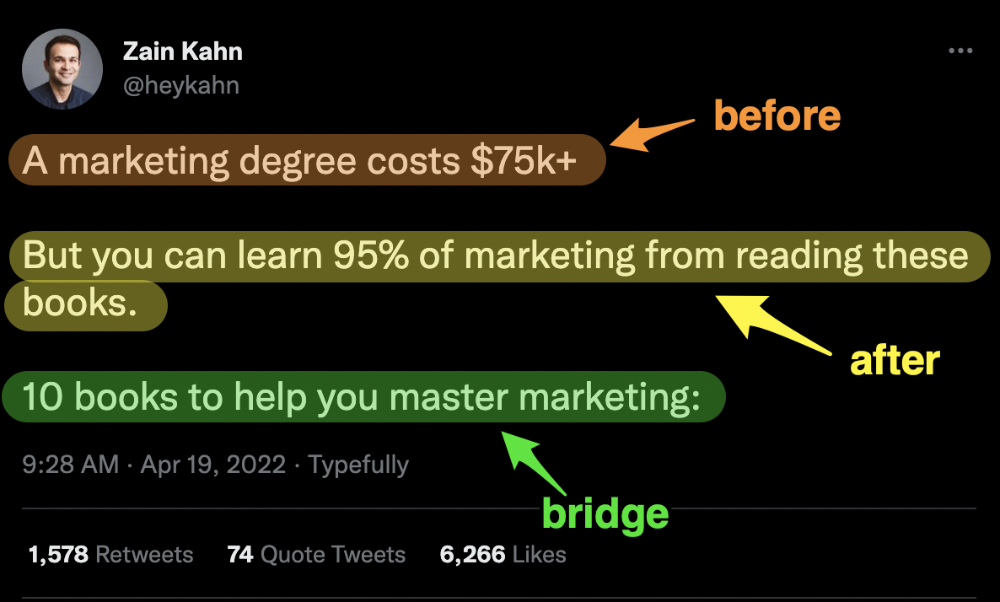
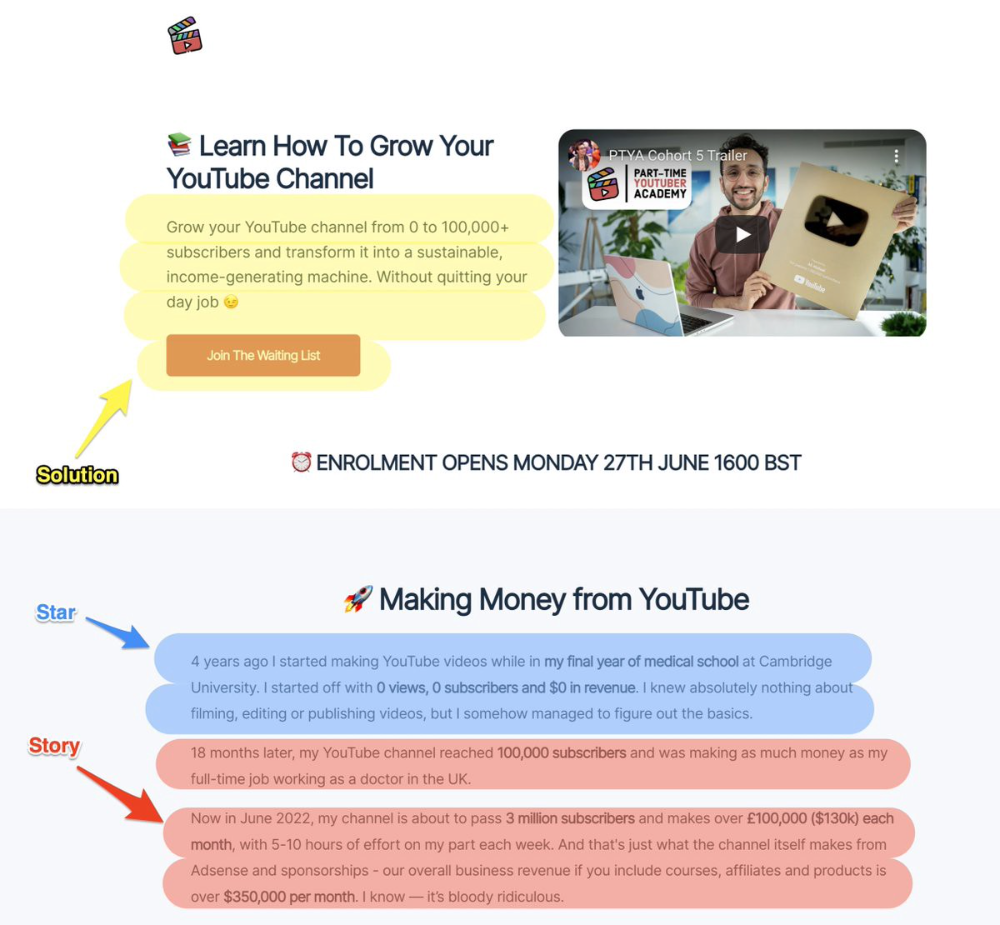
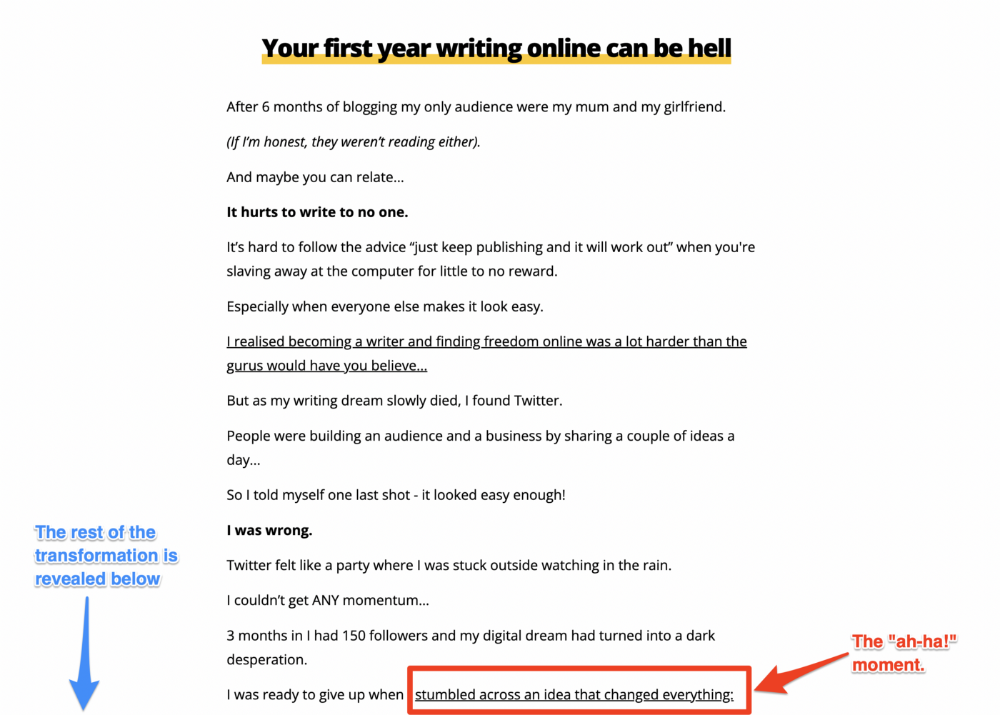
The tale of transformation
Every landing page needs that "ah-ha!" moment.
Transformation stories do this.
Did you find a solution? Someone else made the discovery? Have you tested your theory?
Next, describe your (or your subject's) metamorphosis.
Kieran Drew nails his narrative (and revelation) here. Right before the disclosure, he introduces his "ah-ha!" moment:
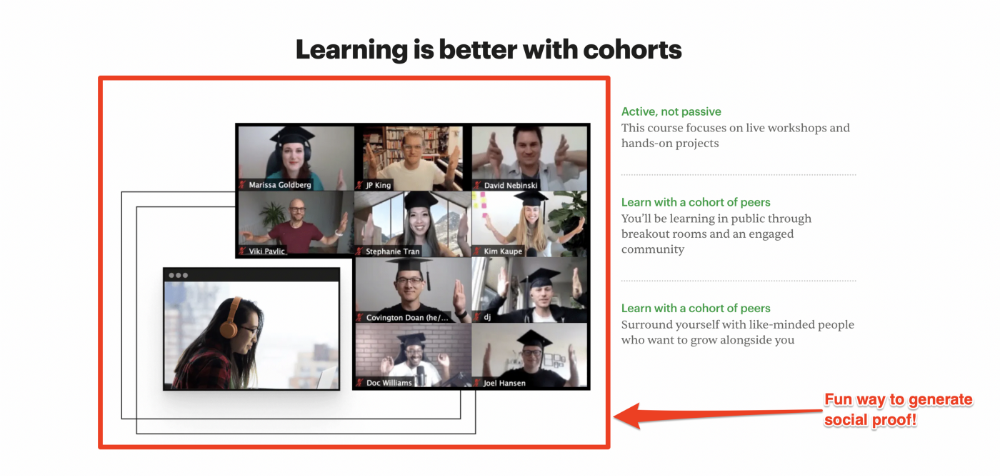
Testimonials
Social proof completes any landing page.
Social proof tells the reader, "If others do it, it must be worthwhile."
This is your argument.
Positive social proof helps (obviously).
Offer "free" training in exchange for a testimonial if you need social evidence. This builds social proof.
Most social proof is testimonies (recommended). Kurtis Hanni's creative take on social proof (using a screenshot of his colleague) is entertaining.
Bravo.
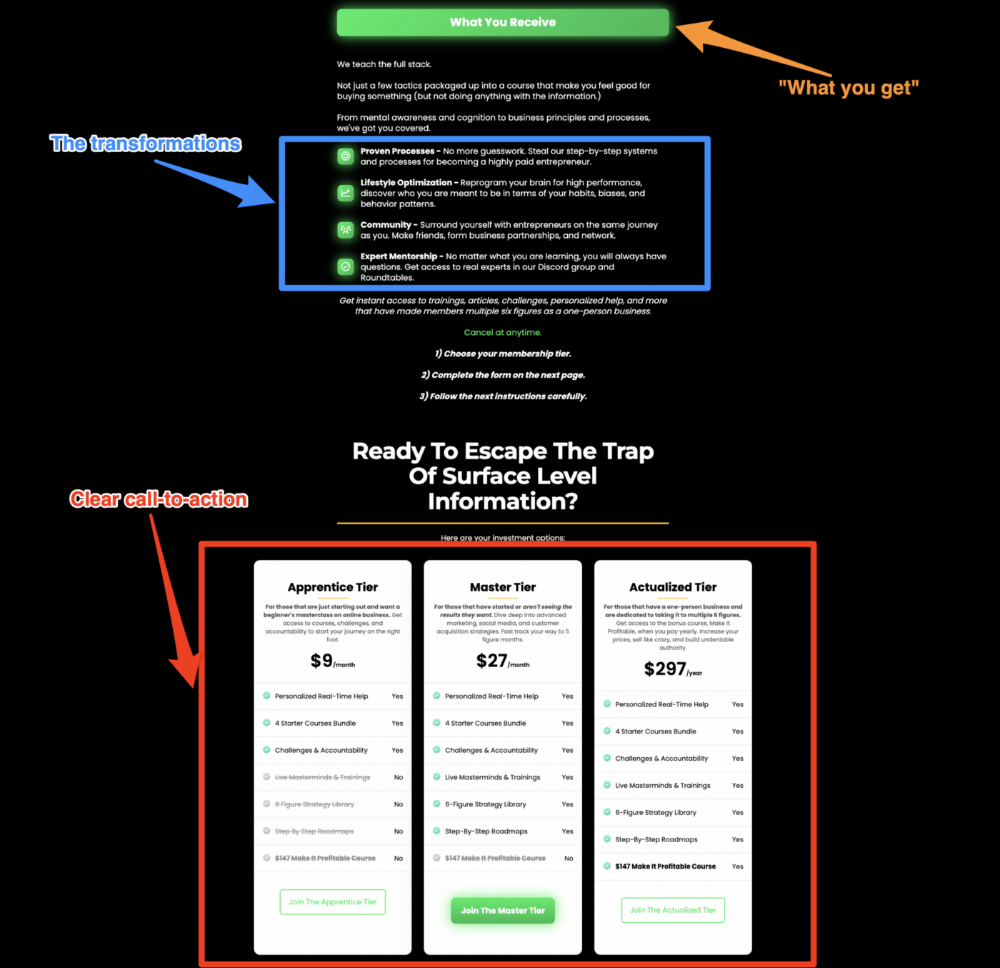
Reveal your offer
Now's the moment to act.
Describe the "bundle" that provides the transformation.
Here's:
Course
Cohort
Ebook
Whatever you're selling.
Include a product or service image, what the consumer is getting ("how it works"), the price, any "free" bonuses (preferred), and a CTA ("buy now").
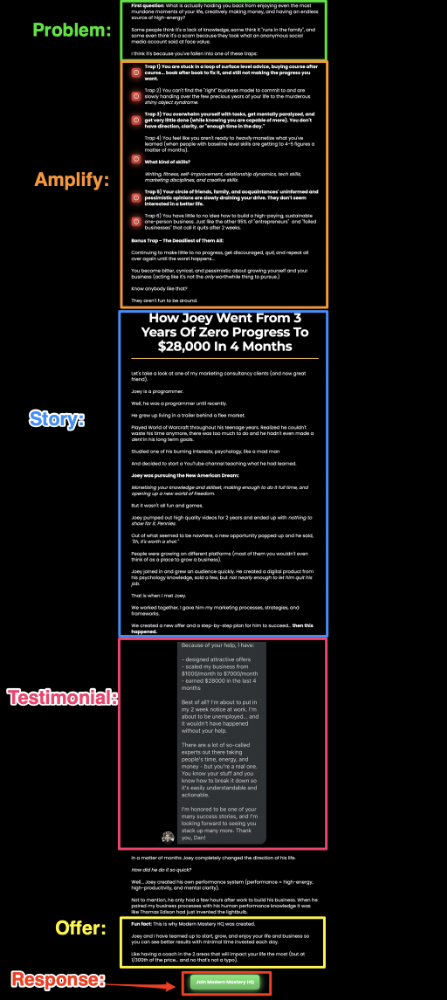
Clarity is key. Don't make a cunning offer. Make sure your presentation emphasizes customer change (benefits). Dan Koe's Modern Mastery landing page makes an offer. Consider:
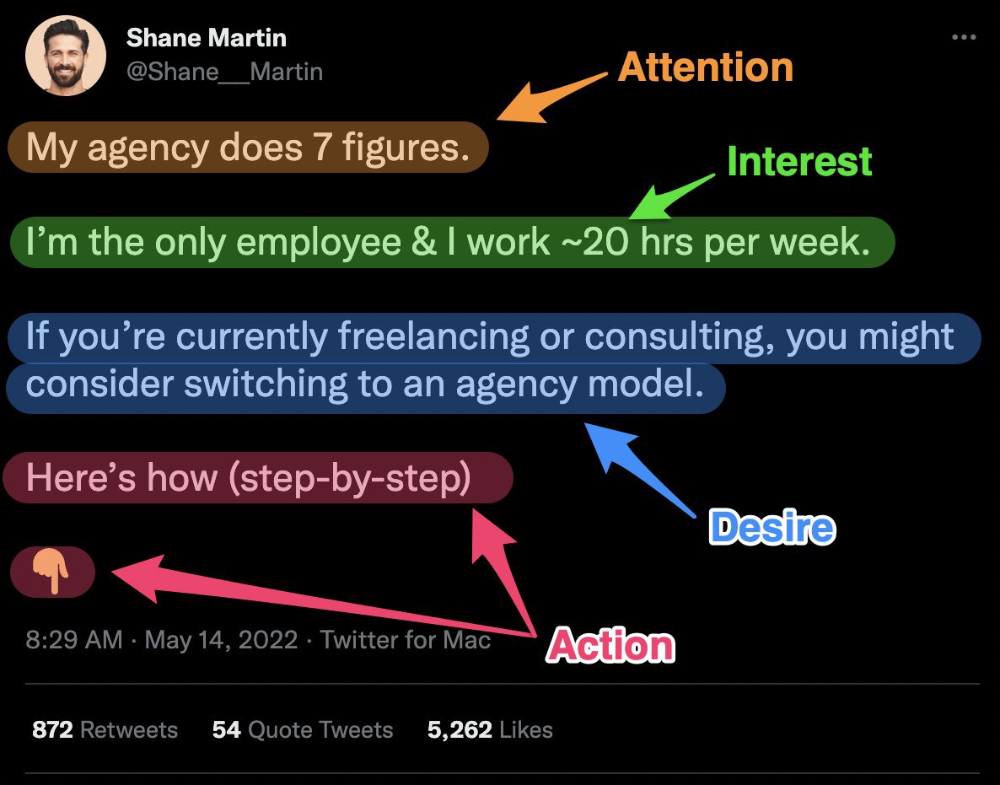
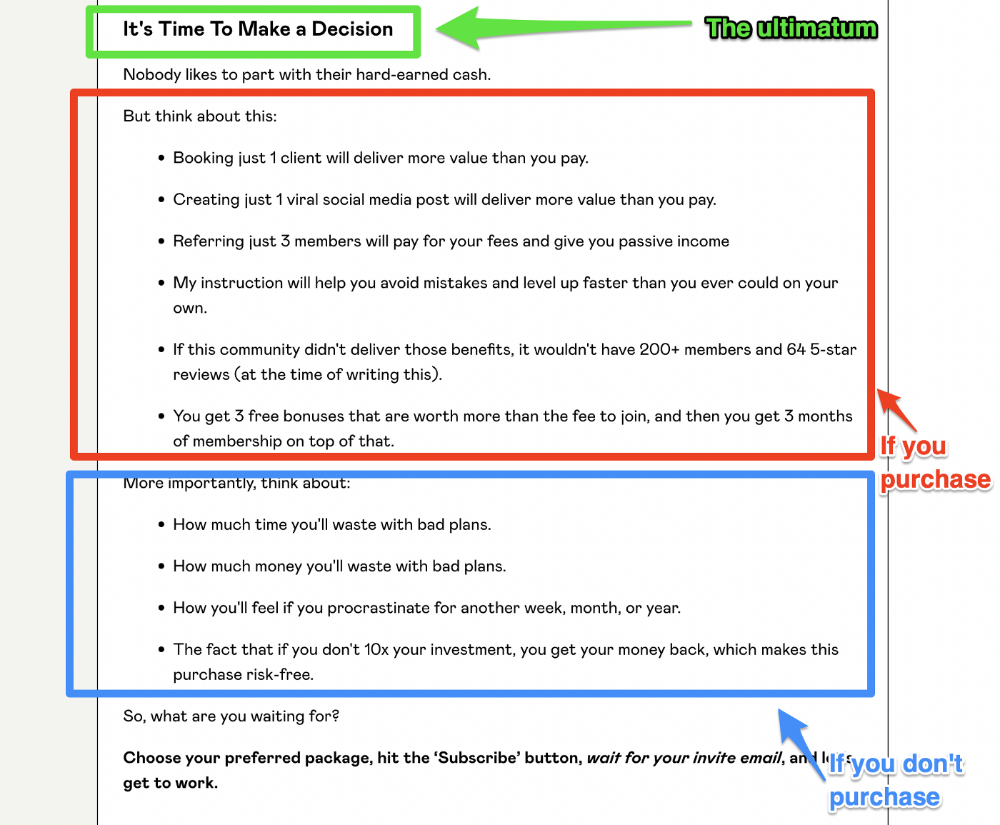
An ultimatum
Offering isn't enough.
You must give your prospect an ultimatum.
They can buy your merchandise from you.
They may exit the webpage.
That’s it.
It's crucial to show what happens if the reader does either. Stress the consequences of not buying (again, a little consequence amplification). Remind them of the benefits of buying.
I appreciate Charles Miller's product offer ending:
The top online creators use a 7-part landing page structure:
Offer the service
Describe the problem
Amplify the consequences
Tell the transformational story
Include testimonials and social proof.
Reveal the offer (with any bonuses if applicable)
Finally, give the reader a deadline to encourage them to take action.
Sequence these sections to develop a landing page that (essentially) prints money.

Saskia Ketz
2 years ago
I hate marketing for my business, but here's how I push myself to keep going
Start now.

When it comes to building my business, I’m passionate about a lot of things. I love creating user experiences that simplify branding essentials. I love creating new typefaces and color combinations to inspire logo designers. I love fixing problems to improve my product.
Business marketing isn't my thing.
This is shared by many. Many solopreneurs, like me, struggle to advertise their business and drive themselves to work on it.
Without a lot of promotion, no company will succeed. Marketing is 80% of developing a firm, and when you're starting out, it's even more. Some believe that you shouldn't build anything until you've begun marketing your idea and found enough buyers.
Marketing your business without marketing experience is difficult. There are various outlets and techniques to learn. Instead of figuring out where to start, it's easier to return to your area of expertise, whether that's writing, designing product features, or improving your site's back end. Right?
First, realize that your role as a founder is to market your firm. Being a founder focused on product, I rarely work on it.
Secondly, use these basic methods that have helped me dedicate adequate time and focus to marketing. They're all simple to apply, and they've increased my business's visibility and success.
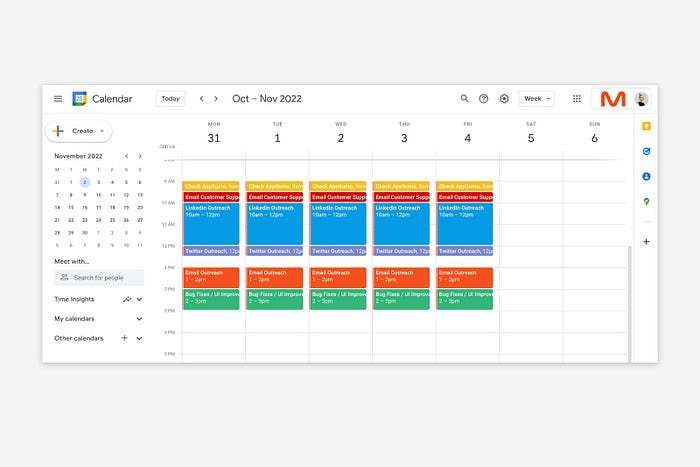
1. Establish buckets for every task.
You've probably heard to schedule tasks you don't like. As simple as it sounds, blocking a substantial piece of my workday for marketing duties like LinkedIn or Twitter outreach, AppSumo customer support, or SEO has forced me to spend time on them.
Giving me lots of room to focus on product development has helped even more. Sure, this means scheduling time to work on product enhancements after my four-hour marketing sprint.
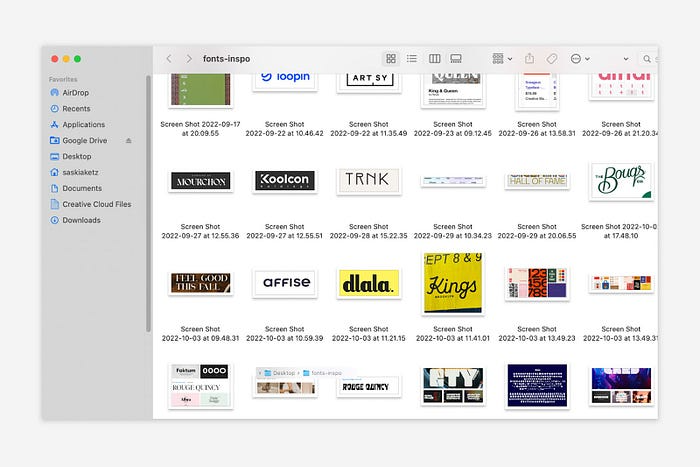
It also involves making space to store product inspiration and ideas throughout the day so I don't get distracted. This is like the advice to keep a notebook beside your bed to write down your insomniac ideas. I keep fonts, color palettes, and product ideas in folders on my desktop. Knowing these concepts won't be lost lets me focus on marketing in the moment. When I have limited time to work on something, I don't have to conduct the research I've been collecting, so I can get more done faster.
2. Look for various accountability systems
Accountability is essential for self-discipline. To keep focused on my marketing tasks, I've needed various streams of accountability, big and little.
Accountability groups are great for bigger things. SaaS Camp, a sales outreach coaching program, is mine. We discuss marketing duties and results every week. This motivates me to do enough each week to be proud of my accomplishments. Yet hearing what works (or doesn't) for others gives me benchmarks for my own marketing outcomes and plenty of fresh techniques to attempt.
… say, I want to DM 50 people on Twitter about my product — I get that many Q-tips and place them in one pen holder on my desk.
The best accountability group can't watch you 24/7. I use a friend's simple method that shouldn't work (but it does). When I have a lot of marketing chores, like DMing 50 Twitter users about my product, That many Q-tips go in my desk pen holder. After each task, I relocate one Q-tip to an empty pen holder. When you have a lot of minor jobs to perform, it helps to see your progress. You might use toothpicks, M&Ms, or anything else you have a lot of.

3. Continue to monitor your feedback loops
Knowing which marketing methods work best requires monitoring results. As an entrepreneur with little go-to-market expertise, every tactic I pursue is an experiment. I need to know how each trial is doing to maximize my time.
I placed Google and Facebook advertisements on hold since they took too much time and money to obtain Return. LinkedIn outreach has been invaluable to me. I feel that talking to potential consumers one-on-one is the fastest method to grasp their problem areas, figure out my messaging, and find product market fit.
Data proximity offers another benefit. Seeing positive results makes it simpler to maintain doing a work you don't like. Why every fitness program tracks progress.
Marketing's goal is to increase customers and revenues, therefore I've found it helpful to track those metrics and celebrate monthly advances. I provide these updates for extra accountability.
Finding faster feedback loops is also motivating. Marketing brings more clients and feedback, in my opinion. Product-focused founders love that feedback. Positive reviews make me proud that my product is benefitting others, while negative ones provide me with suggestions for product changes that can improve my business.
The best advice I can give a lone creator who's afraid of marketing is to just start. Start early to learn by doing and reduce marketing stress. Start early to develop habits and successes that will keep you going. The sooner you start, the sooner you'll have enough consumers to return to your favorite work.
You might also like

Pat Vieljeux
3 years ago
The three-year business plan is obsolete for startups.
If asked, run.

An entrepreneur asked me about her pitch deck. A Platform as a Service (PaaS).
She told me she hadn't done her 5-year forecasts but would soon.
I said, Don't bother. I added "time-wasting."
“I've been asked”, she said.
“Who asked?”
“a VC”
“5-year forecast?”
“Yes”
“Get another VC. If he asks, it's because he doesn't understand your solution or to waste your time.”
Some VCs are lagging. They're still using steam engines.
10-years ago, 5-year forecasts were requested.
Since then, we've adopted a 3-year plan.
But It's outdated.
Max one year.
What has happened?
Revolutionary technology. NO-CODE.
Revolution's consequences?
Product viability tests are shorter. Hugely. SaaS and PaaS.
Let me explain:
Building a minimum viable product (MVP) that works only takes a few months.
1 to 2 months for practical testing.
Your company plan can be validated or rejected in 4 months as a consequence.
After validation, you can ask for VC money. Even while a prototype can generate revenue, you may not require any.
Good VCs won't ask for a 3-year business plan in that instance.
One-year, though.
If you want, establish a three-year plan, but realize that the second year will be different.
You may have changed your business model by then.
A VC isn't interested in a three-year business plan because your solution may change.
Your ability to create revenue will be key.
But also, to pivot.
They will be interested in your value proposition.
They will want to know what differentiates you from other competitors and why people will buy your product over another.
What will interest them is your resilience, your ability to bounce back.
Not to mention your mindset. The fact that you won’t get discouraged at the slightest setback.
The grit you have when facing adversity, as challenges will surely mark your journey.
The authenticity of your approach. They’ll want to know that you’re not just in it for the money, let alone to show off.
The fact that you put your guts into it and that you are passionate about it. Because entrepreneurship is a leap of faith, a leap into the void.
They’ll want to make sure you are prepared for it because it’s not going to be a walk in the park.
They’ll want to know your background and why you got into it.
They’ll also want to know your family history.
And what you’re like in real life.
So a 5-year plan…. You can bet they won’t give a damn. Like their first pair of shoes.

Jano le Roux
3 years ago
Never Heard Of: The Apple Of Email Marketing Tools
Unlimited everything for $19 monthly!?

Even with pretty words, no one wants to read an ugly email.
Not Gen Z
Not Millennials
Not Gen X
Not Boomers
I am a minimalist.
I like Mozart. I like avos. I love Apple.
When I hear seamlessly, effortlessly, or Apple's new adverb fluidly, my toes curl.
No email marketing tool gave me that feeling.
As a marketing consultant helping high-growth brands create marketing that doesn't feel like marketing, I've worked with every email marketing platform imaginable, including that naughty monkey and the expensive platform whose sales teams don't stop calling.
Most email marketing platforms are flawed.
They are overpriced.
They use dreadful templates.
They employ a poor visual designer.
The user experience there is awful.
Too many useless buttons are present. (Similar to the TV remote!)
I may have finally found the perfect email marketing tool. It creates strong flows. It helps me focus on storytelling.
It’s called Flodesk.
It’s effortless. It’s seamless. It’s fluid.
Here’s why it excites me.
Unlimited everything for $19 per month
Sends unlimited. Emails unlimited. Signups unlimited.
Most email platforms penalize success.
Pay for performance?
$87 for 10k contacts
$605 for 100K contacts
$1,300+ for 200K contacts
In the 1990s, this made sense, but not now. It reminds me of when ISPs capped internet usage at 5 GB per month.
Flodesk made unlimited email for a low price a reality. Affordable, attractive email marketing isn't just for big companies.
Flodesk doesn't penalize you for growing your list. Price stays the same as lists grow.
Flodesk plans cost $38 per month, but I'll give you a 30-day trial for $19.
Amazingly strong flows
Foster different people's flows.
Email marketing isn't one-size-fits-all.
Different times require different emails.
People don't open emails because they're irrelevant, in my experience. A colder audience needs a nurturing sequence.
Flodesk automates your email funnels so top-funnel prospects fall in love with your brand and values before mid- and bottom-funnel email flows nudge them to take action.
I wish I could save more custom audience fields to further customize the experience.
Dynamic editor
Easy. Effortless.
Flodesk's editor is Apple-like.
You understand how it works almost instantly.
Like many Apple products, it's intentionally limited. No distractions. You can focus on emotional email writing.

Flodesk's inability to add inline HTML to emails is my biggest issue with larger projects. I wish I could upload HTML emails.
Simple sign-up procedures
Dream up joining.
I like how easy it is to create conversion-focused landing pages. Linkly lets you easily create 5 landing pages and A/B test messaging.

I like that you can use signup forms to ask people what they're interested in so they get relevant emails instead of mindless mass emails nobody opens.

I love how easy it is to embed in-line on a website.
Wonderful designer templates
Beautiful, connecting emails.
Flodesk has calm email templates. My designer's eye felt at rest when I received plain text emails with big impacts.
As a typography nerd, I love Flodesk's handpicked designer fonts. It gives emails a designer feel that is hard to replicate on other platforms without coding and custom font licenses.
Small adjustments can have a big impact
Details matter.
Flodesk remembers your brand colors. Flodesk automatically adds your logo and social handles to emails after signup.
Flodesk uses Zapier. This lets you send emails based on a user's action.
A bad live chat can trigger a series of emails to win back a customer.
Flodesk isn't for everyone.
Flodesk is great for Apple users like me.

Vitalik
4 years ago
An approximate introduction to how zk-SNARKs are possible (part 2)
If tasked with the problem of coming up with a zk-SNARK protocol, many people would make their way to this point and then get stuck and give up. How can a verifier possibly check every single piece of the computation, without looking at each piece of the computation individually? But it turns out that there is a clever solution.
Polynomials
Polynomials are a special class of algebraic expressions of the form:
- x+5
- x^4
- x^3+3x^2+3x+1
- 628x^{271}+318x^{270}+530x^{269}+…+69x+381
i.e. they are a sum of any (finite!) number of terms of the form cx^k
There are many things that are fascinating about polynomials. But here we are going to zoom in on a particular one: polynomials are a single mathematical object that can contain an unbounded amount of information (think of them as a list of integers and this is obvious). The fourth example above contained 816 digits of tau, and one can easily imagine a polynomial that contains far more.
Furthermore, a single equation between polynomials can represent an unbounded number of equations between numbers. For example, consider the equation A(x)+ B(x) = C(x). If this equation is true, then it's also true that:
- A(0)+B(0)=C(0)
- A(1)+B(1)=C(1)
- A(2)+B(2)=C(2)
- A(3)+B(3)=C(3)
And so on for every possible coordinate. You can even construct polynomials to deliberately represent sets of numbers so you can check many equations all at once. For example, suppose that you wanted to check:
- 12+1=13
- 10+8=18
- 15+8=23
- 15+13=28
You can use a procedure called Lagrange interpolation to construct polynomials A(x) that give (12,10,15,15) as outputs at some specific set of coordinates (eg. (0,1,2,3)), B(x) the outputs (1,8,8,13) on thos same coordinates, and so forth. In fact, here are the polynomials:
- A(x)=-2x^3+\frac{19}{2}x^2-\frac{19}{2}x+12
- B(x)=2x^3-\frac{19}{2}x^2+\frac{29}{2}x+1
- C(x)=5x+13
Checking the equation A(x)+B(x)=C(x) with these polynomials checks all four above equations at the same time.
Comparing a polynomial to itself
You can even check relationships between a large number of adjacent evaluations of the same polynomial using a simple polynomial equation. This is slightly more advanced. Suppose that you want to check that, for a given polynomial F, F(x+2)=F(x)+F(x+1) with the integer range {0,1…89} (so if you also check F(0)=F(1)=1, then F(100) would be the 100th Fibonacci number)
As polynomials, F(x+2)-F(x+1)-F(x) would not be exactly zero, as it could give arbitrary answers outside the range x={0,1…98}. But we can do something clever. In general, there is a rule that if a polynomial P is zero across some set S=\{x_1,x_2…x_n\} then it can be expressed as P(x)=Z(x)*H(x), where Z(x)=(x-x_1)*(x-x_2)*…*(x-x_n) and H(x) is also a polynomial. In other words, any polynomial that equals zero across some set is a (polynomial) multiple of the simplest (lowest-degree) polynomial that equals zero across that same set.
Why is this the case? It is a nice corollary of polynomial long division: the factor theorem. We know that, when dividing P(x) by Z(x), we will get a quotient Q(x) and a remainder R(x) is strictly less than that of Z(x). Since we know that P is zero on all of S, it means that R has to be zero on all of S as well. So we can simply compute R(x) via polynomial interpolation, since it's a polynomial of degree at most n-1 and we know n values (the zeros at S). Interpolating a polynomial with all zeroes gives the zero polynomial, thus R(x)=0 and H(x)=Q(x).
Going back to our example, if we have a polynomial F that encodes Fibonacci numbers (so F(x+2)=F(x)+F(x+1) across x=\{0,1…98\}), then I can convince you that F actually satisfies this condition by proving that the polynomial P(x)=F(x+2)-F(x+1)-F(x) is zero over that range, by giving you the quotient:
H(x)=\frac{F(x+2)-F(x+1)-F(x)}{Z(x)}
Where Z(x) = (x-0)*(x-1)*…*(x-98).
You can calculate Z(x) yourself (ideally you would have it precomputed), check the equation, and if the check passes then F(x) satisfies the condition!
Now, step back and notice what we did here. We converted a 100-step-long computation into a single equation with polynomials. Of course, proving the N'th Fibonacci number is not an especially useful task, especially since Fibonacci numbers have a closed form. But you can use exactly the same basic technique, just with some extra polynomials and some more complicated equations, to encode arbitrary computations with an arbitrarily large number of steps.
see part 3