


The Jordan 6 Rings Reintroduce Classic Bulls
The Jordan 6 Rings return in Bulls colors, a deviation from previous releases. The signature red color is used on the midsole and heel, as well as the chenille patch and pull tab. The rest of the latter fixture is black, matching the outsole and adjacent Jumpman logos. Finally, white completes the look, from the leather mudguard to the lace unit. Here's a closer look at the Jordan 6 Rings. Sizes should be available soon on Nike.com and select retailers. Also, official photos of the Air Jordan 1 Denim have surfaced.
Jordan 6 Rings
Release Date: 2022
Color: N/A
Mens: $130
Style Code: 322992-126
More on Lifestyle

Sneaker News
3 years ago
This Month Will See The Release Of Travis Scott x Nike Footwear
Following the catastrophes at Astroworld, Travis Scott was swiftly vilified by both media outlets and fans alike, and the names who had previously supported him were quickly abandoned. Nike, on the other hand, remained silent, only delaying the release of La Flame's planned collaborations, such as the Air Max 1 and Air Trainer 1, indefinitely. While some may believe it is too soon for the artist to return to the spotlight, the Swoosh has other ideas, as Nice Kicks reveals that these exact sneakers will be released in May.
Both the Travis Scott x Nike Air Max 1 and the Travis Scott x Nike Air Trainer 1 are set to come in two colorways this month. Tinker Hatfield's renowned runner will meet La Flame's "Baroque Brown" and "Saturn Gold" make-ups, which have been altered with backwards Swooshes and outdoors-themed webbing. The high-top trainer is being customized with Hatfield's "Wheat" and "Grey Haze" palettes, both of which include zippers across the heel, co-branded patches, and other details.
See below for a closer look at the four footwear. TravisScott.com is expected to release the shoes on May 20th, according to Nice Kicks. Following that, on May 27th, Nike SNKRS will release the shoe.
Travis Scott x Nike Air Max 1 "Baroque Brown"
Release Date: 2022
Color: Baroque Brown/Lemon Drop/Wheat/Chile Red
Mens: $160
Style Code: DO9392-200
Pre-School: $85
Style Code: DN4169-200
Infant & Toddler: $70
Style Code: DN4170-200
Travis Scott x Nike Air Max 1 "Saturn Gold"
Release Date: 2022
Color: N/A
Mens: $160
Style Code: DO9392-700
Travis Scott x Nike Air Trainer 1 "Wheat"
Restock Date: May 27th, 2022 (Friday)
Original Release Date: May 20th, 2022 (Friday)
Color: N/A
Mens: $140
Style Code: DR7515-200
Travis Scott x Nike Air Trainer 1 "Grey Haze"
Restock Date: May 27th, 2022 (Friday)
Original Release Date: May 20th, 2022 (Friday)
Color: N/A
Mens: $140
Style Code: DR7515-001

Marcus Lu
3 years ago
The Brand Structure of U.S. Electric Vehicle Production
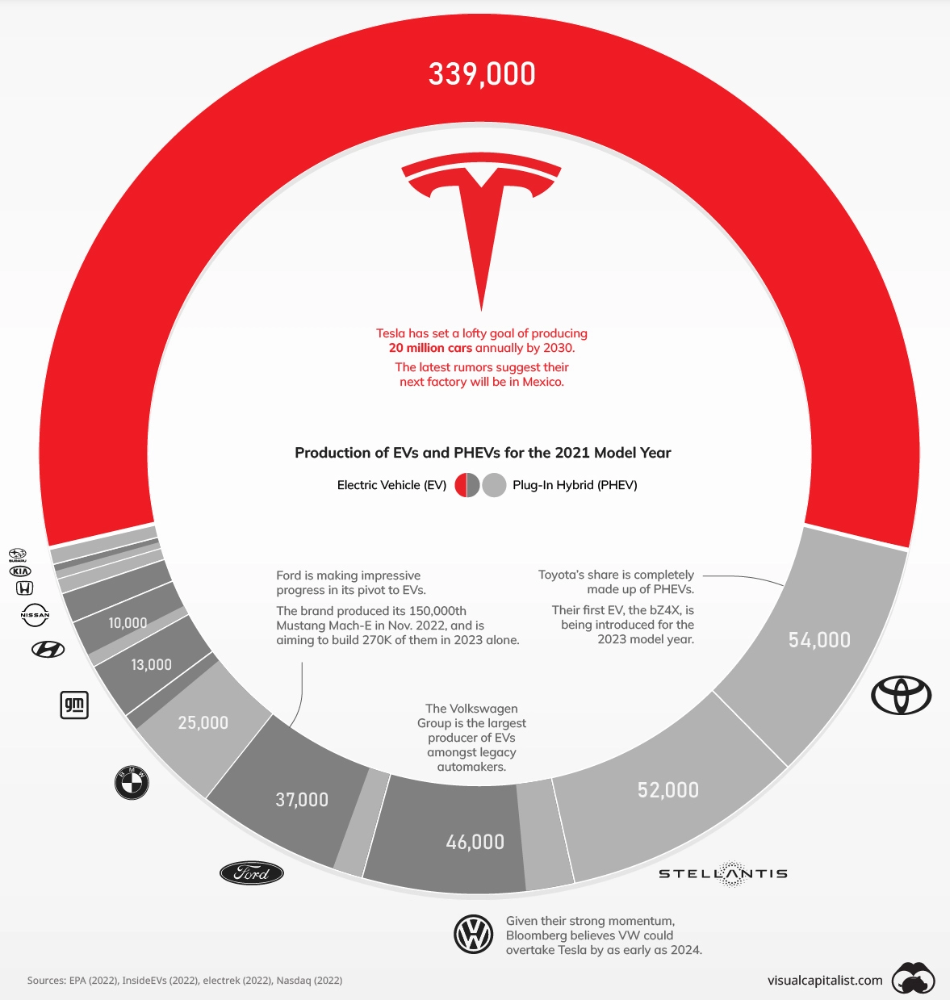
Will Tesla be able to maintain its lead in the EV market for very long?
This is one of the most pressing issues in the American auto sector today. One positive aspect of Tesla is the company's devoted customer base and recognizable name recognition (similar to Apple). It also invests more in research and development per vehicle than its rivals and has a head start in EV production.
Conversely, established automakers like Volkswagen are actively plotting their strategy to surpass Tesla. As the current market leaders, they have decades of experience in the auto industry and are spending billions to catch up.
We've visualized data from the EPA's 2022 Automotive Trends Report to bring you up to speed on this developing story.
Info for the Model Year of 2021
The full production data used in this infographic is for the 2021 model year, but it comes from a report for 2022.
Combined EV and PHEV output is shown in the table below (plug-in hybrid electric vehicle).
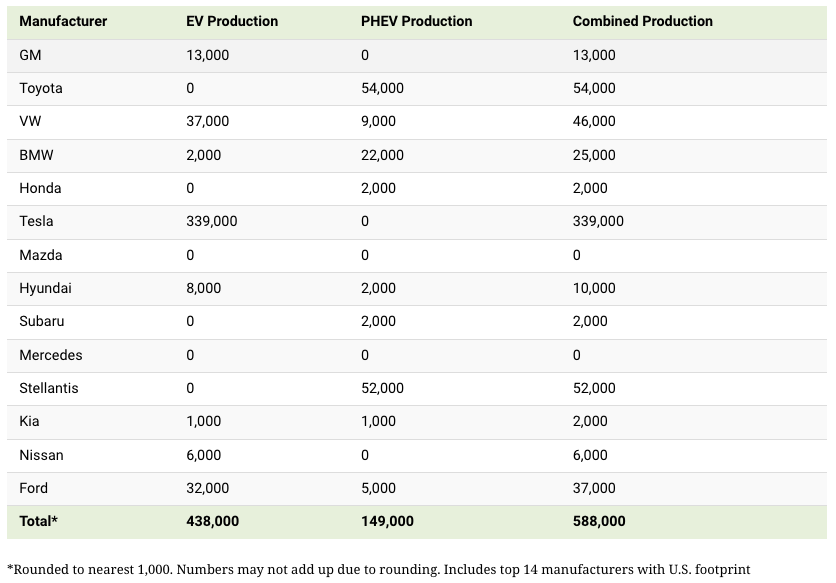
It is important to note that Toyota and Stellantis, the two largest legacy automakers in this dataset, only produced PHEVs. Toyota's first electric vehicle, the bZ4X, won't hit the market until 2023.
Stellantis seems to be falling even further behind, despite having enormous unrealized potential in its Jeep and Ram brands. Stellantis CEO Carlos Tavares said in a recent interview that the firm has budgeted $36 billion for electrification and software.
Legacy Brands with the Most Momentum
In the race to develop electric vehicles, some long-standing manufacturers have gotten the jump on their rivals.
Volkswagen, one of these storied manufacturers, has made a significant investment in electric vehicles (EVs) in the wake of the Dieselgate scandal. The company plans to roll out multiple EV models, including the ID.3 hatchback, ID.4 SUV, and ID. Buzz, with the goal of producing 22 million EVs by 2028. (an electric revival of the classic Microbus).
Even Ford is keeping up, having just announced an EV investment of $22 billion between 2021 and 2025. In November of 2022, the company manufactured their 150,000th Mustang Mach-E, and by the end of 2023, they hoped to have 270,000 of them in circulation.
Additionally, over 200,000 F-150 Lightnings have been reserved since Ford announced the truck. The Lightning is scheduled to have a production run of 15,000 in 2022, 55,000 in 2023, and 80,000 in 2024. Ford's main competitor in the electric pickup truck segment, Rivian, is on track to sell 25,000 vehicles by 2022.

Architectural Digest
3 years ago
Take a look at The One, a Los Angeles estate with a whopping 105,000 square feet of living area.
The interiors of the 105,000-square-foot property, which sits on a five-acre parcel in the wealthy Los Angeles suburb of Bel Air and is suitably titled The One, have been a well guarded secret. We got an intimate look inside this world-record-breaking property, as well as the creative and aesthetic geniuses behind it.
The estate appears to float above the city, surrounded on three sides by a moat and a 400-foot-long running track. Completed over eight years—and requiring 600 workers to build—the home was designed by architect Paul McClean and interior designer Kathryn Rotondi, who were enlisted by owner and developer Nile Niami to help it live up to its standard.
"This endeavor seemed both exhilarating and daunting," McClean says. However, the home's remarkable location and McClean's long-standing relationship with Niami persuaded him to "build something unique and extraordinary" rather than just take on the job.
And McClean has more than delivered.
The home's main entrance leads to a variety of meeting places with magnificent 360-degree views of the Pacific Ocean, downtown Los Angeles, and the San Gabriel Mountains, thanks to its 26-foot-high ceilings. There is water at the entrance area, as well as a sculpture and a bridge. "We often employ water in our design approach because it provides a sensory change that helps you acclimatize to your environment," McClean explains.
Niami wanted a neutral palette that would enable the environment and vistas to shine, so she used black, white, and gray throughout the house.
McClean has combined the home's inside with outside "to create that quintessential L.A. lifestyle but on a larger scale," he says, drawing influence from the local environment and history of Los Angeles modernism. "We separated the entertaining spaces from the living portions to make the house feel more livable. The former are on the lowest level, which serves as a plinth for the rest of the house and minimizes its apparent mass."
The home's statistics, in addition to its eye-catching style, are equally impressive. There are 42 bathrooms, 21 bedrooms, a 5,500-square-foot master suite, a 30-car garage gallery with two car-display turntables, a four-lane bowling alley, a spa level, a 30-seat movie theater, a "philanthropy wing (with a capacity of 200) for charity galas, a 10,000-square-foot sky deck, and five swimming pools.
Rotondi, the creator of KFR Design, collaborated with Niami on the interior design to create different spaces that flow into one another despite the house's grandeur. "I was especially driven to 'wow factor' components in the hospitality business," Rotondi says, citing top luxury hotel brands such as Aman, Bulgari, and Baccarat as sources of inspiration. Meanwhile, the home's color scheme, soft textures, and lighting are a nod to Niami and McClean's favorite Tom Ford boutique on Rodeo Drive.
The house boasts an extraordinary collection of art, including a butterfly work by Stephen Wilson on the lower level and a Niclas Castello bespoke panel in black and silver in the office, thanks to a cooperation between Creative Art Partners and Art Angels. There is also a sizable collection of bespoke furniture pieces from byShowroom.
A house of this size will never be erected again in Los Angeles, thanks to recently enacted city rules, so The One will truly be one of a kind. "For all of us, this project has been such a long and instructive trip," McClean says. "It was exciting to develop and approached with excitement, but I don't think any of us knew how much effort and time it would take to finish the project."
You might also like

Jon Brosio
3 years ago
You can learn more about marketing from these 8 copywriting frameworks than from a college education.
Email, landing pages, and digital content

Today's most significant skill:
Copywriting.
Unfortunately, most people don't know how to write successful copy because they weren't taught in school.
I've been obsessed with copywriting for two years. I've read 15 books, completed 3 courses, and studied internet's best digital entrepreneurs.
Here are 8 copywriting frameworks that educate more than a four-year degree.
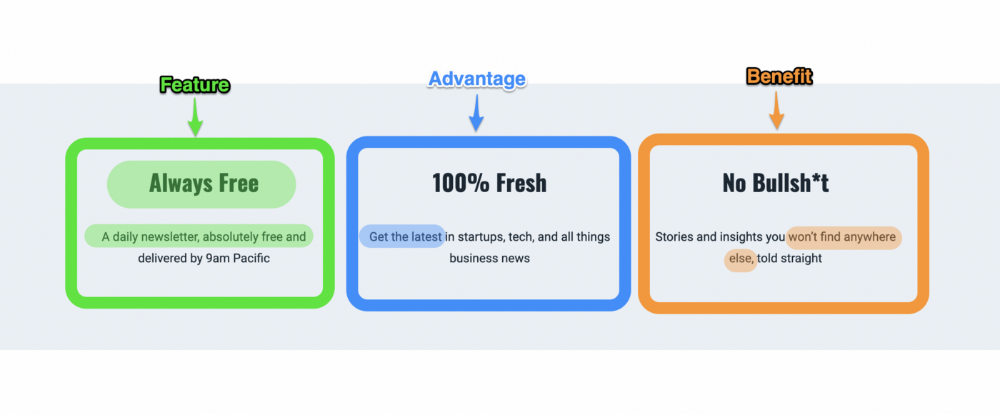
1. Feature — Advantage — Benefit (F.A.B)
This is the most basic copywriting foundation. Email marketing, landing page copy, and digital video ads can use it.
F.A.B says:
How it works (feature)
which is helpful (advantage)
What's at stake (benefit)
The Hustle uses this framework on their landing page to convince people to sign up:
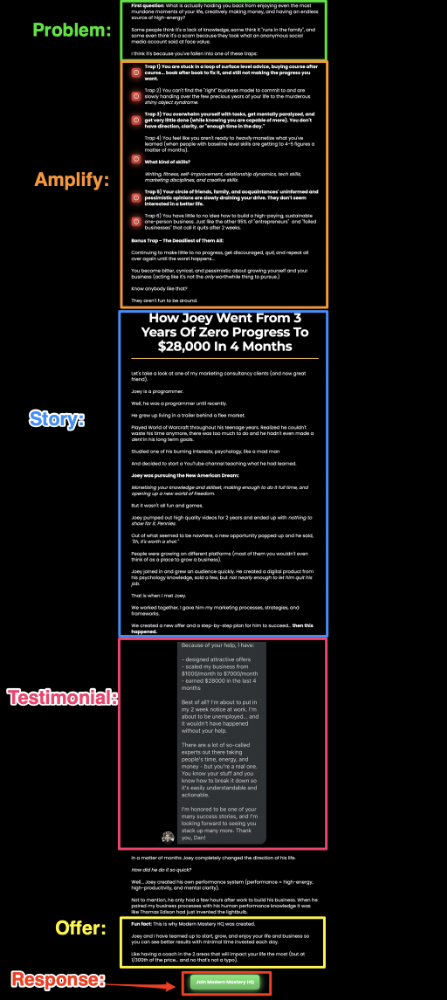
2. P. A. S. T. O. R.
This framework is for longer-form copywriting. PASTOR uses stories to engage with prospects. It explains why people should buy this offer.
PASTOR means:
Problem
Amplify
Story
Testimonial
Offer
Response
Dan Koe's landing page is a great example. It shows PASTOR frame-by-frame.
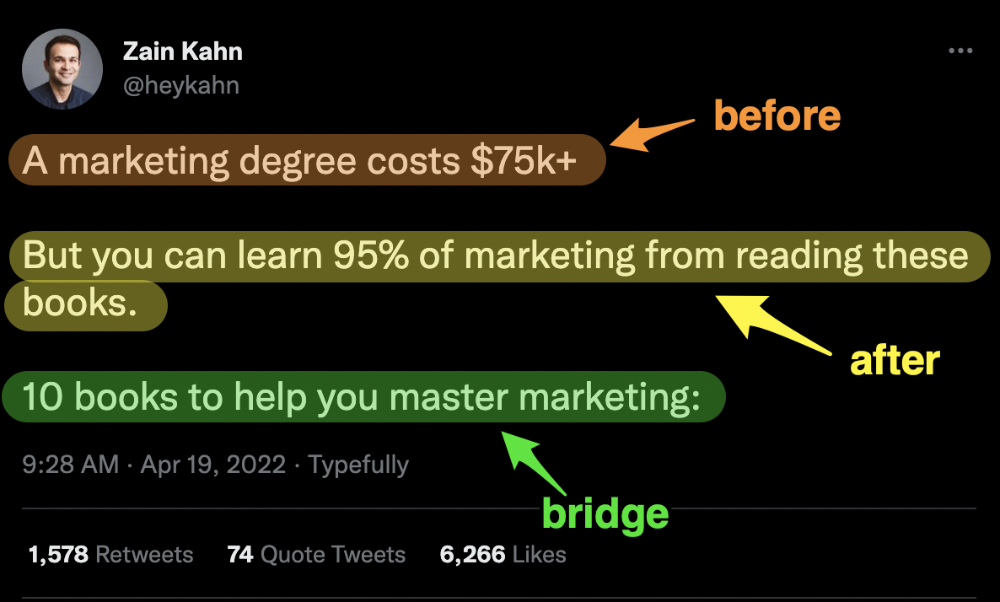
3. Before — After — Bridge
Before-after-bridge is a copywriting framework that draws attention and shows value quickly.
This framework highlights:
where you are
where you want to be
how to get there
Works great for: Email threads/landing pages
Zain Kahn utilizes this framework to write viral threads.
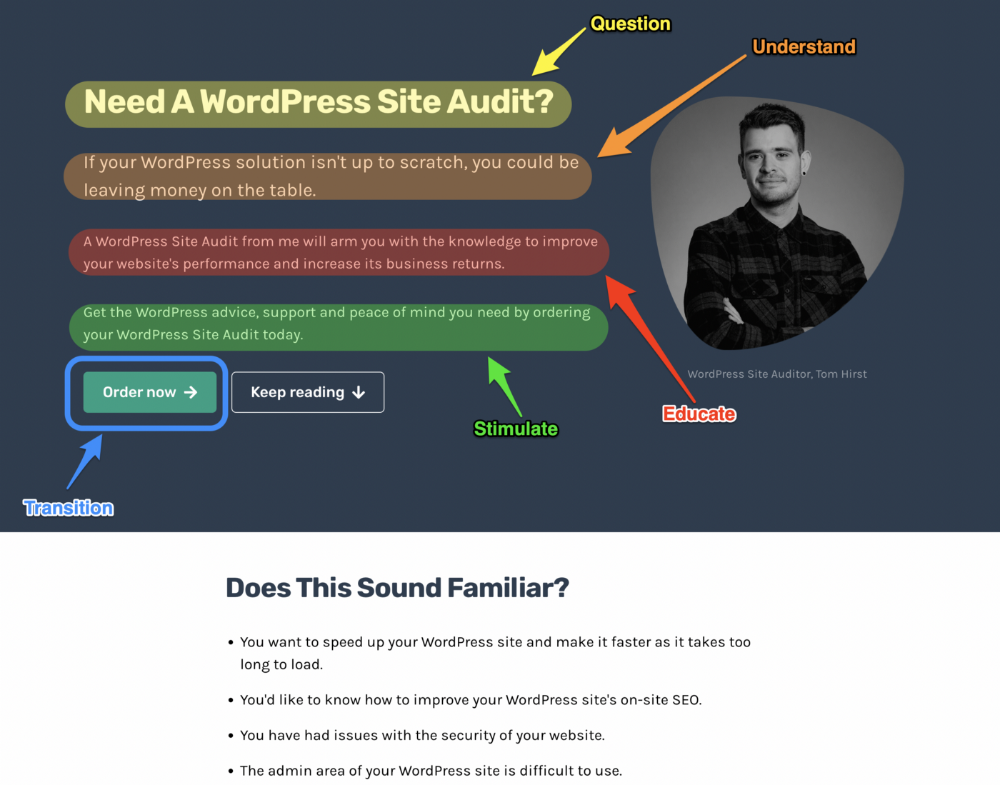
4. Q.U.E.S.T
QUEST is about empathetic writing. You know their issues, obstacles, and headaches. This allows coverups.
QUEST:
Qualifies
Understands
Educates
Stimulates
Transitions
Tom Hirst's landing page uses the QUEST framework.
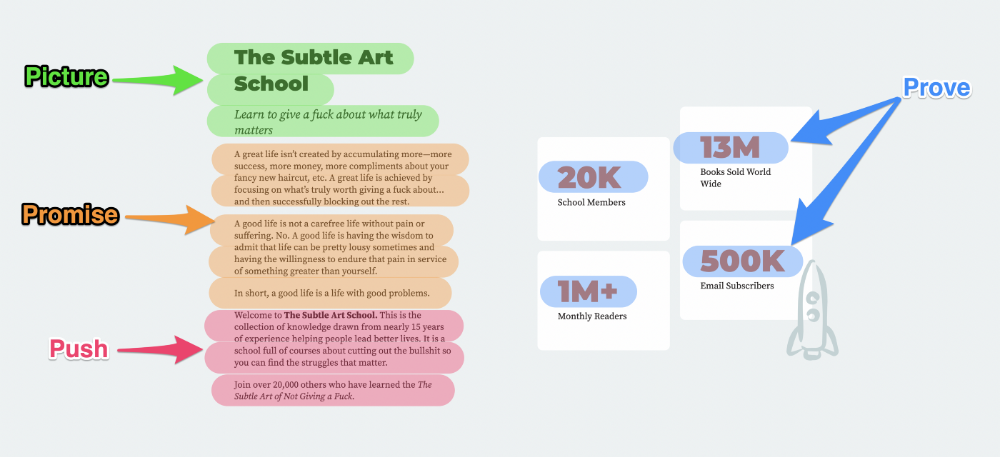
5. The 4P’s model
The 4P’s approach pushes your prospect to action. It educates and persuades quickly.
4Ps:
The problem the visitor is dealing with
The promise that will help them
The proof the promise works
A push towards action
Mark Manson is a bestselling author, digital creator, and pop-philosopher. He's also a great copywriter, and his membership offer uses the 4P’s framework.
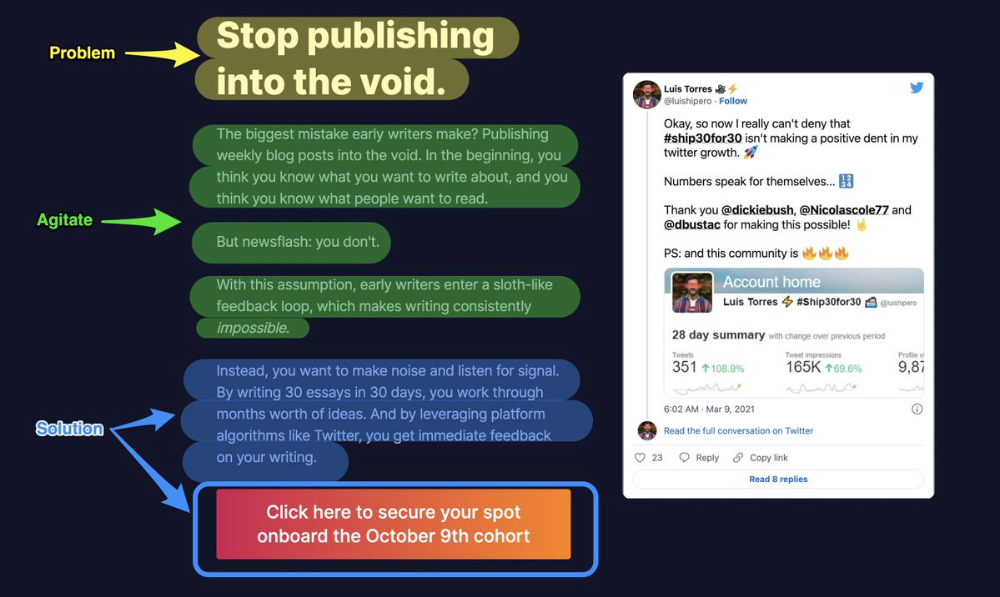
6. Problem — Agitate — Solution (P.A.S)
Up-and-coming marketers should understand problem-agitate-solution copywriting. Once you understand one structure, others are easier. It drives passion and presents a clear solution.
PAS outlines:
The issue the visitor is having
It then intensifies this issue through emotion.
finally offers an answer to that issue (the offer)
The customer's story loops. Nicolas Cole and Dickie Bush use PAS to promote Ship 30 for 30.
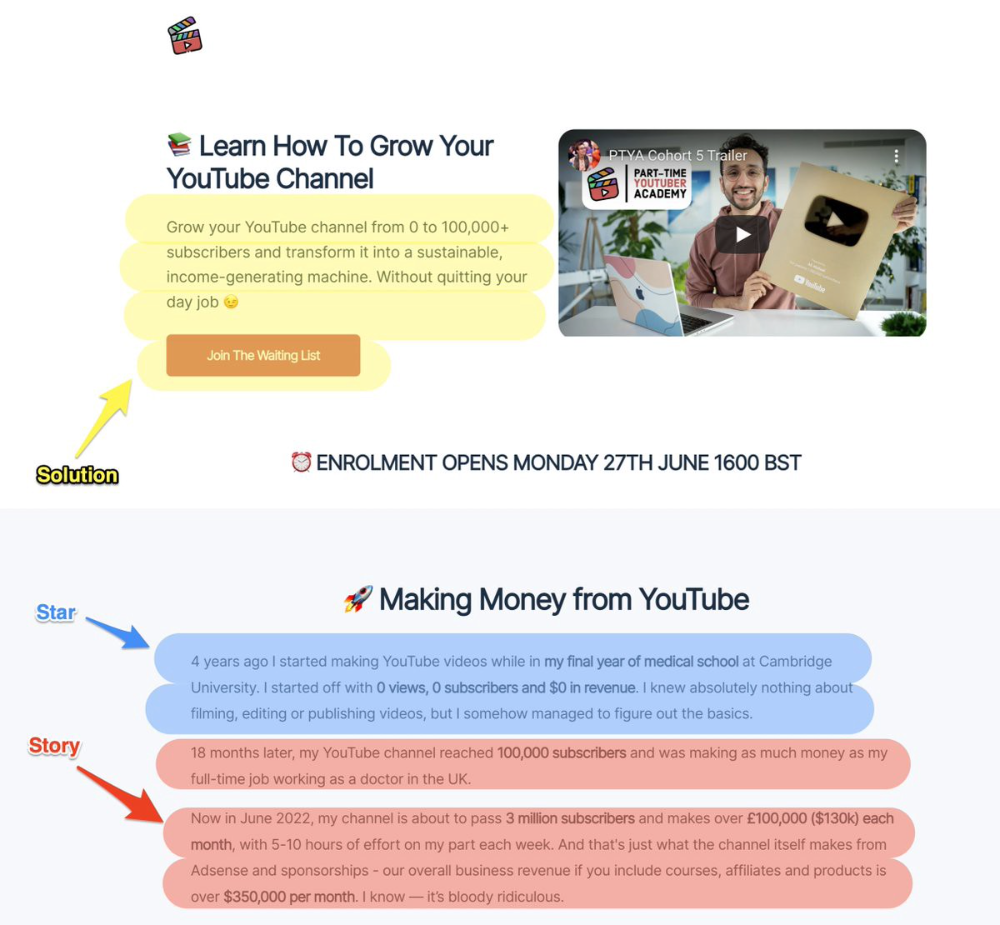
7. Star — Story — Solution (S.S.S)
PASTOR + PAS = star-solution-story. Like PAS, it employs stories to persuade.
S.S.S. is effective storytelling:
Star: (Person had a problem)
Story: (until they had a breakthrough)
Solution: (That created a transformation)
Ali Abdaal is a YouTuber with a great S.S.S copy.
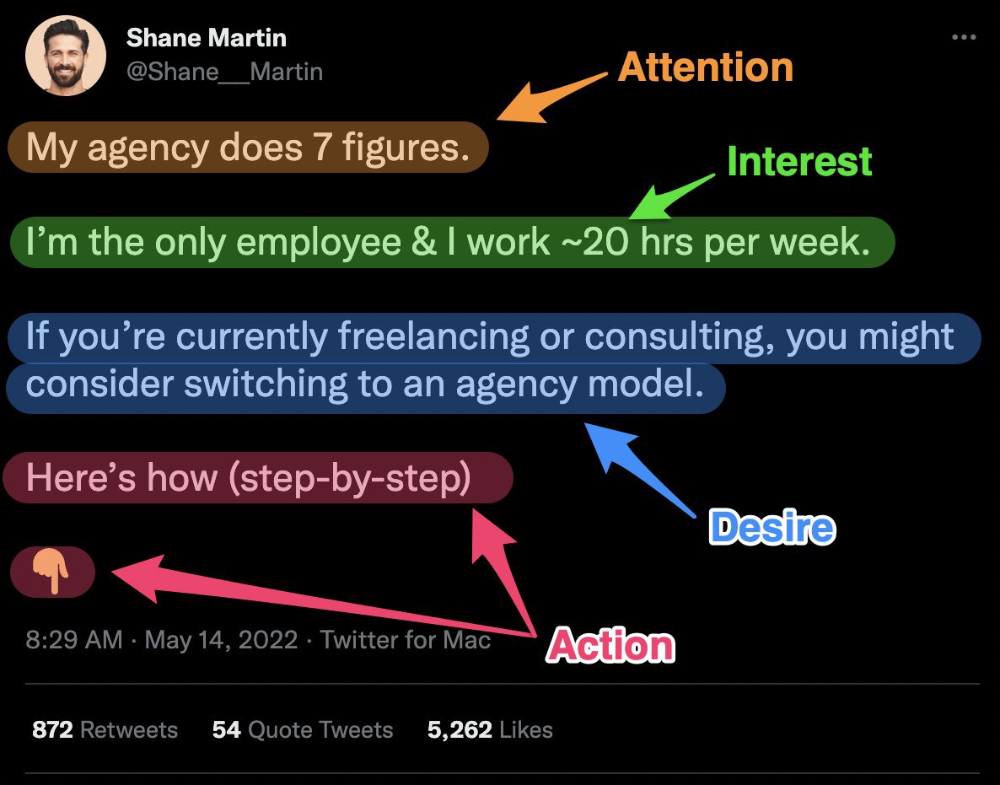
8. Attention — Interest — Desire — Action
AIDA is another classic. This copywriting framework is great for fast-paced environments (think all digital content on Linkedin, Twitter, Medium, etc.).
It works with:
Page landings
writing on thread
Email
It's a good structure since it's concise, attention-grabbing, and action-oriented.
Shane Martin, Twitter's creator, uses this approach to create viral content.
TL;DR
8 copywriting frameworks that teach marketing better than a four-year degree
Feature-advantage-benefit
Before-after-bridge
Star-story-solution
P.A.S.T.O.R
Q.U.E.S.T
A.I.D.A
P.A.S
4P’s

Chris Newman
3 years ago
Clean Food: Get Over Yourself If You Want to Save the World.

I’m a permaculture farmer. I want to create food-producing ecosystems. My hope is a world with easy access to a cuisine that nourishes consumers, supports producers, and leaves the Earth joyously habitable.
Permaculturists, natural farmers, plantsmen, and foodies share this ambition. I believe this group of green thumbs, stock-folk, and food champions is falling to tribalism, forgetting that rescuing the globe requires saving all of its inhabitants, even those who adore cheap burgers and Coke. We're digging foxholes and turning folks who disagree with us or don't understand into monsters.
Take Dr. Daphne Miller's comments at the end of her Slow Money Journal interview:
“Americans are going to fall into two camps when all is said and done: People who buy cheap goods, regardless of quality, versus people who are willing and able to pay for things that are made with integrity. We are seeing the limits of the “buying cheap crap” approach.”
This is one of the most judgmental things I've read outside the Bible. Consequences:
People who purchase inexpensive things (food) are ignorant buffoons who prefer to choose fair trade coffee over fuel as long as the price is correct.
It all depends on your WILL to buy quality or cheaply. Both those who are WILLING and those who ARE NOT exist. And able, too.
People who are unwilling and unable are purchasing garbage. You're giving your kids bad food. Both the Earth and you are being destroyed by your actions. Your camp is the wrong one. You’re garbage! Disgrace to you.
Dr. Miller didn't say it, but words are worthless until interpreted. This interpretation depends on the interpreter's economic, racial, political, religious, family, and personal history. Complementary language insults another. Imagine how that Brown/Harvard M.D.'s comment sounds to a low-income household with no savings.
Dr. Miller's comment reflects the echo chamber into which nearly all clean food advocates speak. It asks easy questions and accepts non-solutions like raising food prices and eating less meat. People like me have cultivated an insular world unencumbered by challenges beyond the margins. We may disagree about technical details in rotationally-grazing livestock, but we short circuit when asked how our system could supply half the global beef demand. Most people have never seriously considered this question. We're so loved and affirmed that challenging ourselves doesn't seem necessary. Were generals insisting we don't need to study the terrain because God is on our side?
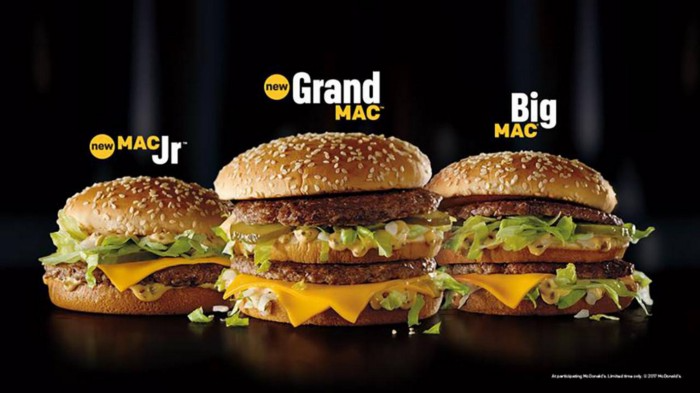
“Yes, the $8/lb ground beef is produced the way it should be. Yes, it’s good for my body. Yes it’s good for the Earth. But it’s eight freaking dollars, and my kid needs braces and protein. Bye Felicia, we’re going to McDonald’s.”
-Bobby Q. Homemaker
Funny clean foodies. People don't pay enough for food; they should value it more. Turn the concept of buying food with integrity into a wedge and drive it into the heart of America, dividing the willing and unwilling.
We go apeshit if you call our products high-end.
I've heard all sorts of gaslighting to defend a $10/lb pork chop as accessible (things I’ve definitely said in the past):
At Whole Foods, it costs more.
The steak at the supermarket is overly affordable.
Pay me immediately or the doctor gets paid later.
I spoke with Timbercreek Market and Local Food Hub in front of 60 people. We were asked about local food availability.
They came to me last, after my co-panelists gave the same responses I would have given two years before.
I grumbled, "Our food is inaccessible." Nope. It's beyond the wallets of nearly everyone, and it's the biggest problem with sustainable food systems. We're criminally unserious about being leaders in sustainability until we propose solutions beyond economic relativism, wishful thinking, and insisting that vulnerable, distracted people do all the heavy lifting of finding a way to afford our food. And until we talk about solutions, all this preserve the world? False.
The room fell silent as if I'd revealed a terrible secret. Long, thunderous applause followed my other remarks. But I’m probably not getting invited back to any VNRLI events.
I make pricey cuisine. It’s high-end. I have customers who really have to stretch to get it, and they let me know it. They're forgoing other creature comforts to help me make a living and keep the Earth of my grandmothers alive, and they're doing it as an act of love. They believe in us and our work.
I remember it when I'm up to my shoulders in frigid water, when my vehicle stinks of four types of shit, when I come home covered in blood and mud, when I'm hauling water in 100-degree heat, when I'm herding pigs in a rainstorm and dodging lightning bolts to close the chickens. I'm reminded I'm not alone. Their enthusiasm is worth more than money; it helps me make a life and a living. I won't label that gift less than it is to make my meal seem more accessible.
Not everyone can sacrifice.
Let's not pretend we want to go back to peasant fare, despite our nostalgia. Industrial food has leveled what rich and poor eat. How food is cooked will be the largest difference between what you and a billionaire eat. Rich and poor have access to chicken, pork, and beef. You might be shocked how recently that wasn't the case. This abundance, particularly of animal protein, has helped vulnerable individuals.

Industrial food causes environmental damage, chronic disease, and distribution inequities. Clean food promotes non-industrial, artisan farming. This creates a higher-quality, more expensive product than the competition; we respond with aggressive marketing and the "people need to value food more" shtick geared at consumers who can spend the extra money.
The guy who is NOT able is rendered invisible by clean food's elitist marketing, which is bizarre given a.) clean food insists it's trying to save the world, yet b.) MOST PEOPLE IN THE WORLD ARE THAT GUY. No one can help him except feel-good charities. That's crazy.
Also wrong: a foodie telling a kid he can't eat a 99-cent fast food hamburger because it lacks integrity. Telling him how easy it is to save his ducketts and maybe have a grass-fed house burger at the end of the month as a reward, but in the meantime get your protein from canned beans you can't bake because you don't have a stove and, even if you did, your mom works two jobs and moonlights as an Uber driver so she doesn't have time to heat that shitup anyway.
A wealthy person's attitude toward the poor is indecent. It's 18th-century Versailles.

Human rights include access to nutritious food without social or environmental costs. As a food-forest-loving permaculture farmer, I no longer balk at the concept of cultured beef and hydroponics. My food is out of reach for many people, but access to decent food shouldn't be. Cultures and hydroponics could scale to meet the clean food affordability gap without externalities. If technology can deliver great, affordable beef without environmental negative effects, I can't reject it because it's new, unusual, or might endanger my business.
Why is your farm needed if cultured beef and hydroponics can feed the world? Permaculture food forests with trees, perennial plants, and animals are crucial to economically successful environmental protection. No matter how advanced technology gets, we still need clean air, water, soil, greenspace, and food.
Clean Food cultivated in/on live soil, minimally processed, and eaten close to harvest is part of the answer, not THE solution. Clean food advocates must recognize the conflicts at the intersection of environmental, social, and economic sustainability, the disproportionate effects of those conflicts on the poor and lower-middle classes, and the immorality and impracticality of insisting vulnerable people address those conflicts on their own and judging them if they don't.
Our clients, relatives, friends, and communities need an honest assessment of our role in a sustainable future. If we're serious about preserving the world, we owe honesty to non-customers. We owe our goal and sanity to honesty. Future health and happiness of the world left to the average person's pocketbook and long-term moral considerations is a dismal proposition with few parallels.
Let's make soil and grow food. Let the lab folks do their thing. We're all interdependent.

Sam Bourgi
3 years ago
DAOs are legal entities in Marshall Islands.
The Pacific island state recognizes decentralized autonomous organizations.
The Republic of the Marshall Islands has recognized decentralized autonomous organizations (DAOs) as legal entities, giving collectively owned and managed blockchain projects global recognition.
The Marshall Islands' amended the Non-Profit Entities Act 2021 that now recognizes DAOs, which are blockchain-based entities governed by self-organizing communities. Incorporating Admiralty LLC, the island country's first DAO, was made possible thanks to the amendement. MIDAO Directory Services Inc., a domestic organization established to assist DAOs in the Marshall Islands, assisted in the incorporation.
The new law currently allows any DAO to register and operate in the Marshall Islands.
“This is a unique moment to lead,” said Bobby Muller, former Marshall Islands chief secretary and co-founder of MIDAO. He believes DAOs will help create “more efficient and less hierarchical” organizations.
A global hub for DAOs, the Marshall Islands hopes to become a global hub for DAO registration, domicile, use cases, and mass adoption. He added:
"This includes low-cost incorporation, a supportive government with internationally recognized courts, and a technologically open environment."
According to the World Bank, the Marshall Islands is an independent island state in the Pacific Ocean near the Equator. To create a blockchain-based cryptocurrency that would be legal tender alongside the US dollar, the island state has been actively exploring use cases for digital assets since at least 2018.
In February 2018, the Marshall Islands approved the creation of a new cryptocurrency, Sovereign (SOV). As expected, the IMF has criticized the plan, citing concerns that a digital sovereign currency would jeopardize the state's financial stability. They have also criticized El Salvador, the first country to recognize Bitcoin (BTC) as legal tender.
Marshall Islands senator David Paul said the DAO legislation does not pose the same issues as a government-backed cryptocurrency. “A sovereign digital currency is financial and raises concerns about money laundering,” . This is more about giving DAOs legal recognition to make their case to regulators, investors, and consumers.