


Day Trading Introduction
Historically, only large financial institutions, brokerages, and trading houses could actively trade in the stock market. With instant global news dissemination and low commissions, developments such as discount brokerages and online trading have leveled the playing—or should we say trading—field. It's never been easier for retail investors to trade like pros thanks to trading platforms like Robinhood and zero commissions.
Day trading is a lucrative career (as long as you do it properly). But it can be difficult for newbies, especially if they aren't fully prepared with a strategy. Even the most experienced day traders can lose money.
So, how does day trading work?
Day Trading Basics
Day trading is the practice of buying and selling a security on the same trading day. It occurs in all markets, but is most common in forex and stock markets. Day traders are typically well educated and well funded. For small price movements in highly liquid stocks or currencies, they use leverage and short-term trading strategies.
Day traders are tuned into short-term market events. News trading is a popular strategy. Scheduled announcements like economic data, corporate earnings, or interest rates are influenced by market psychology. Markets react when expectations are not met or exceeded, usually with large moves, which can help day traders.
Intraday trading strategies abound. Among these are:
- Scalping: This strategy seeks to profit from minor price changes throughout the day.
- Range trading: To determine buy and sell levels, range traders use support and resistance levels.
- News-based trading exploits the increased volatility around news events.
- High-frequency trading (HFT): The use of sophisticated algorithms to exploit small or short-term market inefficiencies.
A Disputed Practice
Day trading's profit potential is often debated on Wall Street. Scammers have enticed novices by promising huge returns in a short time. Sadly, the notion that trading is a get-rich-quick scheme persists. Some daytrade without knowledge. But some day traders succeed despite—or perhaps because of—the risks.
Day trading is frowned upon by many professional money managers. They claim that the reward rarely outweighs the risk. Those who day trade, however, claim there are profits to be made. Profitable day trading is possible, but it is risky and requires considerable skill. Moreover, economists and financial professionals agree that active trading strategies tend to underperform passive index strategies over time, especially when fees and taxes are factored in.
Day trading is not for everyone and is risky. It also requires a thorough understanding of how markets work and various short-term profit strategies. Though day traders' success stories often get a lot of media attention, keep in mind that most day traders are not wealthy: Many will fail, while others will barely survive. Also, while skill is important, bad luck can sink even the most experienced day trader.
Characteristics of a Day Trader
Experts in the field are typically well-established professional day traders.
They usually have extensive market knowledge. Here are some prerequisites for successful day trading.
Market knowledge and experience
Those who try to day-trade without understanding market fundamentals frequently lose. Day traders should be able to perform technical analysis and read charts. Charts can be misleading if not fully understood. Do your homework and know the ins and outs of the products you trade.
Enough capital
Day traders only use risk capital they can lose. This not only saves them money but also helps them trade without emotion. To profit from intraday price movements, a lot of capital is often required. Most day traders use high levels of leverage in margin accounts, and volatile market swings can trigger large margin calls on short notice.
Strategy
A trader needs a competitive advantage. Swing trading, arbitrage, and trading news are all common day trading strategies. They tweak these strategies until they consistently profit and limit losses.
Strategy Breakdown:
Type | Risk | Reward
Swing Trading | High | High
Arbitrage | Low | Medium
Trading News | Medium | Medium
Mergers/Acquisitions | Medium | High
Discipline
A profitable strategy is useless without discipline. Many day traders lose money because they don't meet their own criteria. “Plan the trade and trade the plan,” they say. Success requires discipline.
Day traders profit from market volatility. For a day trader, a stock's daily movement is appealing. This could be due to an earnings report, investor sentiment, or even general economic or company news.
Day traders also prefer highly liquid stocks because they can change positions without affecting the stock's price. Traders may buy a stock if the price rises. If the price falls, a trader may decide to sell short to profit.
A day trader wants to trade a stock that moves (a lot).
Day Trading for a Living
Professional day traders can be self-employed or employed by a larger institution.
Most day traders work for large firms like hedge funds and banks' proprietary trading desks. These traders benefit from direct counterparty lines, a trading desk, large capital and leverage, and expensive analytical software (among other advantages). By taking advantage of arbitrage and news events, these traders can profit from less risky day trades before individual traders react.
Individual traders often manage other people’s money or simply trade with their own. They rarely have access to a trading desk, but they frequently have strong ties to a brokerage (due to high commissions) and other resources. However, their limited scope prevents them from directly competing with institutional day traders. Not to mention more risks. Individuals typically day trade highly liquid stocks using technical analysis and swing trades, with some leverage.
Day trading necessitates access to some of the most complex financial products and services. Day traders usually need:
Access to a trading desk
Traders who work for large institutions or manage large sums of money usually use this. The trading or dealing desk provides these traders with immediate order execution, which is critical during volatile market conditions. For example, when an acquisition is announced, day traders interested in merger arbitrage can place orders before the rest of the market.
News sources
The majority of day trading opportunities come from news, so being the first to know when something significant happens is critical. It has access to multiple leading newswires, constant news coverage, and software that continuously analyzes news sources for important stories.
Analytical tools
Most day traders rely on expensive trading software. Technical traders and swing traders rely on software more than news. This software's features include:
-
Automatic pattern recognition: It can identify technical indicators like flags and channels, or more complex indicators like Elliott Wave patterns.
-
Genetic and neural applications: These programs use neural networks and genetic algorithms to improve trading systems and make more accurate price predictions.
-
Broker integration: Some of these apps even connect directly to the brokerage, allowing for instant and even automatic trade execution. This reduces trading emotion and improves execution times.
-
Backtesting: This allows traders to look at past performance of a strategy to predict future performance. Remember that past results do not always predict future results.
Together, these tools give traders a competitive advantage. It's easy to see why inexperienced traders lose money without them. A day trader's earnings potential is also affected by the market in which they trade, their capital, and their time commitment.
Day Trading Risks
Day trading can be intimidating for the average investor due to the numerous risks involved. The SEC highlights the following risks of day trading:
Because day traders typically lose money in their first months of trading and many never make profits, they should only risk money they can afford to lose.
Trading is a full-time job that is stressful and costly: Observing dozens of ticker quotes and price fluctuations to spot market trends requires intense concentration. Day traders also spend a lot on commissions, training, and computers.
Day traders heavily rely on borrowing: Day-trading strategies rely on borrowed funds to make profits, which is why many day traders lose everything and end up in debt.
Avoid easy profit promises: Avoid “hot tips” and “expert advice” from day trading newsletters and websites, and be wary of day trading educational seminars and classes.
Should You Day Trade?
As stated previously, day trading as a career can be difficult and demanding.
- First, you must be familiar with the trading world and know your risk tolerance, capital, and goals.
- Day trading also takes a lot of time. You'll need to put in a lot of time if you want to perfect your strategies and make money. Part-time or whenever isn't going to cut it. You must be fully committed.
- If you decide trading is for you, remember to start small. Concentrate on a few stocks rather than jumping into the market blindly. Enlarging your trading strategy can result in big losses.
- Finally, keep your cool and avoid trading emotionally. The more you can do that, the better. Keeping a level head allows you to stay focused and on track.
If you follow these simple rules, you may be on your way to a successful day trading career.
Is Day Trading Illegal?
Day trading is not illegal or unethical, but it is risky. Because most day-trading strategies use margin accounts, day traders risk losing more than they invest and becoming heavily in debt.
How Can Arbitrage Be Used in Day Trading?
Arbitrage is the simultaneous purchase and sale of a security in multiple markets to profit from small price differences. Because arbitrage ensures that any deviation in an asset's price from its fair value is quickly corrected, arbitrage opportunities are rare.
Why Don’t Day Traders Hold Positions Overnight?
Day traders rarely hold overnight positions for several reasons: Overnight trades require more capital because most brokers require higher margin; stocks can gap up or down on overnight news, causing big trading losses; and holding a losing position overnight in the hope of recovering some or all of the losses may be against the trader's core day-trading philosophy.
What Are Day Trader Margin Requirements?
Regulation D requires that a pattern day trader client of a broker-dealer maintain at all times $25,000 in equity in their account.
How Much Buying Power Does Day Trading Have?
Buying power is the total amount of funds an investor has available to trade securities. FINRA rules allow a pattern day trader to trade up to four times their maintenance margin excess as of the previous day's close.
The Verdict
Although controversial, day trading can be a profitable strategy. Day traders, both institutional and retail, keep the markets efficient and liquid. Though day trading is still popular among novice traders, it should be left to those with the necessary skills and resources.
More on Economics & Investing

Tanya Aggarwal
3 years ago
What I learned from my experience as a recent graduate working in venture capital

Every week I meet many people interested in VC. Many of them ask me what it's like to be a junior analyst in VC or what I've learned so far.
Looking back, I've learned many things as a junior VC, having gone through an almost-euphoric peak bull market, failed tech IPOs of 2019 including WeWorks' catastrophic fall, and the beginnings of a bearish market.
1. Network, network, network!
VCs spend 80% of their time networking. Junior VCs source deals or manage portfolios. You spend your time bringing startups to your fund or helping existing portfolio companies grow. Knowing stakeholders (corporations, star talent, investors) in your particular areas of investment helps you develop your portfolio.
Networking was one of my strengths. When I first started in the industry, I'd go to startup events and meet 50 people a month. Over time, I realized these relationships were shallow and I was only getting business cards. So I stopped seeing networking as a transaction. VC is a long-term game, so you should work with people you like. Now I know who I click with and can build deeper relationships with them. My network is smaller but more valuable than before.
2. The Most Important Metric Is Founder
People often ask how we pick investments. Why some companies can raise money and others can't is a mystery. The founder is the most important metric for VCs. When a company is young, the product, environment, and team all change, but the founder remains constant. VCs bet on the founder, not the company.
How do we decide which founders are best after 2-3 calls? When looking at a founder's profile, ask why this person can solve this problem. The founders' track record will tell. If the founder is a serial entrepreneur, you know he/she possesses the entrepreneur DNA and will likely succeed again. If it's his/her first startup, focus on industry knowledge to deliver the best solution.
3. A company's fate can be determined by macrotrends.
Macro trends are crucial. A company can have the perfect product, founder, and team, but if it's solving the wrong problem, it won't succeed. I've also seen average companies ride the wave to success. When you're on the right side of a trend, there's so much demand that more companies can get a piece of the pie.
In COVID-19, macro trends made or broke a company. Ed-tech and health-tech companies gained unicorn status and raised funding at inflated valuations due to sudden demand. With the easing of pandemic restrictions and the start of a bear market, many of these companies' valuations are in question.
4. Look for methods to ACTUALLY add value.
You only need to go on VC twitter (read: @vcstartterkit and @vcbrags) for 5 minutes or look at fin-meme accounts on Instagram to see how much VCs claim to add value but how little they actually do. VC is a long-term game, though. Long-term, founders won't work with you if you don't add value.
How can we add value when we're young and have no network? Leaning on my strengths helped me. Instead of viewing my age and limited experience as a disadvantage, I realized that I brought a unique perspective to the table.
As a VC, you invest in companies that will be big in 5-7 years, and millennials and Gen Z will have the most purchasing power. Because you can relate to that market, you can offer insights that most Partners at 40 can't. I added value by helping with hiring because I had direct access to university talent pools and by finding university students for product beta testing.
5. Develop your personal brand.
Generalists or specialists run most funds. This means that funds either invest across industries or have a specific mandate. Most funds are becoming specialists, I've noticed. Top-tier founders don't lack capital, so funds must find other ways to attract them. Why would a founder work with a generalist fund when a specialist can offer better industry connections and partnership opportunities?
Same for fund members. Founders want quality investors. Become a thought leader in your industry to meet founders. Create content and share your thoughts on industry-related social media. When I first started building my brand, I found it helpful to interview industry veterans to create better content than I could on my own. Over time, my content attracted quality founders so I didn't have to look for them.
These are my biggest VC lessons. This list isn't exhaustive, but it's my industry survival guide.

Cory Doctorow
3 years ago
The current inflation is unique.
New Stiglitz just dropped.
Here's the inflation story everyone believes (warning: it's false): America gave the poor too much money during the recession, and now the economy is awash with free money, which made them so rich they're refusing to work, meaning the economy isn't making anything. Prices are soaring due to increased cash and missing labor.
Lawrence Summers says there's only one answer. We must impoverish the poor: raise interest rates, cause a recession, and eliminate millions of jobs, until the poor are stripped of their underserved fortunes and return to work.
https://pluralistic.net/2021/11/20/quiet-part-out-loud/#profiteering
This is nonsense. Countries around the world suffered inflation during and after lockdowns, whether they gave out humanitarian money to keep people from starvation. America has slightly greater inflation than other OECD countries, but it's not due to big relief packages.
The Causes of and Responses to Today's Inflation, a Roosevelt Institute report by Nobel-winning economist Joseph Stiglitz and macroeconomist Regmi Ira, debunks this bogus inflation story and offers a more credible explanation for inflation.
https://rooseveltinstitute.org/wp-content/uploads/2022/12/RI CausesofandResponsestoTodaysInflation Report 202212.pdf
Sharp interest rate hikes exacerbate the slump and increase inflation, the authors argue. They compare monetary policy inflation cures to medieval bloodletting, where doctors repeated the same treatment until the patient recovered (for which they received credit) or died (which was more likely).
Let's discuss bloodletting. Inflation hawks warn of the wage price spiral, when inflation rises and powerful workers bargain for higher pay, driving up expenses, prices, and wages. This is the fairy-tale narrative of the 1970s, and it's true except that OPEC's embargo drove up oil prices, which produced inflation. Oh well.
Let's be generous to seventies-haunted inflation hawks and say we're worried about a wage-price spiral. Fantastic! No. Real wages are 2.3% lower than they were in Oct 2021 after peaking in June at 4.8%.
Why did America's powerful workers take a paycut rather than demand inflation-based pay? Weak unions, globalization, economic developments.
Workers don't expect inflation to rise, so they're not requesting inflationary hikes. Inflationary expectations have remained moderate, consistent with our data interpretation.
https://www.newyorkfed.org/microeconomics/sce#/
Neither are workers. Working people see surplus savings as wealth and spend it gradually over their lives, despite rising demand. People may have saved money by staying in during the lockdown, but they don't eat out every night to make up for it. Instead, they keep those savings as precautionary balances. This is why the economy is lagging.
People don't buy non-traded goods with pandemic savings (basically, imports). Imports don't multiply like domestic purchases. If you buy a loaf of bread from the corner baker for $1 and they spend it at the tavern across the street, that dollar generates $3 in economic activity. Spending a dollar on foreign goods leaves the country and any multiplier effect happens there, not in the US.
Only marginally higher wages. The ECI is up 1.6% from 2019. Almost all gains went to the 25% lowest-paid Americans. Contrary to the inflation worry about too much savings, these workers don't make enough to save, even post-pandemic.
Recreation and transit spending are at or below pre-pandemic levels. Higher food and hotel prices (which doesn’t mean we’re buying more food than we were in 2019, just that it costs more).
What causes inflation if not greedy workers, free money, and high demand? The most expensive domestic goods produce the biggest revenues for their manufacturers. They charge you more without paying their workers or suppliers more.
The largest price-gougers are funneling their earnings to rich people who store it offshore through stock buybacks and dividends. A $1 billion stock buyback doesn't buy $1 billion in bread.
Five factors influence US inflation today:
I. Price rises for energy and food
II. shifts in consumer tastes
III. supply interruptions (mainly autos);
IV. increased rents (due to telecommuting);
V. monopoly (AKA price-gouging).
None can be remedied by raising interest rates or laying off workers.
Russia's invasion of Ukraine, omicron, and China's Zero Covid policy all disrupted the flow of food, energy, and production inputs. The price went higher because we made less.
After Russia invaded Ukraine, oil prices spiked, and sanctions made it worse. But that was February. By October, oil prices had returned to pre-pandemic, 2015 levels attributable to global economic adjustments, including a shift to renewables. Every new renewable installation reduces oil consumption and affects oil prices.
High food prices have a simple solution. The US and EU have bribed farmers not to produce for 50 years. If the war continues, this program may end, and food prices may decline.
Demand changes. We want different things than in 2019, not more. During the lockdown, people substituted goods. Half of the US toilet-paper supply in 2019 was on commercial-sized rolls. This is created from different mills and stock than our toilet paper.
Lockdown pushed toilet paper demand to residential rolls, causing shortages (the TP hoarding story was just another pandemic urban legend). Because supermarket stores don't have accounts with commercial paper distributors, ordering from languishing stores was difficult. Kleenex and paper towel substitutions caused greater shortages.
All that drove increased costs in numerous product categories, and there were more cases. These increases are transient, caused by supply chain inefficiencies that are resolving.
Demand for frontline staff saw a one-time repricing of pay, which is being recouped as we speak.
Illnesses. Brittle, hollowed-out global supply chains aggravated this. The constant pursuit of cheap labor and minimal regulation by monopolies that dominate most sectors means things are manufactured in far-flung locations. Financialization means any surplus capital assets were sold off years ago, leaving firms with little production slack. After the epidemic, several of these systems took years to restart.
Automobiles are to blame. Financialization and monopolization consolidated microchip and auto production in Taiwan and China. When the lockdowns came, these worldwide corporations cancelled their chip orders, and when they placed fresh orders, they were at the back of the line.
That drove up car prices, which is why the US has slightly higher inflation than other wealthy countries: the economy is car-centric. Automobile prices account for 9% of the CPI. France: 3.6%
Rent shocks and telecommuting. After the epidemic, many professionals moved to exurbs, small towns, and the countryside to work from home. As commercial properties were vacated, it was impractical to adapt them for residential use due to planning restrictions. Addressing these restrictions will cut rent prices more than raising inflation rates, which halts housing construction.
Statistical mirages cause some rent inflation. The CPI estimates what homeowners would pay to rent their properties. When rents rise in your neighborhood, the CPI believes you're spending more on rent even if you have a 30-year fixed-rate mortgage.
Market dominance. Almost every area of the US economy is dominated by monopolies, whose CEOs disclose on investor calls that they use inflation scares to jack up prices and make record profits.
https://pluralistic.net/2022/02/02/its-the-economy-stupid/#overinflated
Long-term profit margins are rising. Markups averaged 26% from 1960-1980. 2021: 72%. Market concentration explains 81% of markup increases (e.g. monopolization). Profit margins reach a 70-year high in 2022. These elements interact. Monopolies thin out their sectors, making them brittle and sensitive to shocks.
If we're worried about a shrinking workforce, there are more humanitarian and sensible solutions than causing a recession and mass unemployment. Instead, we may boost US production capacity by easing workers' entry into the workforce.
https://pluralistic.net/2022/06/01/factories-to-condos-pipeline/#stuff-not-money
US female workforce participation ranks towards the bottom of developed countries. Many women can't afford to work due to America's lack of daycare, low earnings, and bad working conditions in female-dominated fields. If America doesn't have enough workers, childcare subsidies and minimum wages can help.
By contrast, driving the country into recession with interest-rate hikes will reduce employment, and the last recruited (women, minorities) are the first fired and the last to be rehired. Forcing America into recession won't enhance its capacity to create what its people want; it will degrade it permanently.
Nothing the Fed does can stop price hikes from international markets, lack of supply chain investment, COVID-19 disruptions, climate change, the Ukraine war, or market power. They can worsen it. When supply problems generate inflation, raising interest rates decreases investments that can remedy shortages.
Increasing interest rates won't cut rents since landlords pass on the expenses and high rates restrict investment in new dwellings where tenants could escape the costs.
Fixing the supply fixes supply-side inflation. Increase renewables investment (as the Inflation Reduction Act does). Monopolies can be busted (as the IRA does). Reshore key goods (as the CHIPS Act does). Better pay and child care attract employees.
Windfall taxes can claw back price-gouging corporations' monopoly earnings.
https://pluralistic.net/2022/03/15/sanctions-financing/#soak-the-rich
In 2008, we ruled out fiscal solutions (bailouts for debtors) and turned to monetary policy (bank bailouts). This preserved the economy but increased inequality and eroded public trust.
Monetary policy won't help. Even monetary policy enthusiasts recognize an 18-month lag between action and result. That suggests monetary tightening is unnecessary. Like the medieval bloodletter, central bankers whose interest rate hikes don't work swiftly may do more of the same, bringing the economy to its knees.
Interest rates must rise. Zero-percent interest fueled foolish speculation and financialization. Increasing rates will stop this. Increasing interest rates will destroy the economy and dampen inflation.
Then what? All recent evidence indicate to inflation decreasing on its own, as the authors argue. Supply side difficulties are finally being overcome, evidence shows. Energy and food prices are showing considerable mean reversion, which is disinflationary.
The authors don't recommend doing nothing. Best case scenario, they argue, is that the Fed won't keep raising interest rates until morale improves.

Jan-Patrick Barnert
3 years ago
Wall Street's Bear Market May Stick Around
If history is any guide, this bear market might be long and severe.
This is the S&P 500 Index's fourth such incident in 20 years. The last bear market of 2020 was a "shock trade" caused by the Covid-19 pandemic, although earlier ones in 2000 and 2008 took longer to bottom out and recover.
Peter Garnry, head of equities strategy at Saxo Bank A/S, compares the current selloff to the dotcom bust of 2000 and the 1973-1974 bear market marked by soaring oil prices connected to an OPEC oil embargo. He blamed high tech valuations and the commodity crises.
"This drop might stretch over a year and reach 35%," Garnry wrote.
Here are six bear market charts.
Time/depth
The S&P 500 Index plummeted 51% between 2000 and 2002 and 58% during the global financial crisis; it took more than 1,000 trading days to recover. The former took 638 days to reach a bottom, while the latter took 352 days, suggesting the present selloff is young.
Valuations
Before the tech bubble burst in 2000, valuations were high. The S&P 500's forward P/E was 25 times then. Before the market fell this year, ahead values were near 24. Before the global financial crisis, stocks were relatively inexpensive, but valuations dropped more than 40%, compared to less than 30% now.
Earnings
Every stock crash, especially earlier bear markets, returned stocks to fundamentals. The S&P 500 decouples from earnings trends but eventually recouples.
Support
Central banks won't support equity investors just now. The end of massive monetary easing will terminate a two-year bull run that was among the strongest ever, and equities may struggle without cheap money. After years of "don't fight the Fed," investors must embrace a new strategy.
Bear Haunting Bear
If the past is any indication, rising government bond yields are bad news. After the financial crisis, skyrocketing rates and a falling euro pushed European stock markets back into bear territory in 2011.
Inflation/rates
The current monetary policy climate differs from past bear markets. This is the first time in a while that markets face significant inflation and rising rates.
This post is a summary. Read full article here
You might also like

Scott Hickmann
4 years ago
YouTube
This is a YouTube video:

Clive Thompson
3 years ago
Small Pieces of Code That Revolutionized the World
Few sentences can have global significance.
Ethan Zuckerman invented the pop-up commercial in 1997.
He was working for Tripod.com, an online service that let people make little web pages for free. Tripod offered advertising to make money. Advertisers didn't enjoy seeing their advertising next to filthy content, like a user's anal sex website.
Zuckerman's boss wanted a solution. Wasn't there a way to move the ads away from user-generated content?
When you visited a Tripod page, a pop-up ad page appeared. So, the ad isn't officially tied to any user page. It'd float onscreen.
Here’s the thing, though: Zuckerman’s bit of Javascript, that created the popup ad? It was incredibly short — a single line of code:
window.open('http://tripod.com/navbar.html'
"width=200, height=400, toolbar=no, scrollbars=no, resizable=no, target=_top");
Javascript tells the browser to open a 200-by-400-pixel window on top of any other open web pages, without a scrollbar or toolbar.
Simple yet harmful! Soon, commercial websites mimicked Zuckerman's concept, infesting the Internet with pop-up advertising. In the early 2000s, a coder for a download site told me that most of their revenue came from porn pop-up ads.
Pop-up advertising are everywhere. You despise them. Hopefully, your browser blocks them.
Zuckerman wrote a single line of code that made the world worse.

I read Zuckerman's story in How 26 Lines of Code Changed the World. Torie Bosch compiled a humorous anthology of short writings about code that tipped the world.
Most of these samples are quite short. Pop-cultural preconceptions about coding say that important code is vast and expansive. Hollywood depicts programmers as blurs spouting out Niagaras of code. Google's success was formerly attributed to its 2 billion lines of code.
It's usually not true. Google's original breakthrough, the piece of code that propelled Google above its search-engine counterparts, was its PageRank algorithm, which determined a web page's value based on how many other pages connected to it and the quality of those connecting pages. People have written their own Python versions; it's only a few dozen lines.
Google's operations, like any large tech company's, comprise thousands of procedures. So their code base grows. The most impactful code can be brief.
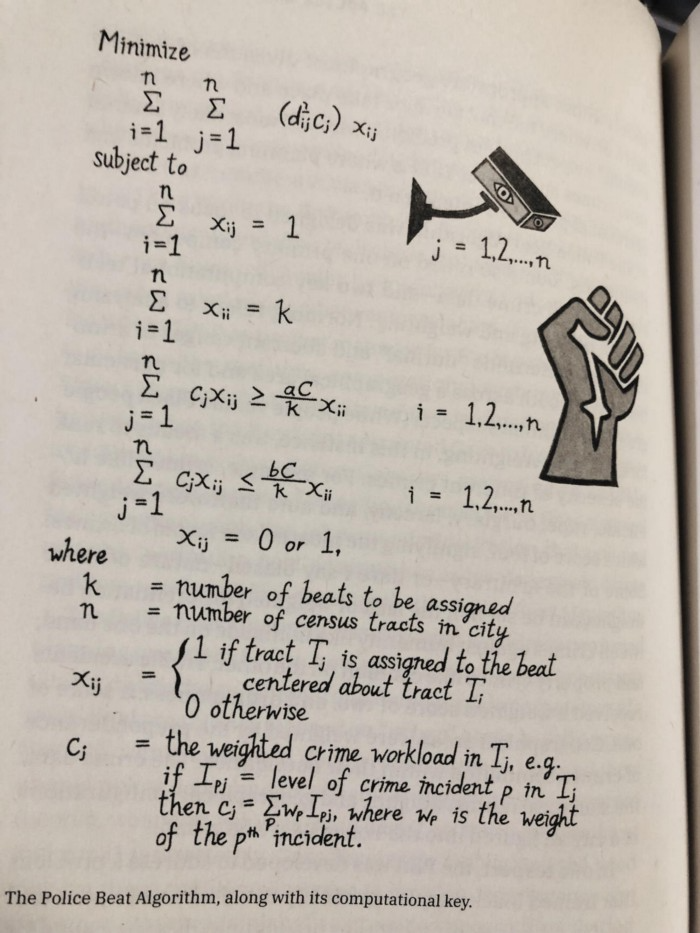
The examples are fascinating and wide-ranging, so read the whole book (or give it to nerds as a present). Charlton McIlwain wrote a chapter on the police beat algorithm developed in the late 1960s to anticipate crime hotspots so law enforcement could dispatch more officers there. It created a racial feedback loop. Since poor Black neighborhoods were already overpoliced compared to white ones, the algorithm directed more policing there, resulting in more arrests, which convinced it to send more police; rinse and repeat.
Kelly Chudler's You Are Not Expected To Understand This depicts the police-beat algorithm.
Even shorter code changed the world: the tracking pixel.
Lily Hay Newman's chapter on monitoring pixels says you probably interact with this code every day. It's a snippet of HTML that embeds a single tiny pixel in an email. Getting an email with a tracking code spies on me. As follows: My browser requests the single-pixel image as soon as I open the mail. My email sender checks to see if Clives browser has requested that pixel. My email sender can tell when I open it.
Adding a tracking pixel to an email is easy:
<img src="URL LINKING TO THE PIXEL ONLINE" width="0" height="0">An older example: Ellen R. Stofan and Nick Partridge wrote a chapter on Apollo 11's lunar module bailout code. This bailout code operated on the lunar module's tiny on-board computer and was designed to prioritize: If the computer grew overloaded, it would discard all but the most vital work.
When the lunar module approached the moon, the computer became overloaded. The bailout code shut down anything non-essential to landing the module. It shut down certain lunar module display systems, scaring the astronauts. Module landed safely.
22-line code
POODOO    INHINT
    CA  Q
    TS  ALMCADR

    TC  BANKCALL
    CADR  VAC5STOR  # STORE ERASABLES FOR DEBUGGING PURPOSES.

    INDEX  ALMCADR
    CAF  0
ABORT2    TC  BORTENT

OCT77770  OCT  77770    # DONT MOVE
    CA  V37FLBIT  # IS AVERAGE G ON
    MASK  FLAGWRD7
    CCS  A
    TC  WHIMPER -1  # YES.  DONT DO POODOO.  DO BAILOUT.

    TC  DOWNFLAG
    ADRES  STATEFLG

    TC  DOWNFLAG
    ADRES  REINTFLG

    TC  DOWNFLAG
    ADRES  NODOFLAG

    TC  BANKCALL
    CADR  MR.KLEAN
    TC  WHIMPER
This fun book is worth reading.
I'm a contributor to the New York Times Magazine, Wired, and Mother Jones. I've also written Coders: The Making of a New Tribe and the Remaking of the World and Smarter Than You Think: How Technology is Changing Our Minds. Twitter and Instagram: @pomeranian99; Mastodon: @clive@saturation.social.

Katherine Kornei
3 years ago
The InSight lander from NASA has recorded the greatest tremor ever felt on Mars.
The magnitude 5 earthquake was responsible for the discharge of energy that was 10 times greater than the previous record holder.
Any Martians who happen to be reading this should quickly learn how to duck and cover.
NASA's Jet Propulsion Laboratory in Pasadena, California, reported that on May 4, the planet Mars was shaken by an earthquake of around magnitude 5, making it the greatest Marsquake ever detected to this point. The shaking persisted for more than six hours and unleashed more than ten times as much energy as the earthquake that had previously held the record for strongest.
The event was captured on record by the InSight lander, which is operated by the United States Space Agency and has been researching the innards of Mars ever since it touched down on the planet in 2018 (SN: 11/26/18). The epicenter of the earthquake was probably located in the vicinity of Cerberus Fossae, which is located more than 1,000 kilometers away from the lander.
The surface of Cerberus Fossae is notorious for being broken up and experiencing periodic rockfalls. According to geophysicist Philippe Lognonné, who is the lead investigator of the Seismic Experiment for Interior Structure, the seismometer that is onboard the InSight lander, it is reasonable to assume that the ground is moving in that area. "This is an old crater from a volcanic eruption."
Marsquakes, which are similar to earthquakes in that they give information about the interior structure of our planet, can be utilized to investigate what lies beneath the surface of Mars (SN: 7/22/21). And according to Lognonné, who works at the Institut de Physique du Globe in Paris, there is a great deal that can be gleaned from analyzing this massive earthquake. Because the quality of the signal is so high, we will be able to focus on the specifics.