


More on Entrepreneurship/Creators

Woo
3 years ago
How To Launch A Business Without Any Risk
> Say Hello To The Lean-Hedge Model
People think starting a business requires significant debt and investment. Like Shark Tank, you need a world-changing idea. I'm not saying to avoid investors or brilliant ideas.
Investing is essential to build a genuinely profitable company. Think Apple or Starbucks.
Entrepreneurship is risky because many people go bankrupt from debt. As starters, we shouldn't do it. Instead, use lean-hedge.
Simply defined, you construct a cash-flow business to hedge against long-term investment-heavy business expenses.
What the “fx!$rench-toast” is the lean-hedge model?
When you start a business, your money should move down, down, down, then up when it becomes profitable.
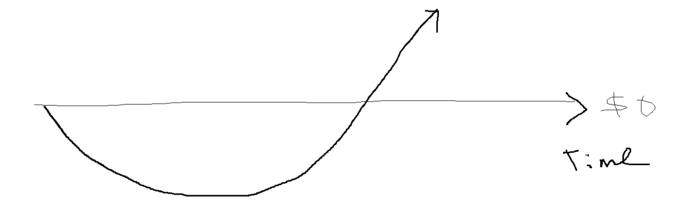
Many people don't survive the business's initial losses and debt. What if, we created a cash-flow business BEFORE we started our Starbucks to hedge against its initial expenses?
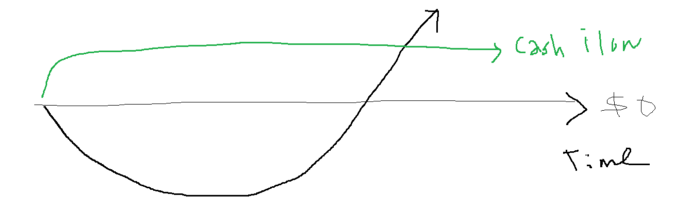
Lean-hedge has two sections. Start a cash-flow business. A cash-flow business takes minimal investment and usually involves sweat and time.
Let’s take a look at some examples:
A Translation company
Personal portfolio website (you make a site then you do cold e-mail marketing)
FREELANCE (UpWork, Fiverr).
Educational business.
Infomarketing. (You design a knowledge-based product. You sell the info).
Online fitness/diet/health coaching ($50-$300/month, calls, training plan)
Amazon e-book publishing. (Medium writers do this)
YouTube, cash-flow channel
A web development agency (I'm a dev, but if you're not, a graphic design agency, etc.) (Sell your time.)
Digital Marketing
Online paralegal (A million lawyers work in the U.S).
Some dropshipping (Organic Tik Tok dropshipping, where you create content to drive traffic to your shopify store instead of spend money on ads).
(Disclaimer: My first two cash-flow enterprises, which were language teaching, failed terribly. My translation firm is now booming because B2B e-mail marketing is easy.)
Crossover occurs. Your long-term business starts earning more money than your cash flow business.
My cash-flow business (freelancing, translation) makes $7k+/month.
I’ve decided to start a slightly more investment-heavy digital marketing agency
Here are the anticipated business's time- and money-intensive investments:
($$$) Top Front-End designer's Figma/UI-UX design (in negotiation)
(Time): A little copywriting (I will do this myself)
($$) Creating an animated webpage with HTML (in negotiation)
Backend Development (Duration) (I'll carry out this myself using Laravel.)
Logo Design ($$)
Logo Intro Video for $
Video Intro (I’ll edit this myself with Premiere Pro)
etc.
Then evaluate product, place, price, and promotion. Consider promotion and pricing.
The lean-hedge model's point is:
Don't gamble. Avoid debt. First create a cash-flow project, then grow it steadily.
Check read my previous posts on “Nightmare Mode” (which teaches you how to make work as interesting as video games) and Why most people can't escape a 9-5 to learn how to develop a cash-flow business.

Aure's Notes
3 years ago
I met a man who in just 18 months scaled his startup to $100 million.
A fascinating business conversation.

This week at Web Summit, I had mentor hour.
Mentor hour connects startups with experienced entrepreneurs.
The YC-selected founder who mentored me had grown his company to $100 million in 18 months.
I had 45 minutes to question him.
I've compiled this.
Context
Founder's name is Zack.
After working in private equity, Zack opted to acquire an MBA.
Surrounded by entrepreneurs at a prominent school, he decided to become one himself.
Unsure how to proceed, he bet on two horses.
On one side, he received an offer from folks who needed help running their startup owing to lack of time. On the other hand, he had an idea for a SaaS to start himself.
He just needed to validate it.
Validating
Since Zack's proposal helped companies, he contacted university entrepreneurs for comments.
He contacted university founders.
Once he knew he'd correctly identified the problem and that people were willing to pay to address it, he started developing.
He earned $100k in a university entrepreneurship competition.
His plan was evident by then.
The other startup's founders saw his potential and granted him $400k to launch his own SaaS.
Hiring
He started looking for a tech co-founder because he lacked IT skills.
He interviewed dozens and picked the finest.
As he didn't want to wait for his program to be ready, he contacted hundreds of potential clients and got 15 letters of intent promising they'd join up when it was available.
YC accepted him by then.
He had enough positive signals to raise.
Raising
He didn't say how many VCs he called, but he indicated 50 were interested.
He jammed meetings into two weeks to generate pressure and encourage them to invest.
Seed raise: $11 million.
Selling
His objective was to contact as many entrepreneurs as possible to promote his product.
He first contacted startups by scraping CrunchBase data.
Once he had more money, he started targeting companies with ZoomInfo.
His VC urged him not to hire salespeople until he closed 50 clients himself.
He closed 100 and hired a CRO through a headhunter.
Scaling
Three persons started the business.
He primarily works in sales.
Coding the product was done by his co-founder.
Another person performing operational duties.
He regretted recruiting the third co-founder, who was ineffective (could have hired an employee instead).
He wanted his company to be big, so he hired two young marketing people from a competing company.
After validating several marketing channels, he chose PR.
$100 Million and under
He developed a sales team and now employs 30 individuals.
He raised a $100 million Series A.
Additionally, he stated
He’s been rejected a lot. Like, a lot.
Two great books to read: Steve Jobs by Isaacson, and Why Startups Fail by Tom Eisenmann.
The best skill to learn for non-tech founders is “telling stories”, which means sales. A founder’s main job is to convince: co-founders, employees, investors, and customers. Learn code, or learn sales.
Conclusion
I often read about these stories but hardly take them seriously.
Zack was amazing.
Three things about him stand out:
His vision. He possessed a certain amount of fire.
His vitality. The man had a lot of enthusiasm and spoke quickly and decisively. He takes no chances and pushes the envelope in all he does.
His Rolex.
He didn't do all this in 18 months.
Not really.
He couldn't launch his company without private equity experience.
These accounts disregard entrepreneurs' original knowledge.
Hormozi will tell you how he founded Gym Launch, but he won't tell you how he had a gym first, how he worked at uni to pay for his gym, or how he went to the gym and learnt about fitness, which gave him the idea to open his own.
Nobody knows nothing. If you scale quickly, it's probable because you gained information early.
Lincoln said, "Give me six hours to chop down a tree, and I'll spend four sharpening the axe."
Sharper axes cut trees faster.

SAHIL SAPRU
3 years ago
How I grew my business to a $5 million annual recurring revenue
Scaling your startup requires answering customer demands, not growth tricks.
I cofounded Freedo Rentals in 2019. I reached 50 lakh+ ARR in 6 months before quitting owing to the epidemic.
Freedo aimed to solve 2 customer pain points:
Users lacked a reliable last-mile transportation option.
The amount that Auto walas charge for unmetered services
Solution?
Effectively simple.
Build ports at high-demand spots (colleges, residential societies, metros). Electric ride-sharing can meet demand.
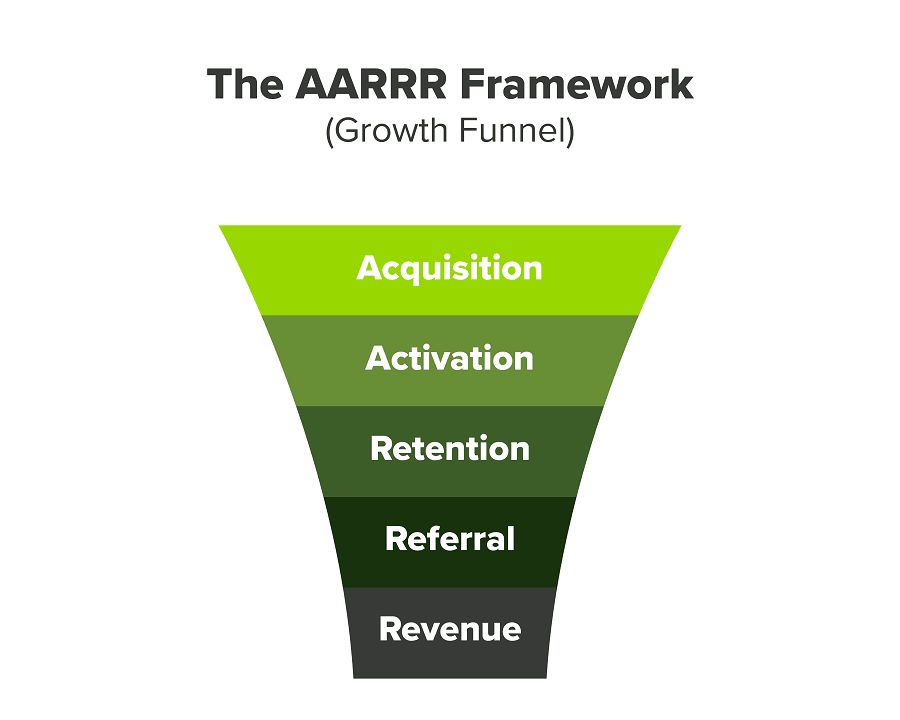
We had many problems scaling. I'll explain using the AARRR model.
Brand unfamiliarity or a novel product offering were the problems with awareness. Nobody knew what Freedo was or what it did.
Problem with awareness: Content and advertisements did a poor job of communicating the task at hand. The advertisements clashed with the white-collar part because they were too cheesy.
Retention Issue: We encountered issues, indicating that the product was insufficient. Problems with keyless entry, creating bills, stealing helmets, etc.
Retention/Revenue Issue: Costly compared to established rivals. Shared cars were 1/3 of our cost.
Referral Issue: Missing the opportunity to seize the AHA moment. After the ride, nobody remembered us.
Once you know where you're struggling with AARRR, iterative solutions are usually best.
Once you have nailed the AARRR model, most startups use paid channels to scale. This dependence, on paid channels, increases with scale unless you crack your organic/inbound game.
Over-index growth loops. Growth loops increase inflow and customers as you scale.
When considering growth, ask yourself:
Who is the solution's ICP (Ideal Customer Profile)? (To whom are you selling)
What are the most important messages I should convey to customers? (This is an A/B test.)
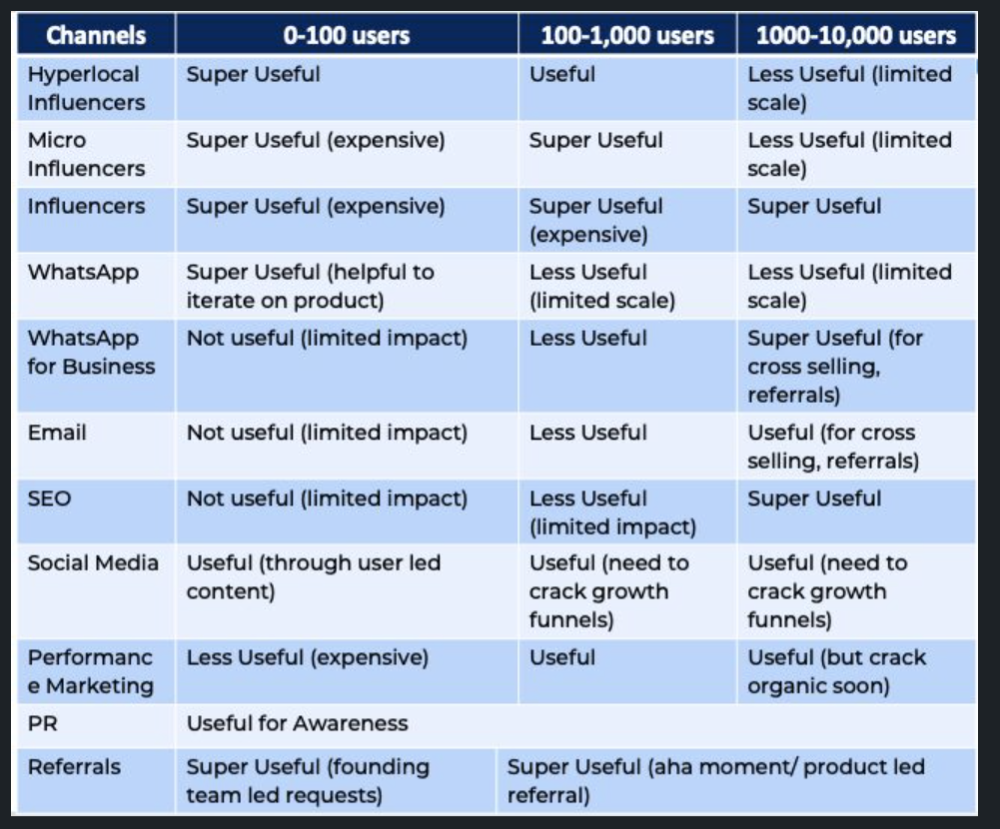
Which marketing channels ought I prioritize? (Conduct analysis based on the startup's maturity/stage.)
Choose the important metrics to monitor for your AARRR funnel (not all metrics are equal)
Identify the Flywheel effect's growth loops (inertia matters)
My biggest mistakes:
not paying attention to consumer comments or satisfaction. It is the main cause of problems with referrals, retention, and acquisition for startups. Beyond your NPS, you should consider second-order consequences.
The tasks at hand should be quite clear.
Here's my scaling equation:
Growth = A x B x C
A = Funnel top (Traffic)
B = Product Valuation (Solving a real pain point)
C = Aha! (Emotional response)
Freedo's A, B, and C created a unique offering.
Freedo’s ABC:
A — Working or Studying population in NCR
B — Electric Vehicles provide last-mile mobility as a clean and affordable solution
C — One click booking with a no-noise scooter
Final outcome:
FWe scaled Freedo to Rs. 50 lakh MRR and were growing 60% month on month till the pandemic ceased our growth story.
How we did it?
We tried ambassadors and coupons. WhatsApp was our most successful A/B test.
We grew widespread adoption through college and society WhatsApp groups. We requested users for referrals in community groups.
What worked for us won't work for others. This scale underwent many revisions.
Every firm is different, thus you must know your customers. Needs to determine which channel to prioritize and when.
Users desired a safe, time-bound means to get there.
This (not mine) growth framework helped me a lot. You should follow suit.
You might also like

Sam Hickmann
3 years ago
Improving collaboration with the Six Thinking Hats
Six Thinking Hats was written by Dr. Edward de Bono. "Six Thinking Hats" and parallel thinking allow groups to plan thinking processes in a detailed and cohesive way, improving collaboration.
Fundamental ideas
In order to develop strategies for thinking about specific issues, the method assumes that the human brain thinks in a variety of ways that can be intentionally challenged. De Bono identifies six brain-challenging directions. In each direction, the brain brings certain issues into conscious thought (e.g. gut instinct, pessimistic judgement, neutral facts). Some may find wearing hats unnatural, uncomfortable, or counterproductive.
The example of "mismatch" sensitivity is compelling. In the natural world, something out of the ordinary may be dangerous. This mode causes negative judgment and critical thinking.
Colored hats represent each direction. Putting on a colored hat symbolizes changing direction, either literally or metaphorically. De Bono first used this metaphor in his 1971 book "Lateral Thinking for Management" to describe a brainstorming framework. These metaphors allow more complete and elaborate thought separation. Six thinking hats indicate ideas' problems and solutions.
Similarly, his CoRT Thinking Programme introduced "The Five Stages of Thinking" method in 1973.
| HAT | OVERVIEW | TECHNIQUE |
|---|---|---|
| BLUE | "The Big Picture" & Managing | CAF (Consider All Factors); FIP (First Important Priorities) |
| WHITE | "Facts & Information" | Information |
| RED | "Feelings & Emotions" | Emotions and Ego |
| BLACK | "Negative" | PMI (Plus, Minus, Interesting); Evaluation |
| YELLOW | "Positive" | PMI |
| GREEN | "New Ideas" | Concept Challenge; Yes, No, Po |
Strategies and programs
After identifying the six thinking modes, programs can be created. These are groups of hats that encompass and structure the thinking process. Several of these are included in the materials for franchised six hats training, but they must often be adapted. Programs are often "emergent," meaning the group plans the first few hats and the facilitator decides what to do next.
The group agrees on how to think, then thinks, then evaluates the results and decides what to do next. Individuals or groups can use sequences (and indeed hats). Each hat is typically used for 2 minutes at a time, although an extended white hat session is common at the start of a process to get everyone on the same page. The red hat is recommended to be used for a very short period to get a visceral gut reaction – about 30 seconds, and in practice often takes the form of dot-voting.
| ACTIVITY | HAT SEQUENCE |
|---|---|
| Initial Ideas | Blue, White, Green, Blue |
| Choosing between alternatives | Blue, White, (Green), Yellow, Black, Red, Blue |
| Identifying Solutions | Blue, White, Black, Green, Blue |
| Quick Feedback | Blue, Black, Green, Blue |
| Strategic Planning | Blue, Yellow, Black, White, Blue, Green, Blue |
| Process Improvement | Blue, White, White (Other People's Views), Yellow, Black, Green, Red, Blue |
| Solving Problems | Blue, White, Green, Red, Yellow, Black, Green, Blue |
| Performance Review | Blue, Red, White, Yellow, Black, Green, Blue |
Use
Speedo's swimsuit designers reportedly used the six thinking hats. "They used the "Six Thinking Hats" method to brainstorm, with a green hat for creative ideas and a black one for feasibility.
Typically, a project begins with extensive white hat research. Each hat is used for a few minutes at a time, except the red hat, which is limited to 30 seconds to ensure an instinctive gut reaction, not judgement. According to Malcolm Gladwell's "blink" theory, this pace improves thinking.
De Bono believed that the key to a successful Six Thinking Hats session was focusing the discussion on a particular approach. A meeting may be called to review and solve a problem. The Six Thinking Hats method can be used in sequence to explore the problem, develop a set of solutions, and choose a solution through critical examination.
Everyone may don the Blue hat to discuss the meeting's goals and objectives. The discussion may then shift to Red hat thinking to gather opinions and reactions. This phase may also be used to determine who will be affected by the problem and/or solutions. The discussion may then shift to the (Yellow then) Green hat to generate solutions and ideas. The discussion may move from White hat thinking to Black hat thinking to develop solution set criticisms.
Because everyone is focused on one approach at a time, the group is more collaborative than if one person is reacting emotionally (Red hat), another is trying to be objective (White hat), and another is critical of the points which emerge from the discussion (Black hat). The hats help people approach problems from different angles and highlight problem-solving flaws.
Scott Hickmann
4 years ago
YouTube
This is a YouTube video:

Sean Bloomfield
3 years ago
How Jeff Bezos wins meetings over
We've all been there: You propose a suggestion to your team at a meeting, and most people appear on board, but a handful or small minority aren't. How can we achieve collective buy-in when we need to go forward but don't know how to deal with some team members' perceived intransigence?
Steps:
Investigate the divergent opinions: Begin by sincerely attempting to comprehend the viewpoint of your disagreeing coworkers. Maybe it makes sense to switch horses in the middle of the race. Have you completely overlooked a blind spot, such as a political concern that could arise as an unexpected result of proceeding? This is crucial to ensure that the person or people feel heard as well as to advance the goals of the team. Sometimes all individuals need is a little affirmation before they fully accept your point of view.
It says a lot about you as a leader to be someone who always lets the perceived greatest idea win, regardless of the originating channel, if after studying and evaluating you see the necessity to align with the divergent position.
If, after investigation and assessment, you determine that you must adhere to the original strategy, we go to Step 2.
2. Disagree and Commit: Jeff Bezos, CEO of Amazon, has had this experience, and Julie Zhuo describes how he handles it in her book The Making of a Manager.
It's OK to disagree when the team is moving in the right direction, but it's not OK to accidentally or purposefully damage the team's efforts because you disagree. Let the team know your opinion, but then help them achieve company goals even if they disagree. Unknown. You could be wrong in today's ever-changing environment.
So next time you have a team member who seems to be dissenting and you've tried the previous tactics, you may ask the individual in the meeting I understand you but I don't want us to leave without you on board I need your permission to commit to this approach would you give us your commitment?