


More on Marketing

Francesca Furchtgott
3 years ago
Giving customers what they want or betraying the values of the brand?
A J.Crew collaboration for fashion label Eveliina Vintage is not a paradox; it is a solution.
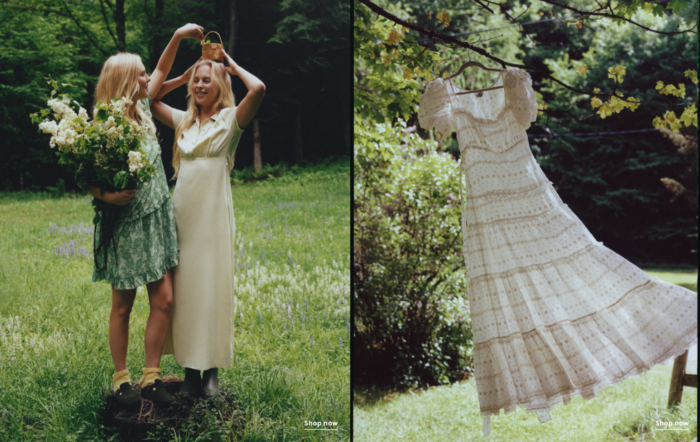
Eveliina Vintage's capsule collection debuted yesterday at J.Crew. This J.Crew partnership stopped me in my tracks.
Eveliina Vintage sells vintage goods. Eeva Musacchia founded the shop in Finland in the 1970s. It's recognized for its one-of-a-kind slip dresses from the 1930s and 1940s.
I wondered why a vintage brand would partner with a mass shop. Fast fashion against vintage shopping? Will Eveliina Vintages customers be turned off?
But Eveliina Vintages customers don't care about sustainability. They want Eveliina's Instagram look. Eveliina Vintage collaborated with J.Crew to give customers what they wanted: more Eveliina at a lower price.
Vintage: A Fashion Option That Is Eco-Conscious
Secondhand shopping is a trendy response to quick fashion. J.Crew releases hundreds of styles annually. Waste and environmental damage have been criticized. A pair of jeans requires 1,800 gallons of water. J.Crew's limited-time deals promote more purchases. J.Crew items are likely among those Americans wear 7 times before discarding.
Consumers and designers have emphasized sustainability in recent years. Stella McCartney and Eileen Fisher are popular eco-friendly brands. They've also flocked to ThredUp and similar sites.
Gap, Levis, and Allbirds have listened to consumer requests. They promote recycling, ethical sourcing, and secondhand shopping.
Secondhand shoppers feel good about reusing and recycling clothing that might have ended up in a landfill.
Eco-conscious fashionistas shop vintage. These shoppers enjoy the thrill of the hunt (that limited-edition Chanel bag!) and showing off a unique piece (nobody will have my look!). They also reduce their environmental impact.
Is Eveliina Vintage capitalizing on an aesthetic or is it a sustainable brand?
Eveliina Vintage emphasizes environmental responsibility. Vogue's Amanda Musacchia emphasized sustainability. Amanda, founder Eeva's daughter, is a company leader.
But Eveliina's press message doesn't address sustainability, unlike Instagram. Scarcity and fame rule.
Eveliina Vintages Instagram has see-through dresses and lace-trimmed slip dresses. Celebrities and influencers are often photographed in Eveliina's apparel, which has 53,000+ followers. Vogue appreciates Eveliina's style. Multiple publications discuss Alexa Chung's Eveliina dress.
Eveliina Vintage markets its one-of-a-kind goods. It teases future content, encouraging visitors to return. Scarcity drives demand and raises clothing prices. One dress is $1,600+, but most are $500-$1,000.
The catch: Eveliina can't monetize its expanding popularity due to exorbitant prices and limited quantity. Why?
Most people struggle to pay for their clothing. But Eveliina Vintage lacks those more affordable entry-level products, in contrast to other luxury labels that sell accessories or perfume.
Many people have trouble fitting into their clothing. The bodies of most women in the past were different from those for which vintage clothing was designed. Each Eveliina dress's specific measurements are mentioned alongside it. Be careful, you can fall in love with an ill-fitting dress.
No matter how many people can afford it and fit into it, there is only one item to sell. To get the item before someone else does, those people must be on the Eveliina Vintage website as soon as it becomes available.
A Way for Eveliina Vintage to Make Money (and Expand) with J.Crew Its following
Eveliina Vintages' cooperation with J.Crew makes commercial sense.
This partnership spreads Eveliina's style. Slightly better pricing The $390 outfits have multicolored slips and gauzy cotton gowns. Sizes range from 00 to 24, which is wider than vintage racks.
Eveliina Vintage customers like the combination. Excited comments flood the brand's Instagram launch post. Nobody is mocking the 50-year-old vintage brand's fast-fashion partnership.
Vintage may be a sustainable fashion trend, but that's not why Eveliina's clients love the brand. They only care about the old look.
And that is a tale as old as fashion.

Jano le Roux
3 years ago
Here's What I Learned After 30 Days Analyzing Apple's Microcopy
Move people with tiny words.
Apple fanboy here.
Macs are awesome.
Their iPhones rock.
$19 cloths are great.
$999 stands are amazing.
I love Apple's microcopy even more.
It's like the marketing goddess bit into the Apple logo and blessed the world with microcopy.
I took on a 30-day micro-stalking mission.
Every time I caught myself wasting time on YouTube, I had to visit Apple’s website to learn the secrets of the marketing goddess herself.
We've learned. Golden apples are calling.
Cut the friction
Benefit-first, not commitment-first.
Brands lose customers through friction.
Most brands don't think like customers.
Brands want sales.
Brands want newsletter signups.
Here's their microcopy:
“Buy it now.”
“Sign up for our newsletter.”
Both are difficult. They ask for big commitments.
People are simple creatures. Want pleasure without commitment.
Apple nails this.
So, instead of highlighting the commitment, they highlight the benefit of the commitment.
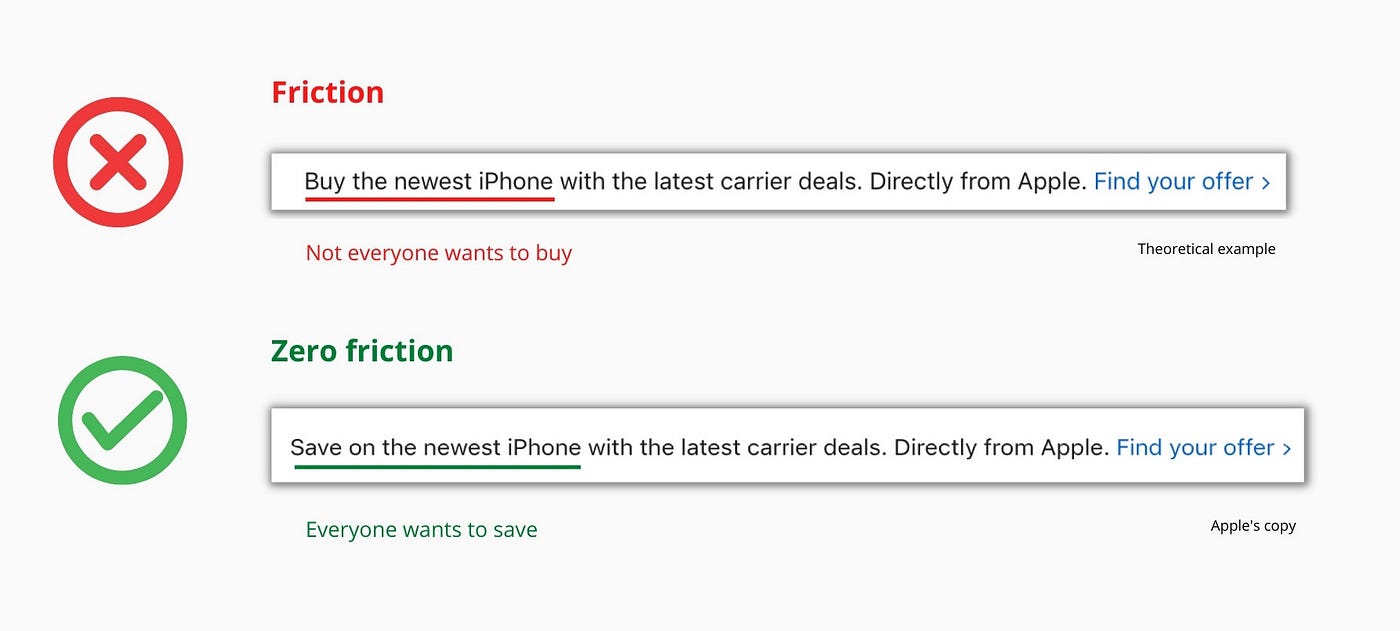
Saving on the latest iPhone sounds easier than buying it. Everyone saves, but not everyone buys.
A subtle change in framing reduces friction.
Apple eliminates customer objections to reduce friction.
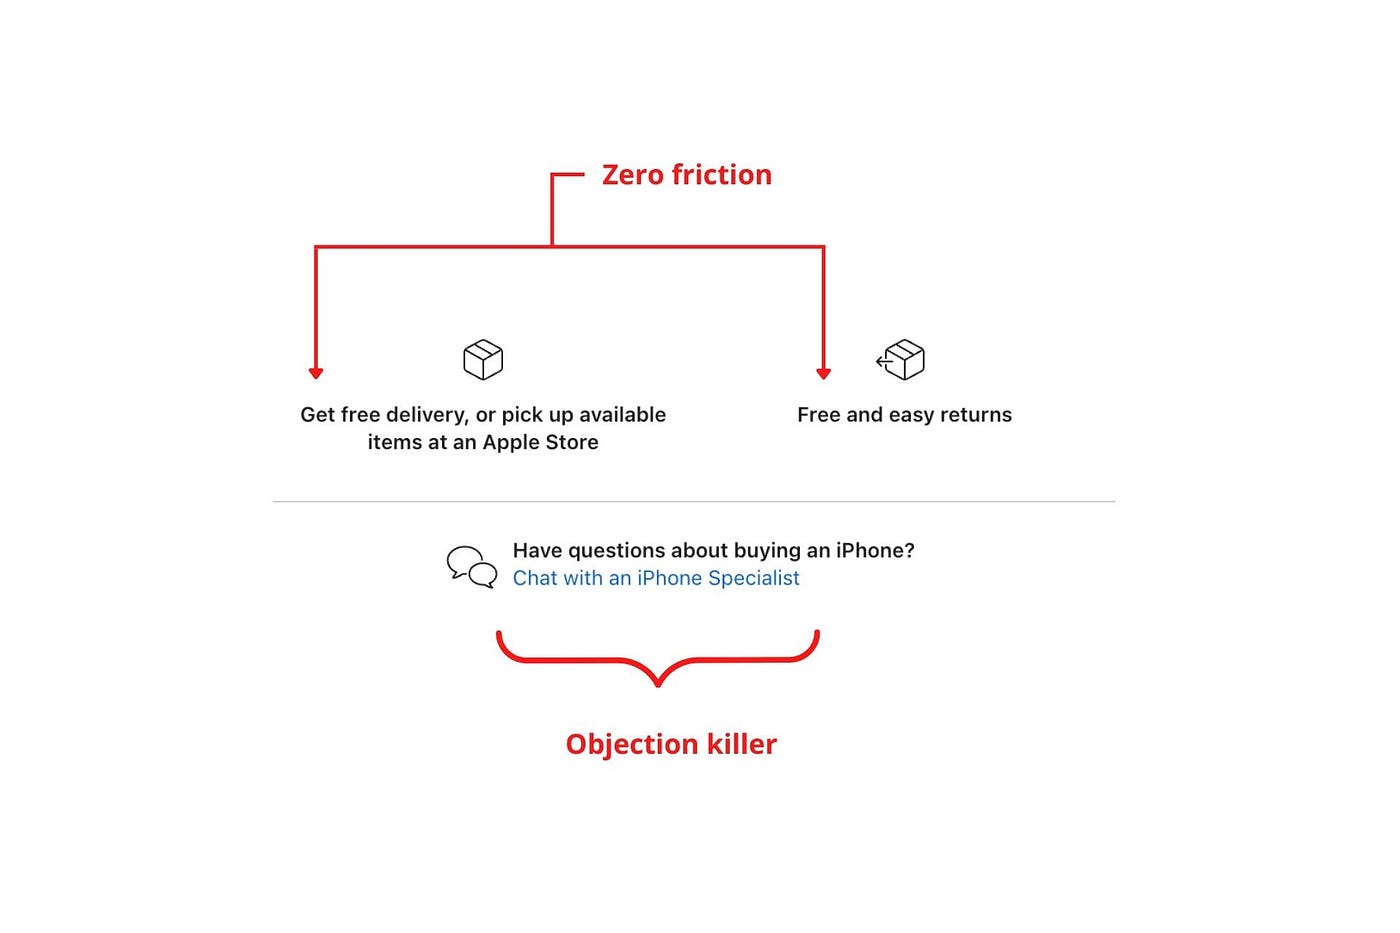
Less customer friction means simpler processes.
Apple's copy expertly reassures customers about shipping fees and not being home. Apple assures customers that returning faulty products is easy.
Apple knows that talking to a real person is the best way to reduce friction and improve their copy.
Always rhyme
Learn about fine rhyme.
Poets make things beautiful with rhyme.
Copywriters use rhyme to stand out.
Apple’s copywriters have mastered the art of corporate rhyme.
Two techniques are used.
1. Perfect rhyme
Here, rhymes are identical.

2. Imperfect rhyme
Here, rhyming sounds vary.

Apple prioritizes meaning over rhyme.
Apple never forces rhymes that don't fit.
It fits so well that the copy seems accidental.
Add alliteration
Alliteration always entertains.
Alliteration repeats initial sounds in nearby words.
Apple's copy uses alliteration like no other brand I've seen to create a rhyming effect or make the text more fun to read.
For example, in the sentence "Sam saw seven swans swimming," the initial "s" sound is repeated five times. This creates a pleasing rhythm.
Microcopy overuse is like pouring ketchup on a Michelin-star meal.
Alliteration creates a memorable phrase in copywriting. It's subtler than rhyme, and most people wouldn't notice; it simply resonates.
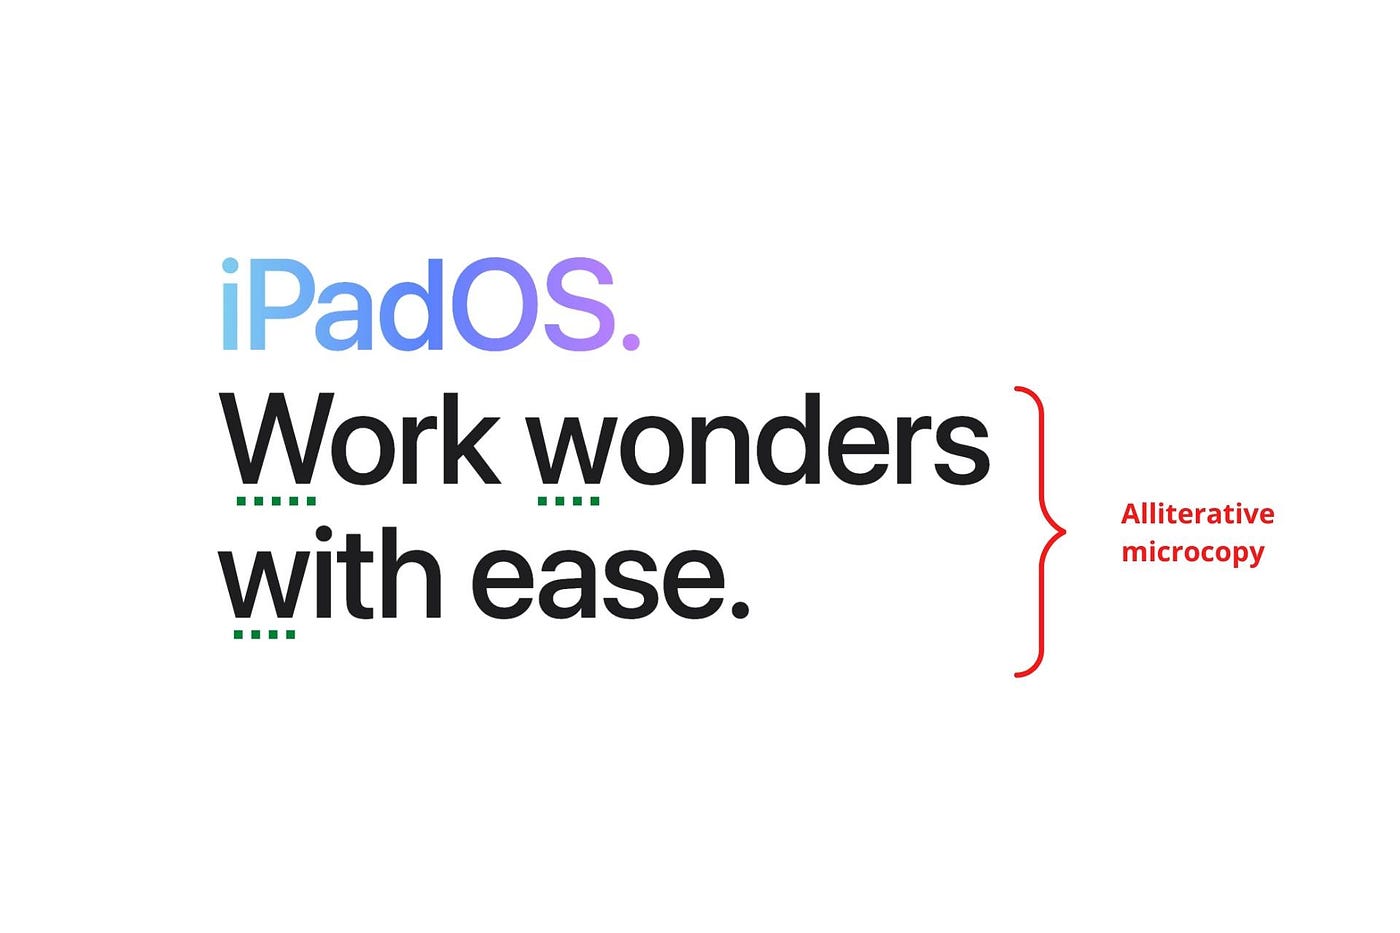
I love how Apple uses alliteration and contrast between "wonders" and "ease".
Assonance, or repeating vowels, isn't Apple's thing.
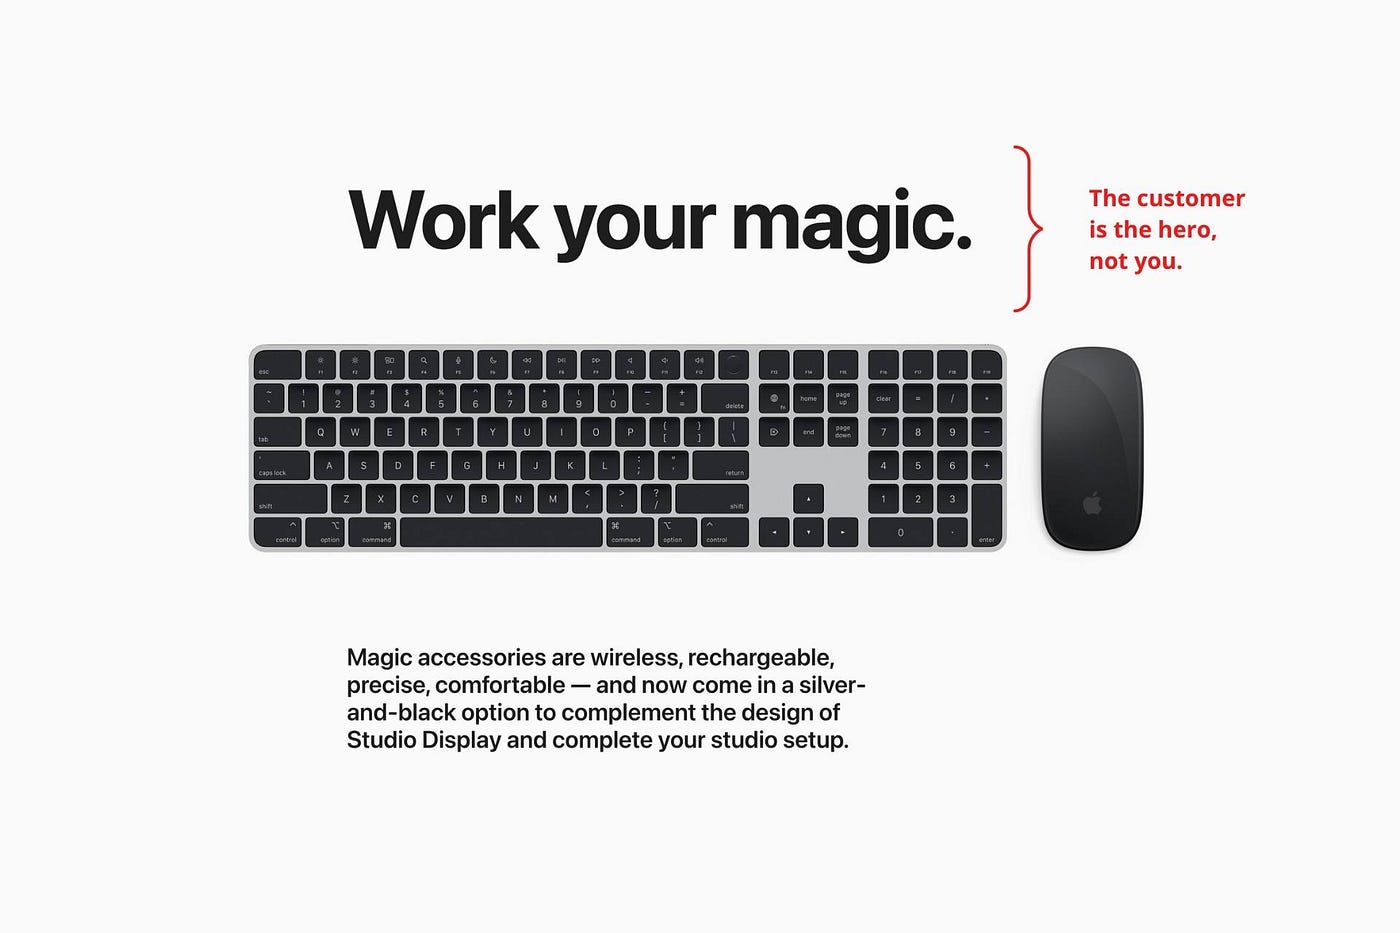
You ≠ Hero, Customer = Hero
Your brand shouldn't be the hero.
Because they'll be using your product or service, your customer should be the hero of your copywriting. With your help, they should feel like they can achieve their goals.
I love how Apple emphasizes what you can do with the machine in this microcopy.

It's divine how they position their tools as sidekicks to help below.
This one takes the cake:
Dialogue-style writing
Conversational copy engages.
Excellent copy Like sharing gum with a friend.
This helps build audience trust.
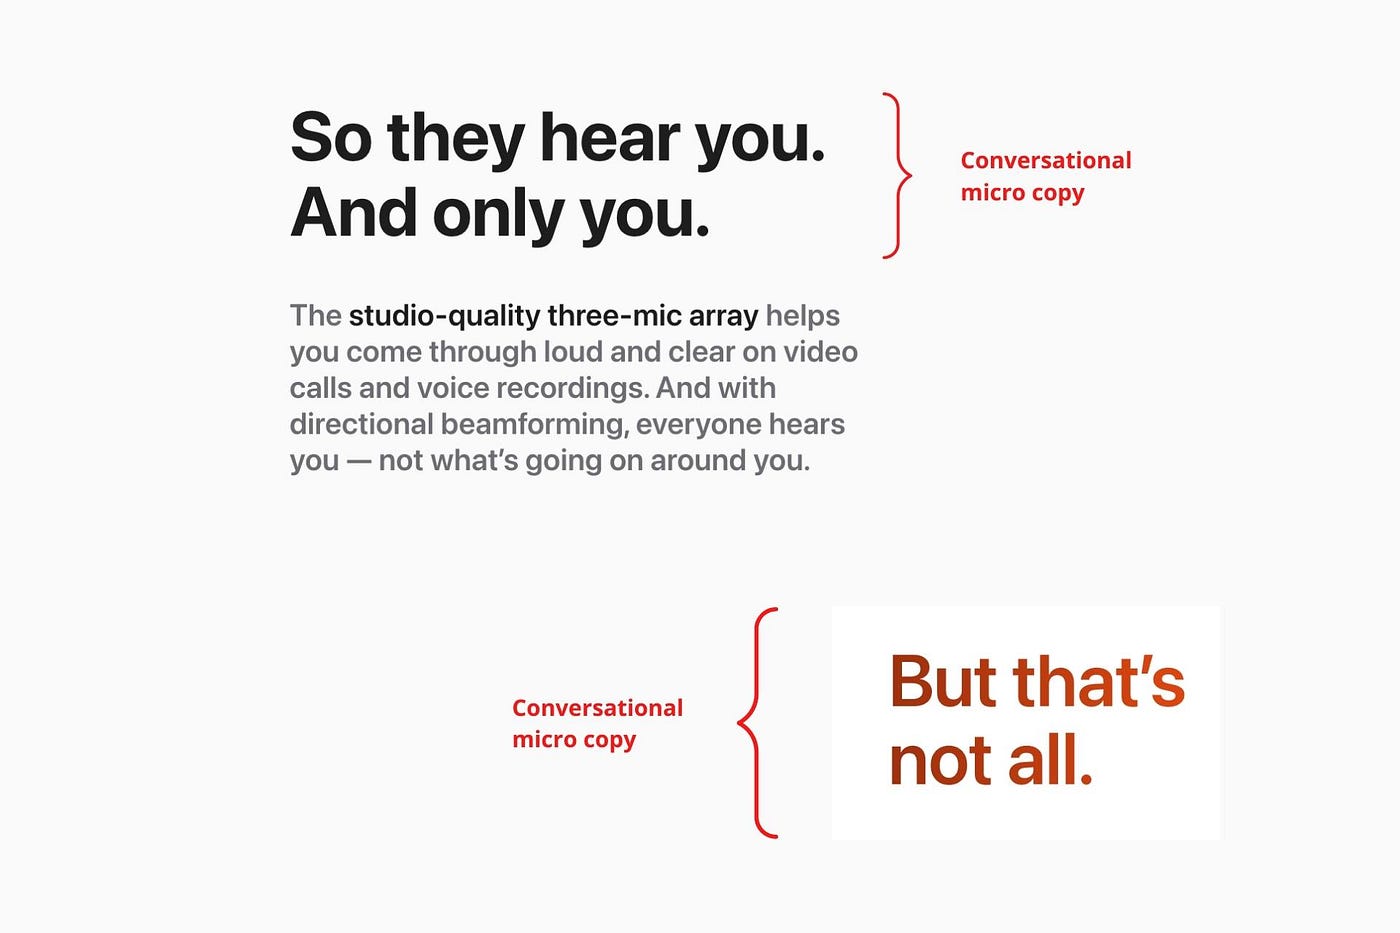
Apple does this by using natural connecting words like "so" and phrases like "But that's not all."
Snowclone-proof
The mother of all microcopy techniques.
A snowclone uses an existing phrase or sentence to create a new one. The new phrase or sentence uses the same structure but different words.
It’s usually a well know saying like:
To be or not to be.
This becomes a formula:
To _ or not to _.
Copywriters fill in the blanks with cause-related words. Example:
To click or not to click.

Apple turns "survival of the fittest" into "arrival of the fittest."
It's unexpected and surprises the reader.
So this was fun.
But my fun has just begun.
Microcopy is 21st-century poetry.
I came as an Apple fanboy.
I leave as an Apple fanatic.
Now I’m off to find an apple tree.
Cause you know how it goes.
(Apples, trees, etc.)
This post is a summary. Original post available here.

Karo Wanner
3 years ago
This is how I started my Twitter account.
My 12-day results look good.
Twitter seemed for old people and politicians.
I thought the platform would die soon like Facebook.
The platform's growth stalled around 300m users between 2015 and 2019.
In 2020, Twitter grew and now has almost 400m users.
Niharikaa Kaur Sodhi built a business on Twitter while I was away, despite its low popularity.
When I read about the success of Twitter users in the past 2 years, I created an account and a 3-month strategy.
I'll see if it's worth starting Twitter in 2022.
Late or perfect? I'll update you. Track my Twitter growth. You can find me here.
My Twitter Strategy
My Twitter goal is to build a community and recruit members for Mindful Monday.
I believe mindfulness is the only way to solve problems like poverty, inequality, and the climate crisis.
The power of mindfulness is my mission.
Mindful Monday is your weekly reminder to live in the present moment. I send mindfulness tips every Monday.
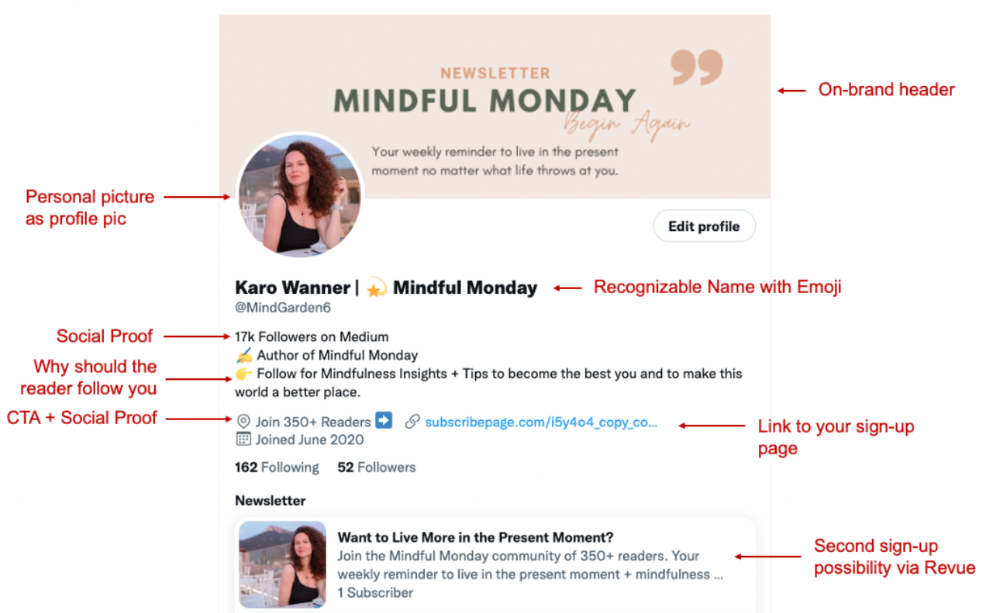
My Twitter profile promotes Mindful Monday and encourages people to join.
What I paid attention to:
I designed a brand-appropriate header to promote Mindful Monday.
Choose a profile picture. People want to know who you are.
I added my name as I do on Medium, Instagram, and emails. To stand out and be easily recognized, add an emoji if appropriate. Add what you want to be known for, such as Health Coach, Writer, or Newsletter.
People follow successful, trustworthy people. Describe any results you have. This could be views, followers, subscribers, or major news outlets. Create!
Tell readers what they'll get by following you. Can you help?
Add CTA to your profile. Your Twitter account's purpose. Give instructions. I placed my sign-up link next to the CTA to promote Mindful Monday. Josh Spector recommended this. (Thanks! Bonus tip: If you don't want the category to show in your profile, e.g. Entrepreneur, go to edit profile, edit professional profile, and choose 'Other'
Here's my Twitter:
I'm no expert, but I tried. Please share any additional Twitter tips and suggestions in the comments.
To hide your Revue newsletter subscriber count:
Join Revue. Select 'Hide Subscriber Count' in Account settings > Settings > Subscriber Count. Voila!
How frequently should you tweet?
1 to 20 Tweets per day, but consistency is key.
Stick to a daily tweet limit. Start with less and be consistent than the opposite.
I tweet 3 times per day. That's my comfort zone. Larger accounts tweet 5–7 times daily.
Do what works for you and that is the right amount.
Twitter is a long-term game, so plan your tweets for a year.
How to Batch Your Tweets?
Sunday batchs.
Sunday evenings take me 1.5 hours to create all my tweets for the week.
Use a word document and write down your posts. Podcasts, books, my own articles inspire me.
When I have a good idea or see a catchy Tweet, I take a screenshot.
To not copy but adapt.
Two pillars support my content:
(90% ~ 29 tweets per week) Inspirational quotes, mindfulness tips, zen stories, mistakes, myths, book recommendations, etc.
(10% 2 tweets per week) I share how I grow Mindful Monday with readers. This pillar promotes MM and behind-the-scenes content.
Second, I schedule all my Tweets using TweetDeck. I tweet at 7 a.m., 5 p.m., and 6 p.m.
Include Twitter Threads in your content strategy
Tweets are blog posts. In your first tweet, you include a headline, then tweet your content.
That’s how you create a series of connected Tweets.
What’s the point? You have more room to convince your reader you're an expert.
Add a call-to-action to your thread.
Follow for more like this
Newsletter signup (share your link)
Ask for retweet
One thread per week is my goal.
I'll schedule threads with Typefully. In the free version, you can schedule one Tweet, but that's fine.
Pin a thread to the top of your profile if it leads to your newsletter. So new readers see your highest-converting content first.
Tweet Medium posts
I also tweet Medium articles.
I schedule 1 weekly repost for 5 weeks after each publication. I share the same article daily for 5 weeks.
Every time I tweet, I include a different article quote, so even if the link is the same, the quote adds value.
Engage Other Experts
When you first create your account, few people will see it. Normal.
If you comment on other industry accounts, you can reach their large audience.
First, you need 50 to 100 followers. Here's my beginner tip.
15 minutes a day or when I have downtime, I comment on bigger accounts in my niche.
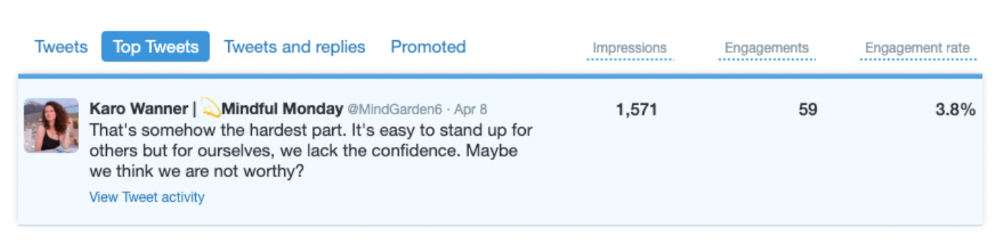
My 12-Day Results
Now let's look at the first data.
I had 32 followers on March 29. 12 followers in 11 days. I have 52 now.
Not huge, but growing rapidly.
Let's examine impressions/views.
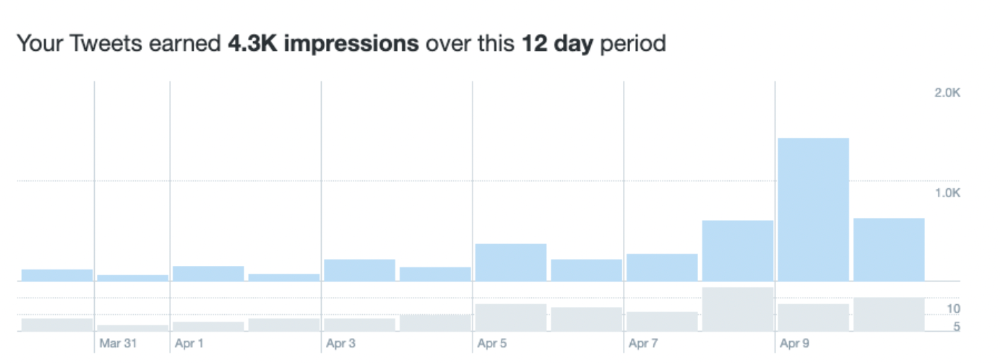
As a newbie, I gained 4,300 impressions/views in 12 days. On Medium, I got fewer views.
The 1,6k impressions per day spike comes from a larger account I mentioned the day before. First, I was shocked to see the spike and unsure of its origin.
These results are promising given the effort required to be consistent on Twitter.
Let's see how my journey progresses. I'll keep you posted.
Tweeters, Does this content strategy make sense? What's wrong? Comment below.
Let's support each other on Twitter. Here's me.
Which Twitter strategy works for you in 2022?
This post is a summary. Read the full article here
You might also like

Abhimanyu Bhargava
3 years ago
VeeFriends Series 2: The Biggest NFT Opportunity Ever
VeeFriends is one NFT project I'm sure will last.
I believe in blockchain technology and JPEGs, aka NFTs. NFTs aren't JPEGs. It's not as it seems.
Gary Vaynerchuk is leading the pack with his new NFT project VeeFriends, I wrote a year ago. I was spot-on. It's the most innovative project I've seen.
Since its minting in May 2021, it has given its holders enormous value, most notably the first edition of VeeCon, a multi-day superconference featuring iconic and emerging leaders in NFTs and Popular Culture. First-of-its-kind NFT-ticketed Web3 conference to build friendships, share ideas, and learn together.
VeeFriends holders got free VeeCon NFT tickets. Attendees heard iconic keynote speeches, innovative talks, panels, and Q&A sessions.
It was a unique conference that most of us, including me, are looking forward to in 2023. The lineup was epic, and it allowed many to network in new ways. Really memorable learning. Here are a couple of gratitude posts from the attendees.
VeeFriends Series 2
This article explains VeeFriends if you're still confused.
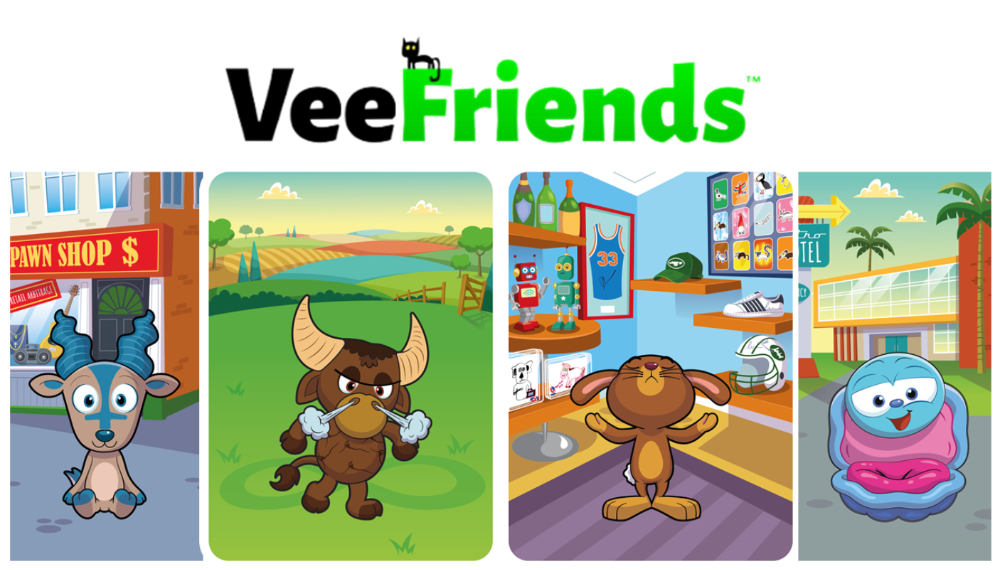
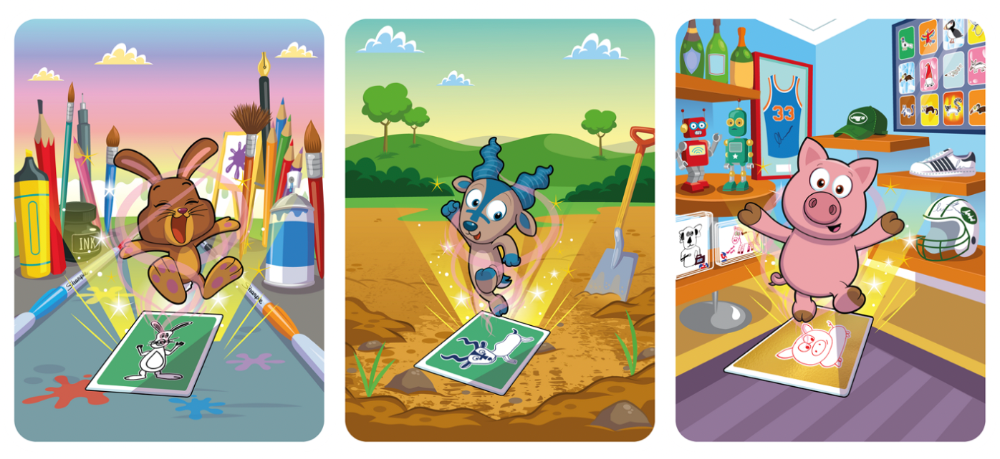
GaryVee's hand-drawn doodles have evolved into wonderful characters. The characters' poses and backgrounds bring the VeeFriends IP to life.
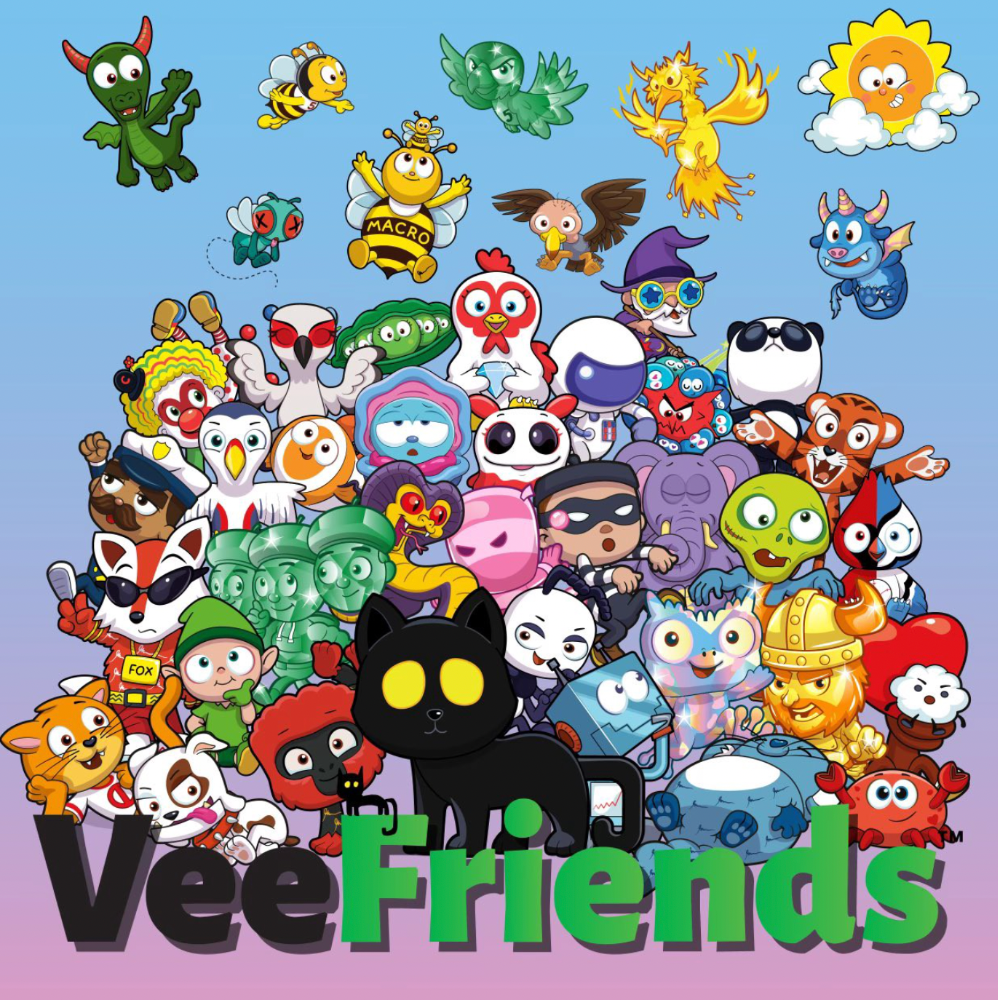
Yes, this is the second edition of VeeFriends, and at current prices, it's one of the best NFT opportunities in years. If you have the funds and risk appetite to invest in NFTs, VeeFriends Series 2 is worth every penny. Even if you can't invest, learn from their journey.
1. Art Is the Start
Many critics say VeeFriends artwork is below average and not by GaryVee. Art is often the key to future success.
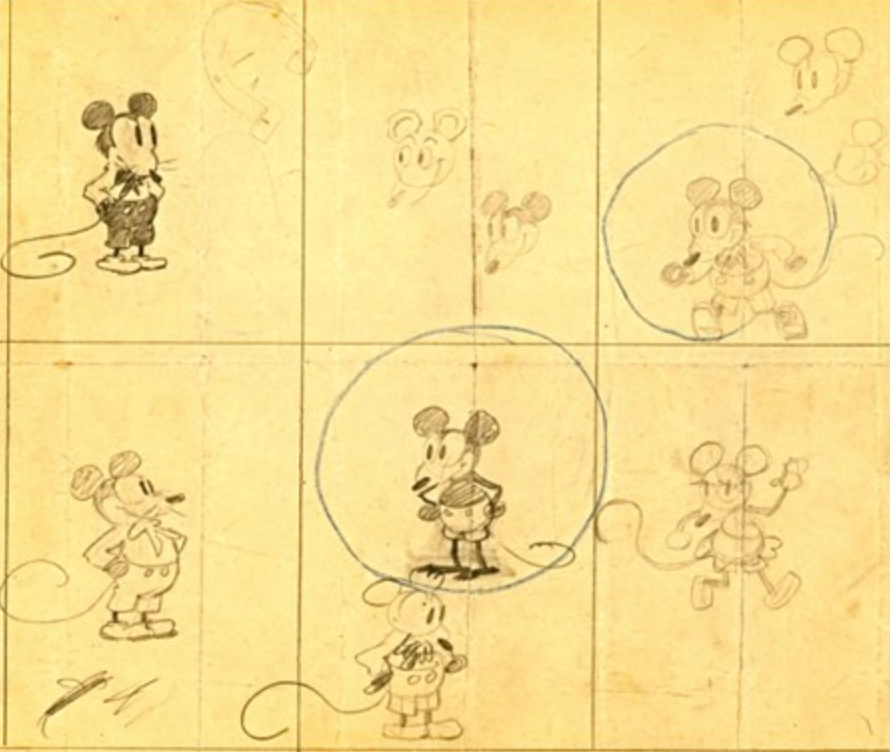
Let's look at one of the first Mickey Mouse drawings. No one would have guessed that this would become one of the most beloved animated short film characters. In Walt Before Mickey, Walt Disney's original mouse Mortimer was less refined.
First came a mouse...
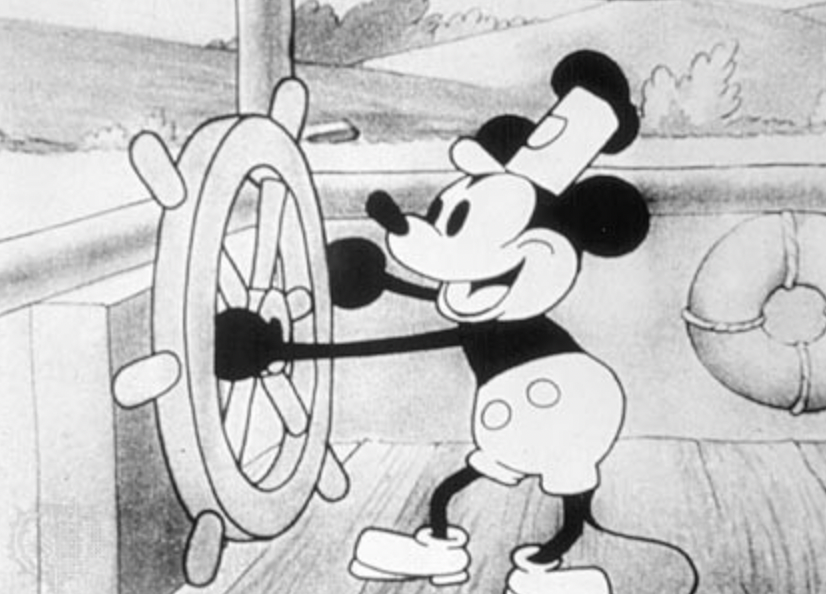
These sketches evolved into Steamboat Willie, Disney's first animated short film.
Fred Moore redesigned the character artwork into what we saw in cartoons as kids. Mickey Mouse's history is here.
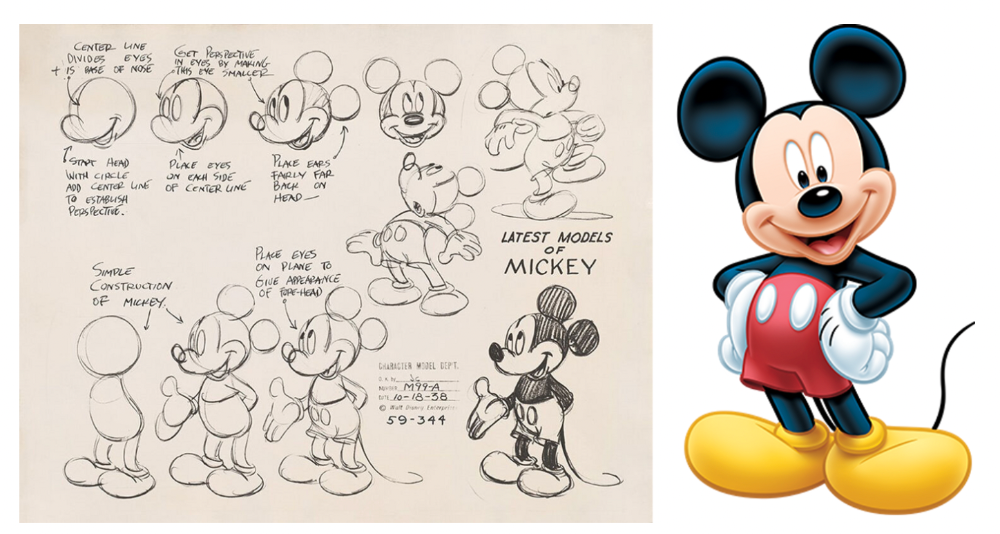
Looking at how different cartoon characters have evolved and gained popularity over decades, I believe Series 2 characters like Self-Aware Hare, Kind Kudu, and Patient Pig can do the same.
GaryVee captures this journey on the blockchain and lets early supporters become part of history. Time will tell if it rivals Disney, Pokemon, or Star Wars. Gary has been vocal about this vision.
2. VeeFriends is Intellectual Property for the Coming Generations
Most of us grew up watching cartoons, playing with toys, cards, and video games. Our interactions with fictional characters and the stories we hear shape us.
GaryVee is slowly curating an experience for the next generation with animated videos, card games, merchandise, toys, and more.
VeeFriends UNO, a collaboration with Mattel Creations, features 17 VeeFriends characters.
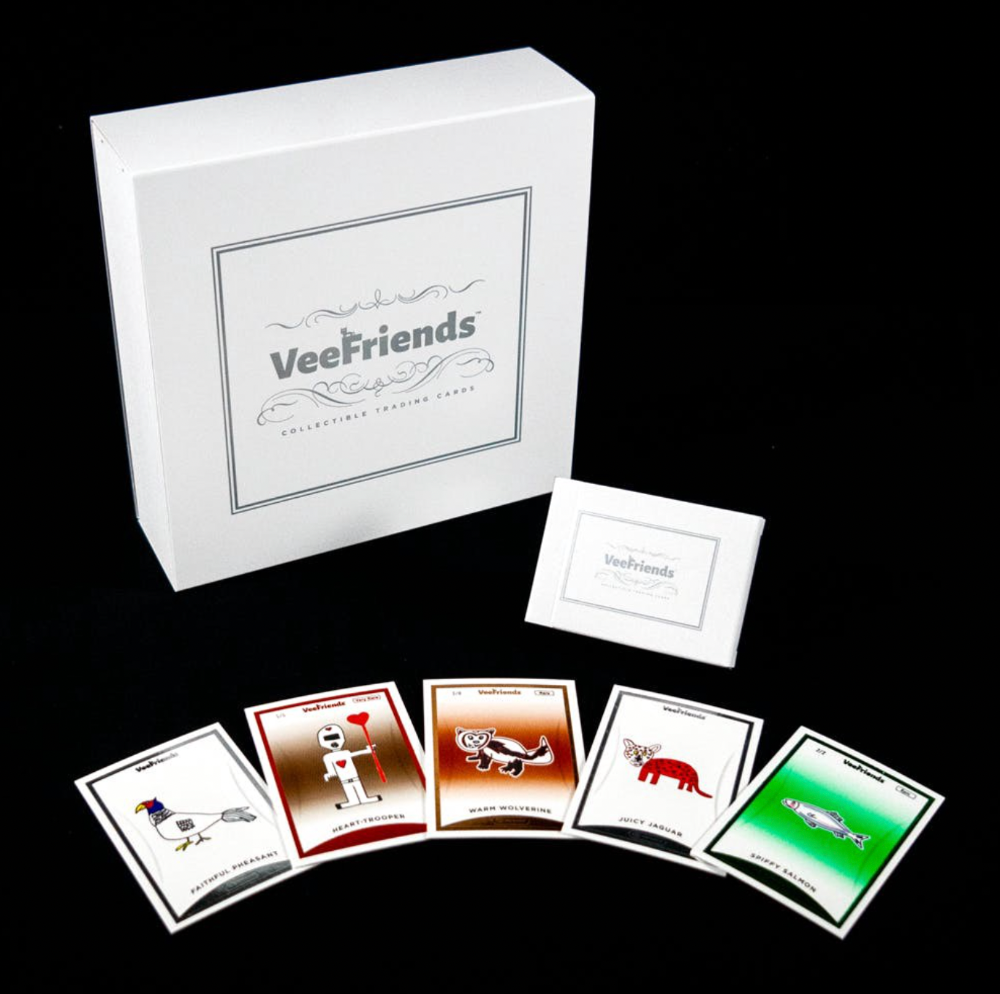
VeeFriends and Zerocool recently released Trading Cards featuring all 268 Series 1 characters and 15 new ones. Another way to build VeeFriends' collectibles brand.
At Veecon, all the characters were collectible toys. Something will soon emerge.
Kids and adults alike enjoy the YouTube channel's animated shorts and VeeFriends Tunes. Here's a song by the holder's Optimistic Otter-loving daughter.
This VeeFriends story is only the beginning. I'm looking forward to animated short film series, coloring books, streetwear, candy, toys, physical collectibles, and other forms of VeeFriends IP.
3. Veefriends will always provide utilities
Smart contracts can be updated at any time and authenticated on a ledger.
VeeFriends Series 2 gives no promise of any utility whatsoever. GaryVee released no project roadmap. In the first few months after launch, many owners of specific characters or scenes received utilities.
Every benefit or perk you receive helps promote the VeeFriends brand.
Recent partnerships are listed below.
MaryRuth's Multivitamin Gummies
Productive Puffin holders from VeeFriends x Primitive
Pickleball Scene & Clown Holders Only
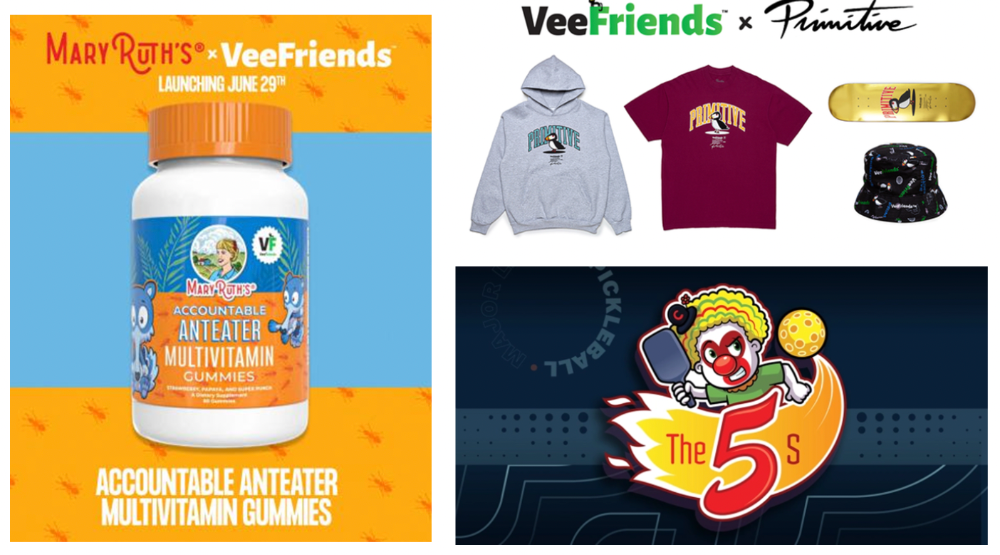
Pickleball & Competitive Clown Exclusive experience, anteater multivitamin gummies, and Puffin x Primitive merch
Considering the price of NFTs, it may not seem like much. It's just the beginning; you never know what the future holds. No other NFT project offers such diverse, ongoing benefits.
4. Garyvee's team is ready
Gary Vaynerchuk's team and record are undisputed. He's a serial entrepreneur and the Chairman & CEO of VaynerX, which includes VaynerMedia, VaynerCommerce, One37pm, and The Sasha Group.
Gary founded VaynerSports, Resy, and Empathy Wines. He's a Candy Digital Board Member, VCR Group Co-Founder, ArtOfficial Co-Founder, and VeeFriends Creator & CEO. Gary was recently named one of Fortune's Top 50 NFT Influencers.
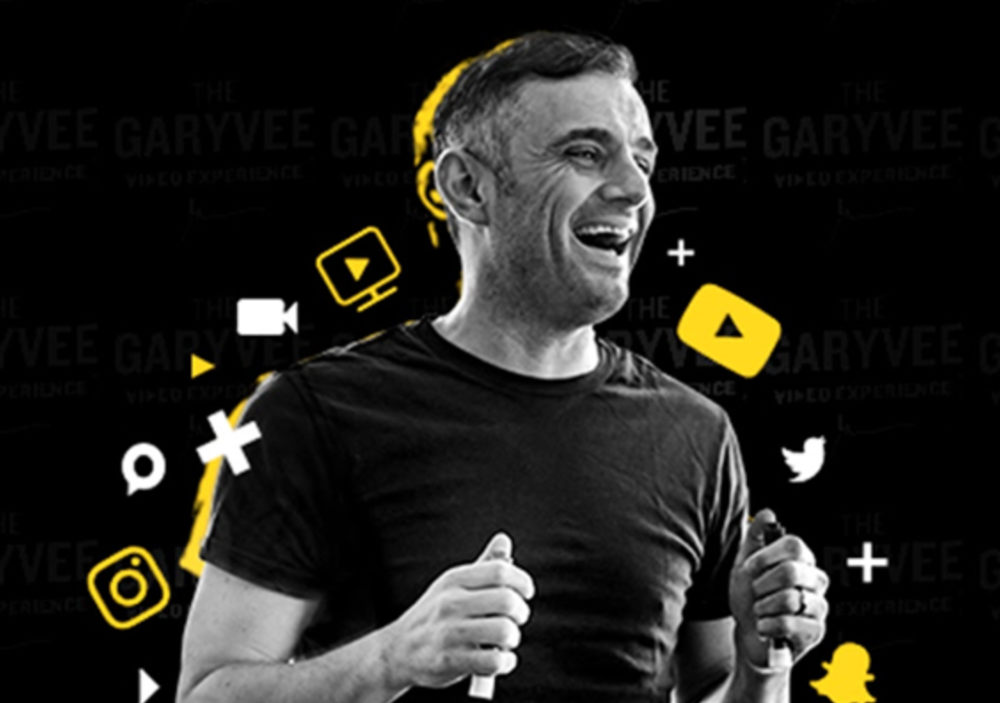
Gary Vayenerchuk aka GaryVee
Gary documents his daily life as a CEO on social media, which has 34 million followers and 272 million monthly views. GaryVee Audio Experience is a top podcast. He's a five-time New York Times best-seller and sought-after speaker.
Gary can observe consumer behavior to predict trends. He understood these trends early and pioneered them.
1997 — Realized e-potential commerce's and started winelibrary.com. In five years, he grew his father's wine business from $3M to $60M.
2006 — Realized content marketing's potential and started Wine Library on YouTube. TV
2009 — Estimated social media's potential (Web2) and invested in Facebook, Twitter, and Tumblr.
2014: Ethereum and Bitcoin investments
2021 — Believed in NFTs and Web3 enough to launch VeeFriends
GaryVee isn't all of VeeFriends. Andy Krainak, Dave DeRosa, Adam Ripps, Tyler Dowdle, and others work tirelessly to make VeeFriends a success.
GaryVee has said he'll let other businesses fail but not VeeFriends. We're just beginning his 40-year vision.
I have more confidence than ever in a company with a strong foundation and team.
5. Humans die, but characters live forever
What if GaryVee dies or can't work?
A writer's books can immortalize them. As long as their books exist, their words are immortal. Socrates, Hemingway, Aristotle, Twain, Fitzgerald, and others have become immortal.
Everyone knows Vincent Van Gogh's The Starry Night.
We all love reading and watching Peter Parker, Thor, or Jessica Jones. Their behavior inspires us. Stan Lee's message and stories live on despite his death.
GaryVee represents VeeFriends. Creating characters to communicate ensures that the message reaches even those who don't listen.
Gary wants his values and messages to be omnipresent in 268 characters. Messengers die, but their messages live on.
Gary envisions VeeFriends creating timeless stories and experiences. Ten years from now, maybe every kid will sing Patient Pig.
6. I love the intent.
Gary planned to create Workplace Warriors three years ago when he began designing Patient Panda, Accountable Ant, and Empathy elephant. The project stalled. When NFTs came along, he knew.
Gary wanted to create characters with traits he values, such as accountability, empathy, patience, kindness, and self-awareness. He wants future generations to find these traits cool. He hopes one or more of his characters will become pop culture icons.
These emotional skills aren't taught in schools or colleges, but they're crucial for business and life success. I love that someone is teaching this at scale.
In the end, intent matters.
Humans Are Collectors
Buy and collect things to communicate. Since the 1700s. Medieval people formed communities around hidden metals and stones. Many people still collect stamps and coins, and luxury and fashion are multi-trillion dollar industries. We're collectors.
The early 2020s NFTs will be remembered in the future. VeeFriends will define a cultural and technological shift in this era. VeeFriends Series 1 is the original hand-drawn art, but it's expensive. VeeFriends Series 2 is a once-in-a-lifetime opportunity at $1,000.
If you are new to NFTs, check out How to Buy a Non Fungible Token (NFT) For Beginners
This is a non-commercial article. Not financial or legal advice. Information isn't always accurate. Before making important financial decisions, consult a pro or do your own research.
This post is a summary. Read the full article here

Jess Rifkin
3 years ago
As the world watches the Russia-Ukraine border situation, This bill would bar aid to Ukraine until the Mexican border is secured.
Although Mexico and Ukraine are thousands of miles apart, this legislation would link their responses.
Context
Ukraine was a Soviet republic until 1991. A significant proportion of the population, particularly in the east, is ethnically Russian. In February, the Russian military invaded Ukraine, intent on overthrowing its democratically elected government.
This could be the biggest European land invasion since WWII. In response, President Joe Biden sent 3,000 troops to NATO countries bordering Ukraine to help with Ukrainian refugees, with more troops possible if the situation worsened.
In July 2021, the US Border Patrol reported its highest monthly encounter total since March 2000. Some Republicans compare Biden's response to the Mexican border situation to his response to the Ukrainian border situation, though the correlation is unclear.
What the bills do
Two new Republican bills seek to link the US response to Ukraine to the situation in Mexico.
The Secure America's Borders First Act would prohibit federal funding for Ukraine until the US-Mexico border is “operationally controlled,” including a wall as promised by former President Donald Trump. (The bill even mandates a 30-foot-high wall.)
The USB (Ukraine and Southern Border) Act, introduced on February 8 by Rep. Matt Rosendale (R-MT0), would allow the US to support Ukraine, but only if the number of Armed Forces deployed there is less than the number deployed to the Mexican border. Madison Cawthorne introduced H.R. 6665 on February 9th (R-NC11).
What backers say
Supporters argue that even if the US should militarily assist Ukraine, our own domestic border situation should take precedence.
After failing to secure our own border and protect our own territorial integrity, ‘America Last' politicians on both sides of the aisle now tell us that we must do so for Ukraine. “Before rushing America into another foreign conflict over an Eastern European nation's border thousands of miles from our shores, they should first secure our southern border.”
“If Joe Biden truly cared about Americans, he would prioritize national security over international affairs,” Rep. Cawthorn said in a separate press release. The least we can do to secure our own country is send the same number of troops to the US-Mexico border to assist our border patrol agents working diligently to secure America.
What opponents say
The president has defended his Ukraine and Mexico policies, stating that both seek peace and diplomacy.
Our nations [the US and Mexico] have a long and complicated history, and we haven't always been perfect neighbors, but we have seen the power and purpose of cooperation,” Biden said in 2021. “We're safer when we work together, whether it's to manage our shared border or stop the pandemic. [In both the Obama and Biden administration], we made a commitment that we look at Mexico as an equal, not as somebody who is south of our border.”
No mistake: If Russia goes ahead with its plans, it will be responsible for a catastrophic and unnecessary war of choice. To protect our collective security, the United States and our allies are ready to defend every inch of NATO territory. We won't send troops into Ukraine, but we will continue to support the Ukrainian people... But, I repeat, Russia can choose diplomacy. It is not too late to de-escalate and return to the negotiating table.”
Odds of passage
The Secure America's Borders First Act has nine Republican sponsors. Either the House Armed Services or Foreign Affairs Committees may vote on it.
Rep. Paul Gosar, a Republican, co-sponsored the USB Act (R-AZ4). The House Armed Services Committee may vote on it.
With Republicans in control, passage is unlikely.

Tim Denning
3 years ago
In this recession, according to Mark Cuban, you need to outwork everyone
Here’s why that’s baloney
Mark Cuban popularized entrepreneurship.
Shark Tank (which made Mark famous) made starting a business glamorous to attract more entrepreneurs. First off
This isn't an anti-billionaire rant.
Mark Cuban has done excellent. He's a smart, principled businessman. I enjoy his Web3 work. But Mark's work and productivity theories are absurd.
You don't need to outwork everyone in this recession to live well.
You won't be able to outwork me.
Yuck! Mark's words made me gag.
Why do boys think working is a football game where the winner wins a Super Bowl trophy? To outwork you.
Hard work doesn't equal intelligence.
Highly clever professionals spend 4 hours a day in a flow state, then go home to relax with family.
If you don't put forth the effort, someone else will.
- Mark.
He'll burn out. He's delusional and doesn't understand productivity. Boredom or disconnection spark our best thoughts.
TikTok outlaws boredom.
In a spare minute, we check our phones because we can't stand stillness.
All this work p*rn makes things worse. When is it okay to feel again? Because I can’t feel anything when I’m drowning in work and haven’t had a holiday in 2 years.
Your rivals are actively attempting to undermine you.
Ohhh please Mark…seriously.
This isn't a Tom Hanks war film. Relax. Not everyone is a rival. Only yourself is your competitor. To survive the recession, be better than a year ago.
If you get rich, great. If not, there's more to life than Lambos and angel investments.
Some want to relax and enjoy life. No competition. We witness people with lives trying to endure the recession and record-high prices.
This fictitious rival worsens life and work.

If you are truly talented, you will motivate others to work more diligently and effectively.
No Mark. Soz.
If you're a good leader, you won't brag about working hard and treating others like cogs. Treat them like humans. You'll have EQ.
Silly statements like this are caused by an out-of-control ego. No longer watch Shark Tank.
Ego over humanity.
Good leaders will urge people to keep together during the recession. Good leaders support those who are laid off and need a reference.
Not harder, quicker, better. That created my mental health problems 10 years ago.
Truth: we want to work less.
The promotion of entrepreneurship is ludicrous.
Marvel superheroes. Seriously, relax Max.
I used to write about entrepreneurship, then I quit. Many WeWork Adam Neumanns. Carelessness.
I now utilize the side hustle title when writing about online company or entrepreneurship. Humanizes.
Stop glorifying. Thinking we'll all be Elon Musks who send rockets to Mars is delusional. Most of us won't create companies employing hundreds.
OK.
The true epidemic is glorification. fewer selfies Little birdy needs less bank account screenshots. Less Uber talk.
We're exhausted.
Fun, ego-free business can transform the world. Take a relax pill.
Work as if someone were attempting to take everything from you.
I've seen people lose everything.
Myself included. My 20s startup failed. I was almost bankrupt. I thought I'd never recover. Nope.
Best thing ever.
Losing everything reveals your true self. Unintelligent entrepreneur egos perish instantly. Regaining humility revitalizes relationships.
Money's significance shifts. Stop chasing it like a puppy with a bone.
Fearing loss is unfounded.
Here is a more effective approach than outworking nobody.
(You'll thrive in the recession and become wealthy.)
Smarter work
Overworking is donkey work.
You don't want to be a career-long overworker. Instead than wasting time, write down what you do. List tasks and processes.
Keep doing/outsource the list. Step-by-step each task. Continuously systematize.
Then recruit a digital employee like Zapier or a virtual assistant in the same country.
Intelligent, not difficult.
If your big break could burn in hell, diversify like it will.
People err by focusing on one chance.
Chances can vanish. All-in risky. Instead of working like a Mark Cuban groupie, diversify your income.
If you're employed, your customer is your employer.
Sell the same abilities twice and add 2-3 contract clients. Reduce your hours at your main job and take on more clients.
Leave brand loyalty behind
Mark desires his employees' worship.
That's stupid. When times are bad, layoffs multiply. The problem is the false belief that companies care. No. A business maximizes profit and pays you the least.
To care or overpay is anti-capitalist (that run the world). Be honest.
I was a banker. Then the bat virus hit and jobs disappeared faster than I urinate after a night of drinking.
Start being disloyal now since your company will cheerfully replace you with a better applicant. Meet recruiters and hiring managers on LinkedIn. Whenever something goes wrong at work, act.
Loyalty to self and family. Nobody.
Outwork this instead
Mark doesn't suggest outworking inflation instead of people.
Inflation erodes your time on earth. If you ignore inflation, you'll work harder for less pay every minute.
Financial literacy beats inflation.
Get a side job and earn money online
So you can stop outworking everyone.
Internet leverages time. Same effort today yields exponential results later. There are still whole places not online.
Instead of working forever, generate money online.
Final Words
Overworking is stupid. Don't listen to wealthy football jocks.
Work isn't everything. Prioritize diversification, internet income streams, boredom, and financial knowledge throughout the recession.
That’s how to get wealthy rather than burnout-rich.