


How to Use Obsidian to Boost Research Productivity
Tools for managing your PhD projects, reading lists, notes, and inspiration.
As a researcher, you have to know everything. But knowledge is useless if it cannot be accessed quickly. An easy-to-use method of archiving information makes taking notes effortless and enjoyable.
As a PhD student in Artificial Intelligence, I use Obsidian (https://obsidian.md) to manage my knowledge.
The article has three parts:
- What is a note, how to organize notes, tags, folders, and links? This section is tool-agnostic, so you can use most of these ideas with any note-taking app.
- Instructions for using Obsidian, managing notes, reading lists, and useful plugins. This section demonstrates how I use Obsidian, my preferred knowledge management tool.
- Workflows: How to use Zotero to take notes from papers, manage multiple projects' notes, create MOCs with Dataview, and more. This section explains how to use Obsidian to solve common scientific problems and manage/maintain your knowledge effectively.
This list is not perfect or complete, but it is my current solution to problems I've encountered during my PhD. Please leave additional comments or contact me if you have any feedback. I'll try to update this article.
Throughout the article, I'll refer to your digital library as your "Obsidian Vault" or "Zettelkasten".
Other useful resources are listed at the end of the article.
1. Philosophy: Taking and organizing notes
Carl Sagan: “To make an apple pie from scratch, you must first create the universe.”
Before diving into Obsidian, let's establish a Personal Knowledge Management System and a Zettelkasten. You can skip to Section 2 if you already know these terms.
Niklas Luhmann, a prolific sociologist who wrote 400 papers and 70 books, inspired this section and much of Zettelkasten. Zettelkasten means “slip box” (or library in this article). His Zettlekasten had around 90000 physical notes, which can be found here.
There are now many tools available to help with this process. Obsidian's website has a good introduction section: https://publish.obsidian.md/hub/
Notes
We'll start with "What is a note?" Although it may seem trivial, the answer depends on the topic or your note-taking style. The idea is that a note is as “atomic” (i.e. You should read the note and get the idea right away.
The resolution of your notes depends on their detail. Deep Learning, for example, could be a general description of Neural Networks, with a few notes on the various architectures (eg. Recurrent Neural Networks, Convolutional Neural Networks etc..).
Limiting length and detail is a good rule of thumb. If you need more detail in a specific section of this note, break it up into smaller notes. Deep Learning now has three notes:
- Deep Learning
- Recurrent Neural Networks
- Convolutional Neural Networks
Repeat this step as needed until you achieve the desired granularity. You might want to put these notes in a “Neural Networks” folder because they are all about the same thing. But there's a better way:
#Tags and [[Links]] over /Folders/
The main issue with folders is that they are not flexible and assume that all notes in the folder belong to a single category. This makes it difficult to make connections between topics.
Deep Learning has been used to predict protein structure (AlphaFold) and classify images (ImageNet). Imagine a folder structure like this:
- /Proteins/
- Protein Folding
- /Deep Learning/
- /Proteins/
Your notes about Protein Folding and Convolutional Neural Networks will be separate, and you won't be able to find them in the same folder.
This can be solved in several ways. The most common one is to use tags rather than folders. A note can be grouped with multiple topics this way. Obsidian tags can also be nested (have subtags).
You can also link two notes together. You can build your “Knowledge Graph” in Obsidian and other note-taking apps like Obsidian.
My Knowledge Graph. Green: Biology, Red: Machine Learning, Yellow: Autoencoders, Blue: Graphs, Brown: Tags.
My Knowledge Graph and the note “Backrpropagation” and its links.
Backpropagation note and all its links
Why use Folders?
Folders help organize your vault as it grows. The main suggestion is to have few folders that "weakly" collect groups of notes or better yet, notes from different sources.
Among my Zettelkasten folders are:
My Zettelkasten's 5 folders
They usually gather data from various sources:
MOC: Map of Contents for the Zettelkasten.
Projects: Contains one note for each side-project of my PhD where I log my progress and ideas. Notes are linked to these.
Bio and ML: These two are the main content of my Zettelkasten and could theoretically be combined.
Papers: All my scientific paper notes go here. A bibliography links the notes. Zotero .bib file
Books: I make a note for each book I read, which I then split into multiple notes.
Keeping images separate from other files can help keep your main folders clean.
I will elaborate on these in the Workflow Section.
My general recommendation is to use tags and links instead of folders.
Maps of Content (MOC)
Making Tables of Contents is a good solution (MOCs).
These are notes that "signposts" your Zettelkasten library, directing you to the right type of notes. It can link to other notes based on common tags. This is usually done with a title, then your notes related to that title. As an example:
An example of a Machine Learning MOC generated with Dataview.
As shown above, my Machine Learning MOC begins with the basics. Then it's on to Variational Auto-Encoders. Not only does this save time, but it also saves scrolling through the tag search section.
So I keep MOCs at the top of my library so I can quickly find information and see my library. These MOCs are generated automatically using an Obsidian Plugin called Dataview (https://github.com/blacksmithgu/obsidian-dataview).
Ideally, MOCs could be expanded to include more information about the notes, their status, and what's left to do. In the absence of this, Dataview does a fantastic job at creating a good structure for your notes.
In the absence of this, Dataview does a fantastic job at creating a good structure for your notes.
2. Tools: Knowing Obsidian
Obsidian is my preferred tool because it is free, all notes are stored in Markdown format, and each panel can be dragged and dropped. You can get it here: https://obsidian.md/
Obsidian interface.
Obsidian is highly customizable, so here is my preferred interface:
The theme is customized from https://github.com/colineckert/obsidian-things
Alternatively, each panel can be collapsed, moved, or removed as desired. To open a panel later, click on the vertical "..." (bottom left of the note panel).
My interface is organized as follows:
How my Obsidian Interface is organized.
Folders/Search:
This is where I keep all relevant folders. I usually use the MOC note to navigate, but sometimes I use the search button to find a note.
Tags:
I use nested tags and look into each one to find specific notes to link.
cMenu:
Easy-to-use menu plugin cMenu (https://github.com/chetachiezikeuzor/cMenu-Plugin)
Global Graph:
The global graph shows all your notes (linked and unlinked). Linked notes will appear closer together. Zoom in to read each note's title. It's a bit overwhelming at first, but as your library grows, you get used to the positions and start thinking of new connections between notes.
Local Graph:
Your current note will be shown in relation to other linked notes in your library. When needed, you can quickly jump to another link and back to the current note.
Links:
Finally, an outline panel and the plugin Obsidian Power Search (https://github.com/aviral-batra/obsidian-power-search) allow me to search my vault by highlighting text.
Start using the tool and worry about panel positioning later. I encourage you to find the best use-case for your library.
Plugins
An additional benefit of using Obsidian is the large plugin library. I use several (Calendar, Citations, Dataview, Templater, Admonition):
Obsidian Calendar Plugin: https://github.com/liamcain
It organizes your notes on a calendar. This is ideal for meeting notes or keeping a journal.
Calendar addon from hans/obsidian-citation-plugin
Obsidian Citation Plugin: https://github.com/hans/
Allows you to cite papers from a.bib file. You can also customize your notes (eg. Title, Authors, Abstract etc..)
Plugin citation from hans/obsidian-citation-plugin
Obsidian Dataview: https://github.com/blacksmithgu/
A powerful plugin that allows you to query your library as a database and generate content automatically. See the MOC section for an example.
Allows you to create notes with specific templates like dates, tags, and headings.
Templater. Obsidian Admonition: https://github.com/valentine195/obsidian-admonition
Blocks allow you to organize your notes.
Plugin warning. Obsidian Admonition (valentine195)
There are many more, but this list should get you started.
3. Workflows: Cool stuff
Here are a few of my workflows for using obsidian for scientific research. This is a list of resources I've found useful for my use-cases. I'll outline and describe them briefly so you can skim them quickly.
3.1 Using Templates to Structure Notes
3.2 Free Note Syncing (Laptop, Phone, Tablet)
3.3 Zotero/Mendeley/JabRef -> Obsidian — Managing Reading Lists
3.4 Projects and Lab Books
3.5 Private Encrypted Diary
3.1 Using Templates to Structure Notes
Plugins: Templater and Dataview (optional).
To take effective notes, you must first make adding new notes as easy as possible. Templates can save you time and give your notes a consistent structure. As an example:
An example of a note using a template.
### [[YOUR MOC]]
# Note Title of your note
**Tags**::
**Links**::
The top line links to your knowledge base's Map of Content (MOC) (see previous sections). After the title, I add tags (and a link between the note and the tag) and links to related notes.
To quickly identify all notes that need to be expanded, I add the tag “#todo”. In the “TODO:” section, I list the tasks within the note.
The rest are notes on the topic.
Templater can help you create these templates. For new books, I use the following template:
### [[Books MOC]]
# Title
**Author**::
**Date::
**Tags::
**Links::
A book template example.
Using a simple query, I can hook Dataview to it.
dataview
table author as Author, date as “Date Finished”, tags as “Tags”, grade as “Grade”
from “4. Books”
SORT grade DESCENDING
using Dataview to query templates.
3.2 Free Note Syncing (Laptop, Phone, Tablet)
No plugins used.
One of my favorite features of Obsidian is the library's self-contained and portable format. Your folder contains everything (plugins included).
Ordinary folders and documents are available as well. There is also a “.obsidian” folder. This contains all your plugins and settings, so you can use it on other devices.
So you can use Google Drive, iCloud, or Dropbox for free as long as you sync your folder (note: your folder should be in your Cloud Folder).
For my iOS and macOS work, I prefer iCloud. You can also use the paid service Obsidian Sync.
3.3 Obsidian — Managing Reading Lists and Notes in Zotero/Mendeley/JabRef
Plugins: Quotes (required).
3.3 Zotero/Mendeley/JabRef -> Obsidian — Taking Notes and Managing Reading Lists of Scientific Papers
My preferred reference manager is Zotero, but this workflow should work with any reference manager that produces a .bib file. This file is exported to my cloud folder so I can access it from any platform.
My Zotero library is tagged as follows:
My reference manager's tags
For readings, I usually search for the tags “!!!” and “To-Read” and select a paper. Annotate the paper next (either on PDF using GoodNotes or on physical paper).
Then I make a paper page using a template in the Citations plugin settings:
An example of my citations template.
Create a new note, open the command list with CMD/CTRL + P, and find the Citations “Insert literature note content in the current pane” to see this lovely view.
Citation generated by the article https://doi.org/10.1101/2022.01.24.22269144
You can then convert your notes to digital. I found that transcribing helped me retain information better.
3.4 Projects and Lab Books
Plugins: Tweaker (required).
PhD students offering advice on thesis writing are common (read as regret). I started asking them what they would have done differently or earlier.
“Deep stuff Leo,” one person said. So my main issue is basic organization, losing track of my tasks and the reasons for them.
As a result, I'd go on other experiments that didn't make sense, and have to reverse engineer my logic for thesis writing. - PhD student now wise Postdoc
Time management requires planning. Keeping track of multiple projects and lab books is difficult during a PhD. How I deal with it:
- One folder for all my projects
- One file for each project
I use a template to create each project
### [[Projects MOC]]
# <% tp.file.title %>
**Tags**::
**Links**::
**URL**::
**Project Description**::## Notes:
### <% tp.file.last_modified_date(“dddd Do MMMM YYYY”) %>
#### Done:
#### TODO:
#### Notes
You can insert a template into a new note with CMD + P and looking for the Templater option.
I then keep adding new days with another template:
### <% tp.file.last_modified_date("dddd Do MMMM YYYY") %>
#### Done:
#### TODO:
#### Notes:
This way you can keep adding days to your project and update with reasonings and things you still have to do and have done. An example below:
Example of project note with timestamped notes.
3.5 Private Encrypted Diary
This is one of my favorite Obsidian uses.
Mini Diary's interface has long frustrated me. After the author archived the project, I looked for a replacement. I had two demands:
- It had to be private, and nobody had to be able to read the entries.
- Cloud syncing was required for editing on multiple devices.
Then I learned about encrypting the Obsidian folder. Then decrypt and open the folder with Obsidian. Sync the folder as usual.
Use CryptoMator (https://cryptomator.org/). Create an encrypted folder in Cryptomator for your Obsidian vault, set a password, and let it do the rest.
If you need a step-by-step video guide, here it is:
Conclusion
So, I hope this was helpful!
In the first section of the article, we discussed notes and note-taking techniques. We discussed when to use tags and links over folders and when to break up larger notes.
Then we learned about Obsidian, its interface, and some useful plugins like Citations for citing papers and Templater for creating note templates.
Finally, we discussed workflows and how to use Zotero to take notes from scientific papers, as well as managing Lab Books and Private Encrypted Diaries.
Thanks for reading and commenting :)
Read original post here
More on Productivity

Jano le Roux
3 years ago
My Top 11 Tools For Building A Modern Startup, With A Free Plan
The best free tools are probably unknown to you.
Modern startups are easy to build.
Start with free tools.
Let’s go.
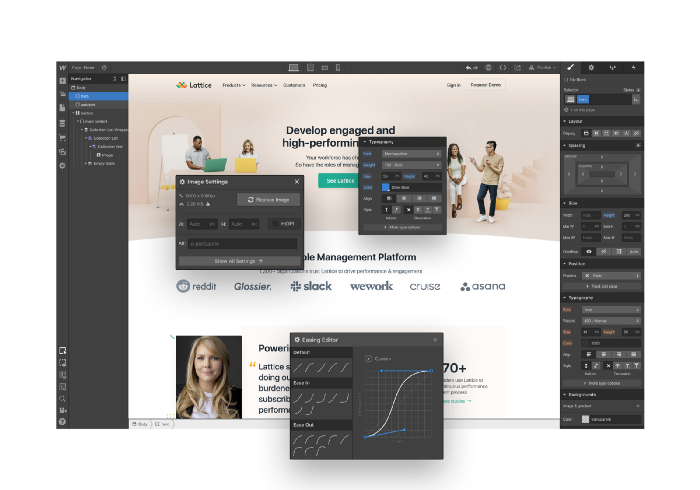
Web development — Webflow
Code-free HTML, CSS, and JS.
Webflow isn't like Squarespace, Wix, or Shopify.
It's a super-fast no-code tool for professionals to construct complex, highly-responsive websites and landing pages.
Webflow can help you add animations like those on Apple's website to your own site.
I made the jump from WordPress a few years ago and it changed my life.
No damn plugins. No damn errors. No damn updates.
The best, you can get started on Webflow for free.
Data tracking — Airtable
Spreadsheet wings.
Airtable combines spreadsheet flexibility with database power without code.
Airtable is modern.
Airtable has modularity.
Scaling Airtable is simple.
Airtable, one of the most adaptable solutions on this list, is perfect for client data management.
Clients choose customized service packages. Airtable consolidates data so you can automate procedures like invoice management and focus on your strengths.
Airtable connects with so many tools that rarely creates headaches. Airtable scales when you do.
Airtable's flexibility makes it a potential backend database.
Design — Figma
Better, faster, easier user interface design.
Figma rocks!
It’s fast.
It's free.
It's adaptable
First, design in Figma.
Iterate.
Export development assets.
Figma lets you add more team members as your company grows to work on each iteration simultaneously.
Figma is web-based, so you don't need a powerful PC or Mac to start.
Task management — Trello
Unclock jobs.
Tacky and terrifying task management products abound. Trello isn’t.
Those that follow Marie Kondo will appreciate Trello.
Everything is clean.
Nothing is complicated.
Everything has a place.
Compared to other task management solutions, Trello is limited. And that’s good. Too many buttons lead to too many decisions lead to too many hours wasted.
Trello is a must for teamwork.
Domain email — Zoho
Free domain email hosting.
Professional email is essential for startups. People relied on monthly payments for too long. Nope.
Zoho offers 5 free professional emails.
It doesn't have Google's UI, but it works.
VPN — Proton VPN
Fast Swiss VPN protects your data and privacy.
Proton VPN is secure.
Proton doesn't record any data.
Proton is based in Switzerland.
Swiss privacy regulation is among the most strict in the world, therefore user data are protected. Switzerland isn't a 14 eye country.
Journalists and activists trust Proton to secure their identities while accessing and sharing information authoritarian governments don't want them to access.
Web host — Netlify
Free fast web hosting.
Netlify is a scalable platform that combines your favorite tools and APIs to develop high-performance sites, stores, and apps through GitHub.
Serverless functions and environment variables preserve API keys.
Netlify's free tier is unmissable.
100GB of free monthly bandwidth.
Free 125k serverless operations per website each month.
Database — MongoDB
Create a fast, scalable database.
MongoDB is for small and large databases. It's a fast and inexpensive database.
Free for the first million reads.
Then, for each million reads, you must pay $0.10.
MongoDB's free plan has:
Encryption from end to end
Continual authentication
field-level client-side encryption
If you have a large database, you can easily connect MongoDB to Webflow to bypass CMS limits.
Automation — Zapier
Time-saving tip: automate repetitive chores.
Zapier simplifies life.
Zapier syncs and connects your favorite apps to do impossibly awesome things.
If your online store is connected to Zapier, a customer's purchase can trigger a number of automated actions, such as:
The customer is being added to an email chain.
Put the information in your Airtable.
Send a pre-programmed postcard to the customer.
Alexa, set the color of your smart lights to purple.
Zapier scales when you do.
Email & SMS marketing — Omnisend
Email and SMS marketing campaigns.
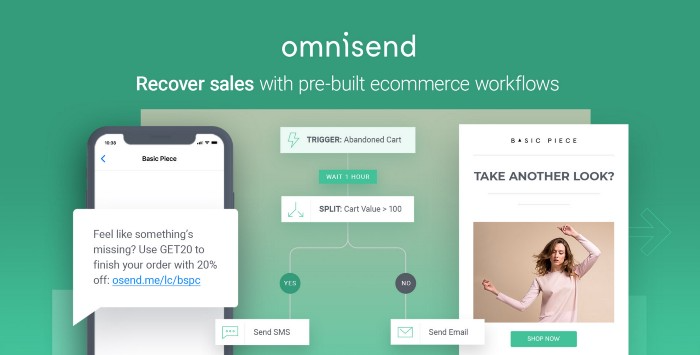
This is an excellent Mailchimp option for magical emails. Omnisend's processes simplify email automation.
I love the interface's cleanliness.
Omnisend's free tier includes web push notifications.
Send up to:
500 emails per month
60 maximum SMSs
500 Web Push Maximum
Forms and surveys — Tally
Create flexible forms that people enjoy.
Typeform is clean but restricting. Sometimes you need to add many questions. Tally's needed sometimes.
Tally is flexible and cheaper than Typeform.
99% of Tally's features are free and unrestricted, including:
Unlimited forms
Countless submissions
Collect payments
File upload
Tally lets you examine what individuals contributed to forms before submitting them to see where they get stuck.
Airtable and Zapier connectors automate things further. If you pay, you can apply custom CSS to fit your brand.
See.
Free tools are the greatest.
Let's use them to launch a startup.

David G Chen
3 years ago
If you want to earn money, stop writing for entertainment.
When you stop blogging for a few weeks, your views and profits plummet.
Because you're writing fascinating posts for others. Everyone's done ithat…
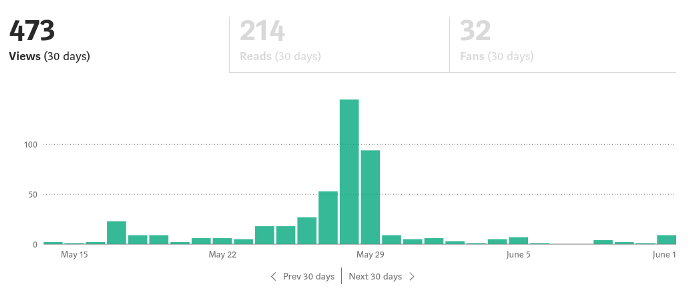
If I keep writing, the graph should maintain velocity, you could say. If I wrote more, it could rise.
However, entertaining pieces still tend to roller coaster and jump.
this type of writing is like a candle. They burn out and must be replaced. You must continuously light new ones to maintain the illumination.
When you quit writing, your income stops.
A substitute
Instead of producing amusing articles, try solving people's issues. You should answer their search questions.
Here's what happens when you answer their searches.
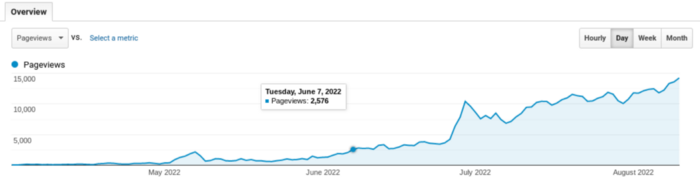
My website's Google analytics. As a dentist, I answer oral health questions.
This chart vs. Medium is pretty glaring, right?
As of yesterday, it was averaging 15k page views each day.
How much would you make on Medium with 15k daily views?
Evergreen materials
In SEO, this is called evergreen content.
Your content is like a lush, evergreen forest, and by green I mean Benjamins.
Do you have knowledge that you can leverage? Why not help your neighbors and the world?
Answer search inquiries and help others. You'll be well rewarded.
This is better than crafting candle-like content that fizzles out quickly.
Is beauty really ephemeral like how flowers bloom? Nah, I prefer watching forests grow instead (:

wordsmithwriter
3 years ago
2023 Will Be the Year of Evernote and Craft Notetaking Apps.
Note-taking is a vital skill. But it's mostly learned.

Recently, innovative note-taking apps have flooded the market.
In the next few years, Evernote and Craft will be important digital note-taking companies.
Evernote is a 2008 note-taking program. It can capture ideas, track tasks, and organize information on numerous platforms.
It's one of the only note-taking app that lets users input text, audio, photos, and videos. It's great for collecting research notes, brainstorming, and remaining organized.
Craft is a popular note-taking app.
Craft is a more concentrated note-taking application than Evernote. It organizes notes into subjects, tags, and relationships, making it ideal for technical or research notes.
Craft's search engine makes it easy to find what you need.
Both Evernote and Craft are likely to be the major players in digital note-taking in the years to come.
Their concentration on gathering and organizing information lets users generate notes quickly and simply. Multimedia elements and a strong search engine make them the note-taking apps of the future.
Evernote and Craft are great note-taking tools for staying organized and tracking ideas and projects.
With their focus on acquiring and organizing information, they'll dominate digital note-taking in 2023.
Pros
Concentrate on gathering and compiling information
special features including a strong search engine and multimedia components
Possibility of subject, tag, and relationship structuring
enables users to incorporate multimedia elements
Excellent tool for maintaining organization, arranging research notes, and brainstorming
Cons
Software may be difficult for folks who are not tech-savvy to utilize.
Limited assistance for hardware running an outdated operating system
Subscriptions could be pricey.
Data loss risk because of security issues
Evernote and Craft both have downsides.
The risk of data loss as a result of security flaws and software defects comes first.
Additionally, their subscription fees could be high, and they might restrict support for hardware that isn't running the newest operating systems.
Finally, folks who need to be tech-savvy may find the software difficult.
Evernote versus. Productivity Titans Evernote will make Notion more useful. medium.com
You might also like

Yogesh Rawal
3 years ago
Blockchain to solve growing privacy challenges
Most online activity is now public. Businesses collect, store, and use our personal data to improve sales and services.
In 2014, Uber executives and employees were accused of spying on customers using tools like maps. Another incident raised concerns about the use of ‘FaceApp'. The app was created by a small Russian company, and the photos can be used in unexpected ways. The Cambridge Analytica scandal exposed serious privacy issues. The whole incident raised questions about how governments and businesses should handle data. Modern technologies and practices also make it easier to link data to people.
As a result, governments and regulators have taken steps to protect user data. The General Data Protection Regulation (GDPR) was introduced by the EU to address data privacy issues. The law governs how businesses collect and process user data. The Data Protection Bill in India and the General Data Protection Law in Brazil are similar.
Despite the impact these regulations have made on data practices, a lot of distance is yet to cover.
Blockchain's solution
Blockchain may be able to address growing data privacy concerns. The technology protects our personal data by providing security and anonymity. The blockchain uses random strings of numbers called public and private keys to maintain privacy. These keys allow a person to be identified without revealing their identity. Blockchain may be able to ensure data privacy and security in this way. Let's dig deeper.
Financial transactions
Online payments require third-party services like PayPal or Google Pay. Using blockchain can eliminate the need to trust third parties. Users can send payments between peers using their public and private keys without providing personal information to a third-party application. Blockchain will also secure financial data.
Healthcare data
Blockchain technology can give patients more control over their data. There are benefits to doing so. Once the data is recorded on the ledger, patients can keep it secure and only allow authorized access. They can also only give the healthcare provider part of the information needed.
The major challenge
We tried to figure out how blockchain could help solve the growing data privacy issues. However, using blockchain to address privacy concerns has significant drawbacks. Blockchain is not designed for data privacy. A ‘distributed' ledger will be used to store the data. Another issue is the immutability of blockchain. Data entered into the ledger cannot be changed or deleted. It will be impossible to remove personal data from the ledger even if desired.
MIT's Enigma Project aims to solve this. Enigma's ‘Secret Network' allows nodes to process data without seeing it. Decentralized applications can use Secret Network to use encrypted data without revealing it.
Another startup, Oasis Labs, uses blockchain to address data privacy issues. They are working on a system that will allow businesses to protect their customers' data.
Conclusion
Blockchain technology is already being used. Several governments use blockchain to eliminate centralized servers and improve data security. In this information age, it is vital to safeguard our data. How blockchain can help us in this matter is still unknown as the world explores the technology.

Jon Brosio
3 years ago
This Landing Page is a (Legal) Money-Printing Machine
and it’s easy to build.
A landing page with good copy is a money-maker.
Let's be honest, page-builder templates are garbage.
They can help you create a nice-looking landing page, but not persuasive writing.
Over the previous 90 days, I've examined 200+ landing pages.
What's crazy?
Top digital entrepreneurs use a 7-part strategy to bring in email subscribers, generate prospects, and (passively) sell their digital courses.
Steal this 7-part landing page architecture to maximize digital product sales.
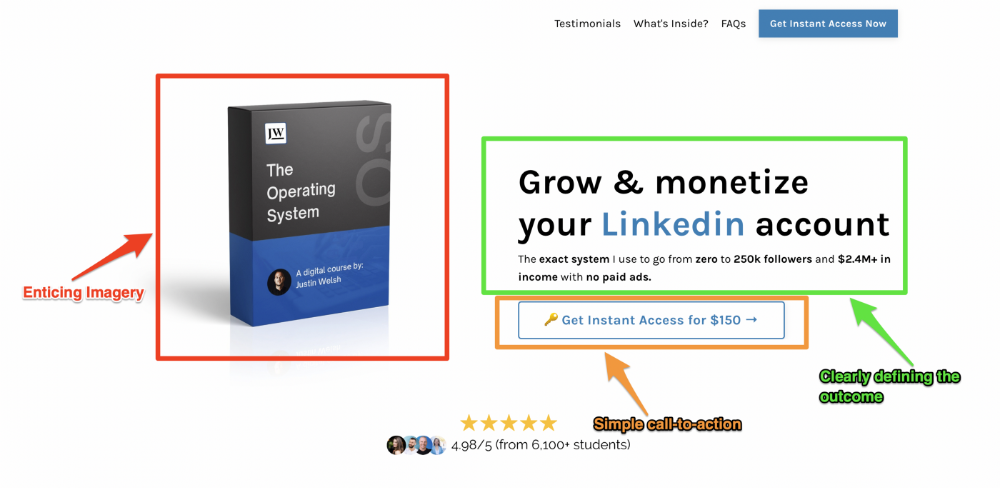
The offer
Landing pages require offers.
Newsletter, cohort, or course offer.
Your reader should see this offer first. Includind:
Headline
Imagery
Call-to-action
Clear, persuasive, and simplicity are key. Example: the Linkedin OS course home page of digital entrepreneur Justin Welsh offers:
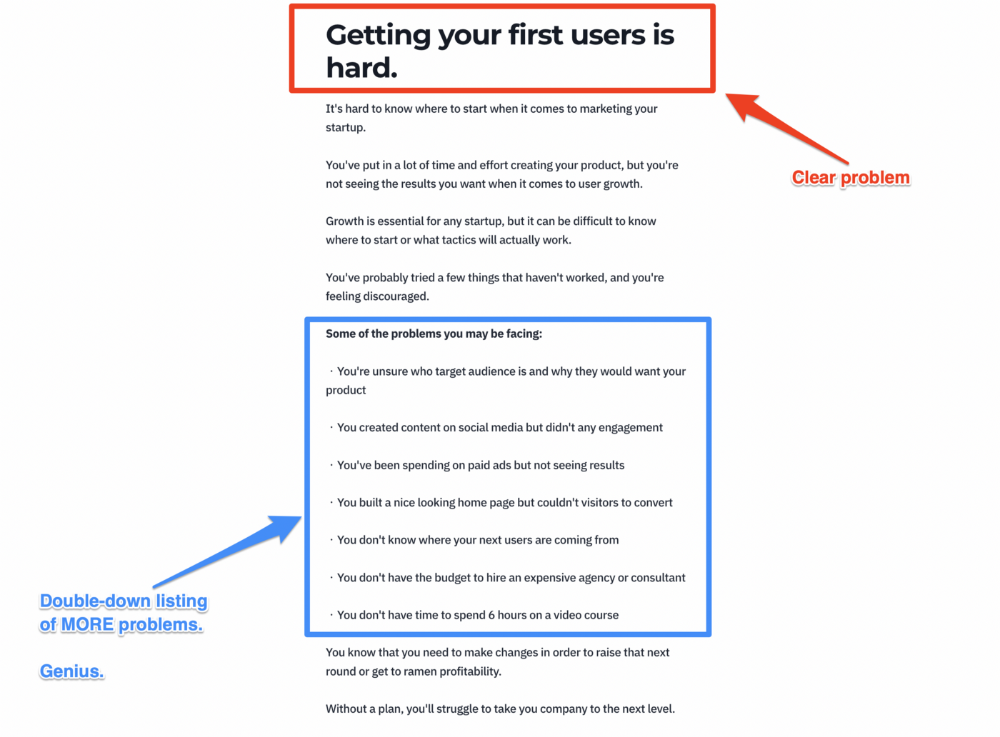
A distinctly defined problem
Everyone needs an enemy.
You need an opponent on your landing page. Problematic.
Next, employ psychology to create a struggle in your visitor's thoughts.
Don't be clever here; label your customer's problem. The more particular you are, the bigger the situation will seem.
When you build a clear monster, you invite defeat. I appreciate Theo Ohene's Growth Roadmaps landing page.
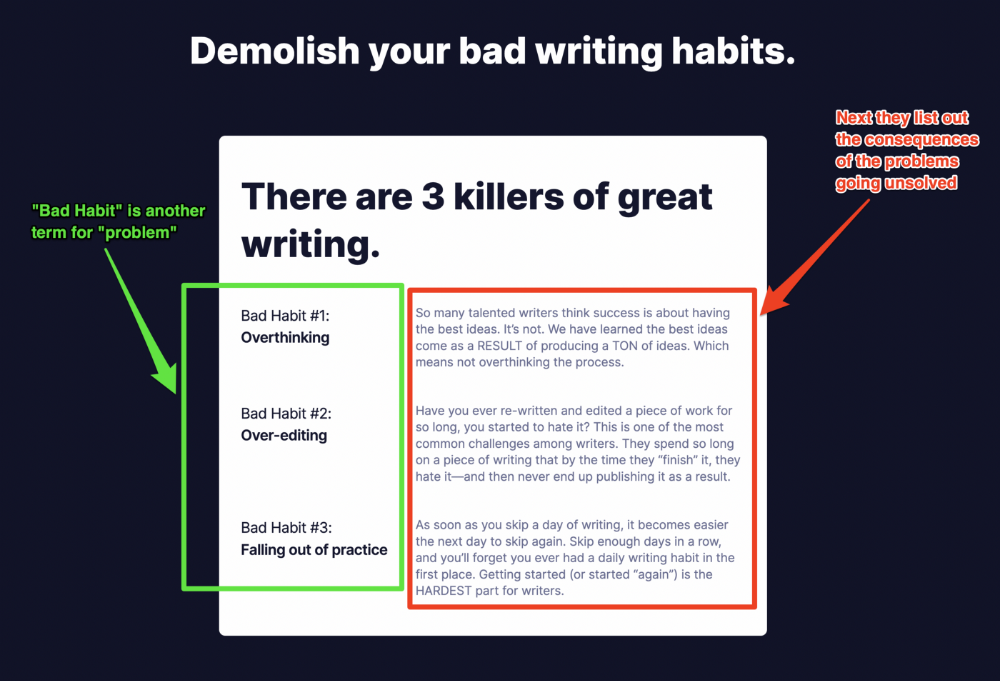
Exacerbation of the effects
Problem identification doesn't motivate action.
What would an unresolved problem mean?
This is landing page copy. When you describe the unsolved problem's repercussions, you accomplish several things:
You write a narrative (and stories are remembered better than stats)
You cause the reader to feel something.
You help the reader relate to the issue
Important!
My favorite script is:
"Sure, you can let [problem] go untreated. But what will happen if you do? Soon, you'll begin to notice [new problem 1] will start to arise. That might bring up [problem 2], etc."
Take the copywriting course, digital writer and entrepreneur Dickie Bush illustrates below when he labels the problem (see: "poor habit") and then illustrates the repercussions.
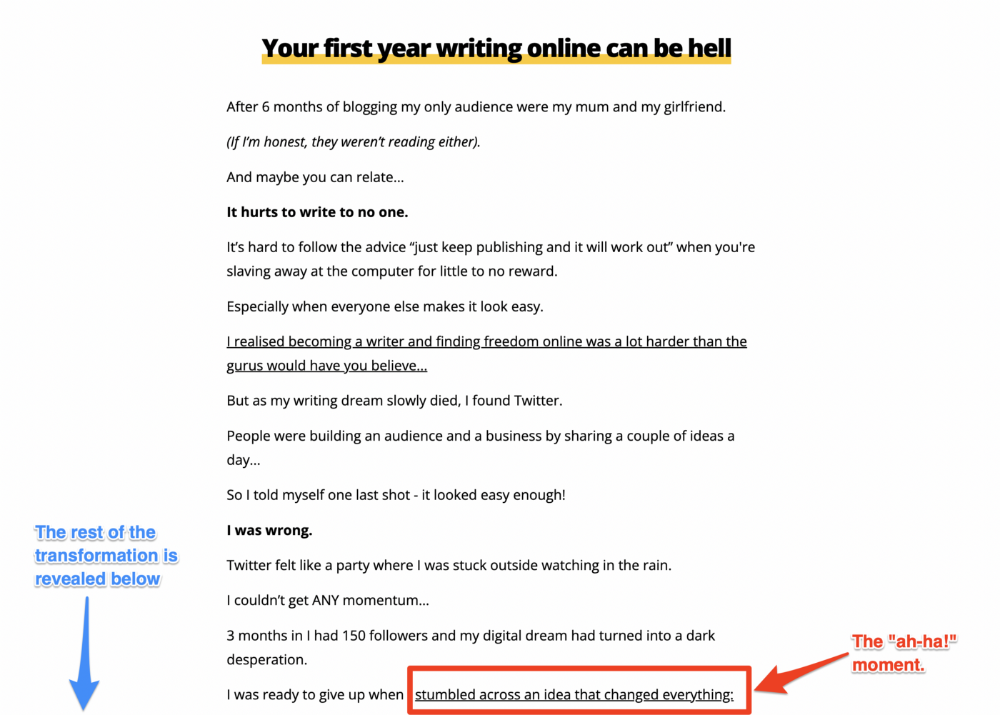
The tale of transformation
Every landing page needs that "ah-ha!" moment.
Transformation stories do this.
Did you find a solution? Someone else made the discovery? Have you tested your theory?
Next, describe your (or your subject's) metamorphosis.
Kieran Drew nails his narrative (and revelation) here. Right before the disclosure, he introduces his "ah-ha!" moment:
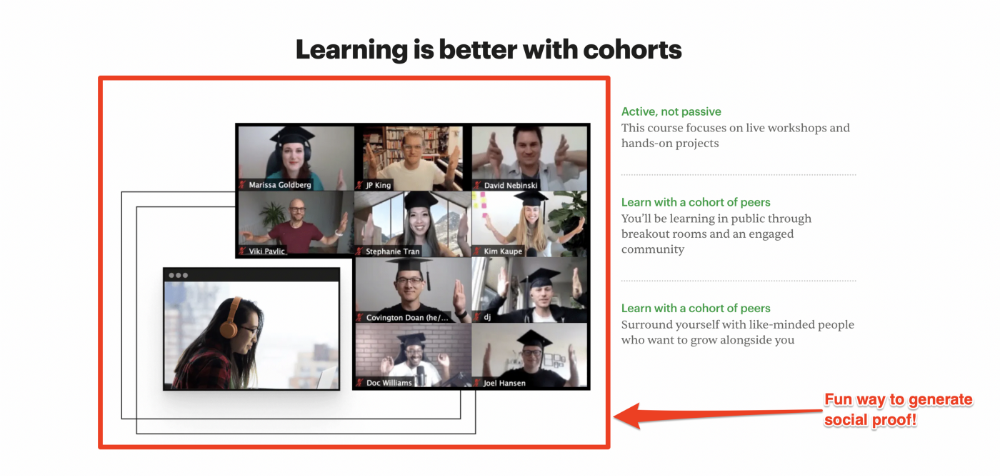
Testimonials
Social proof completes any landing page.
Social proof tells the reader, "If others do it, it must be worthwhile."
This is your argument.
Positive social proof helps (obviously).
Offer "free" training in exchange for a testimonial if you need social evidence. This builds social proof.
Most social proof is testimonies (recommended). Kurtis Hanni's creative take on social proof (using a screenshot of his colleague) is entertaining.
Bravo.
Reveal your offer
Now's the moment to act.
Describe the "bundle" that provides the transformation.
Here's:
Course
Cohort
Ebook
Whatever you're selling.
Include a product or service image, what the consumer is getting ("how it works"), the price, any "free" bonuses (preferred), and a CTA ("buy now").
Clarity is key. Don't make a cunning offer. Make sure your presentation emphasizes customer change (benefits). Dan Koe's Modern Mastery landing page makes an offer. Consider:
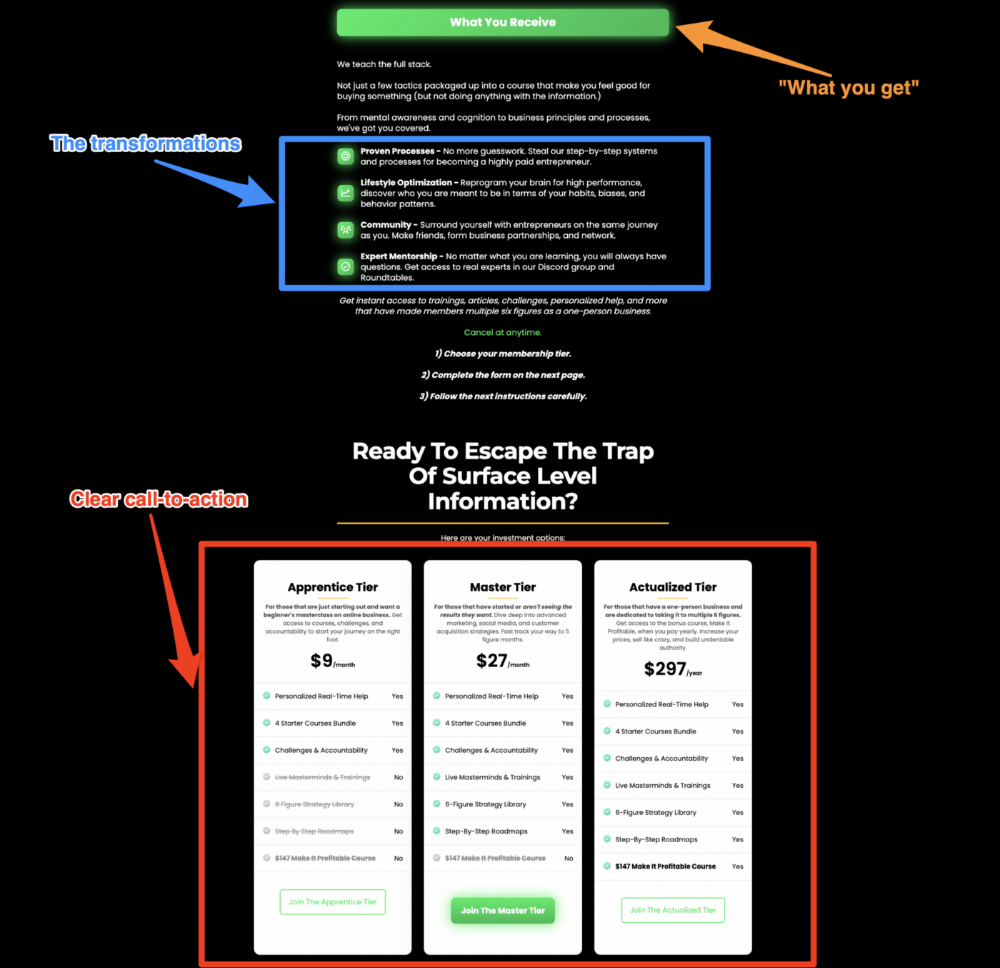
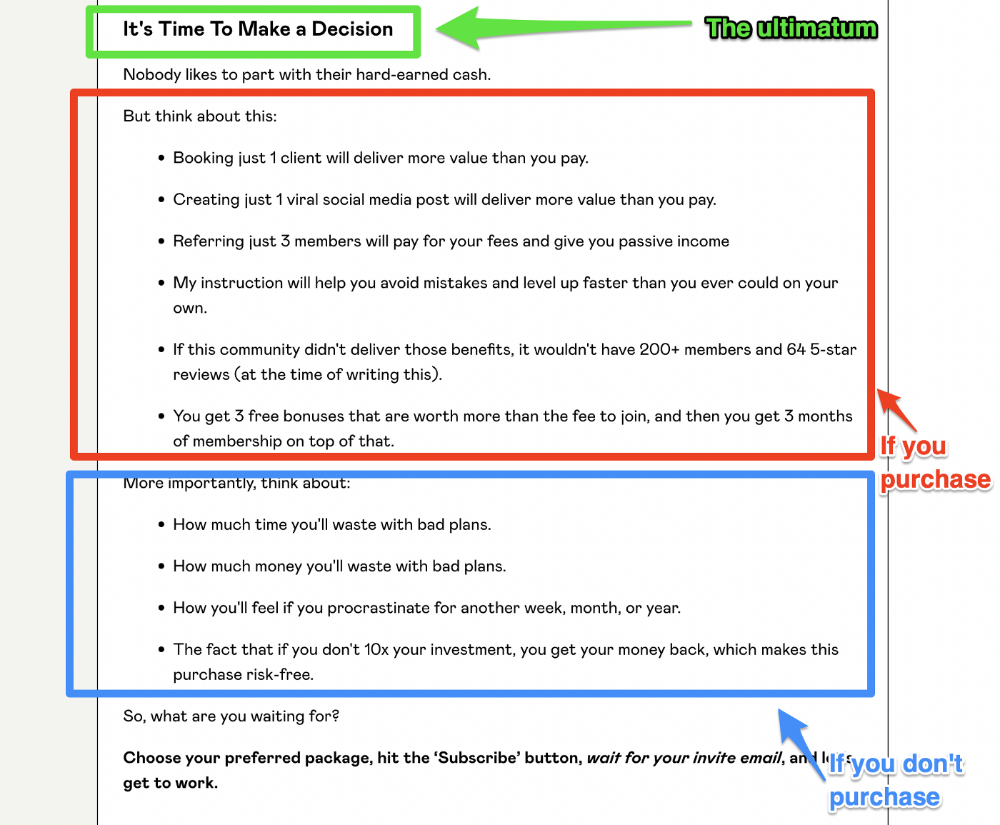
An ultimatum
Offering isn't enough.
You must give your prospect an ultimatum.
They can buy your merchandise from you.
They may exit the webpage.
That’s it.
It's crucial to show what happens if the reader does either. Stress the consequences of not buying (again, a little consequence amplification). Remind them of the benefits of buying.
I appreciate Charles Miller's product offer ending:
The top online creators use a 7-part landing page structure:
Offer the service
Describe the problem
Amplify the consequences
Tell the transformational story
Include testimonials and social proof.
Reveal the offer (with any bonuses if applicable)
Finally, give the reader a deadline to encourage them to take action.
Sequence these sections to develop a landing page that (essentially) prints money.

Aaron Dinin, PhD
2 years ago
Are You Unintentionally Creating the Second Difficult Startup Type?
Most don't understand the issue until it's too late.

My first startup was what entrepreneurs call the hardest. A two-sided marketplace.
Two-sided marketplaces are the hardest startups because founders must solve the chicken or the egg conundrum.
A two-sided marketplace needs suppliers and buyers. Without suppliers, buyers won't come. Without buyers, suppliers won't come. An empty marketplace and a founder striving to gain momentum result.
My first venture made me a struggling founder seeking to achieve traction for a two-sided marketplace. The company failed, and I vowed never to start another like it.
I didn’t. Unfortunately, my second venture was almost as hard. It failed like the second-hardest startup.
What kind of startup is the second-hardest?
The second-hardest startup, which is almost as hard to develop, is rarely discussed in the startup community. Because of this, I predict more founders fail each year trying to develop the second-toughest startup than the hardest.
Fairly, I have no proof. I see many startups, so I have enough of firsthand experience. From what I've seen, for every entrepreneur developing a two-sided marketplace, I'll meet at least 10 building this other challenging startup.
I'll describe a startup I just met with its two co-founders to explain the second hardest sort of startup and why it's so hard. They created a financial literacy software for parents of high schoolers.
The issue appears plausible. Children struggle with money. Parents must teach financial responsibility. Problems?
It's possible.
Buyers and users are different.
Buyer-user mismatch.
The financial literacy app I described above targets parents. The parent doesn't utilize the app. Child is end-user. That may not seem like much, but it makes customer and user acquisition and onboarding difficult for founders.
The difficulty of a buyer-user imbalance
The company developing a product faces a substantial operational burden when the buyer and end customer are different. Consider classic firms where the buyer is the end user to appreciate that responsibility.
Entrepreneurs selling directly to end users must educate them about the product's benefits and use. Each demands a lot of time, effort, and resources.
Imagine selling a financial literacy app where the buyer and user are different. To make the first sale, the entrepreneur must establish all the items I mentioned above. After selling, the entrepreneur must supply a fresh set of resources to teach, educate, or train end-users.
Thus, a startup with a buyer-user mismatch must market, sell, and train two organizations at once, requiring twice the work with the same resources.
The second hardest startup is hard for reasons other than the chicken-or-the-egg conundrum. It takes a lot of creativity and luck to solve the chicken-or-egg conundrum.
The buyer-user mismatch problem cannot be overcome by innovation or luck. Buyer-user mismatches must be solved by force. Simply said, when a product buyer is different from an end-user, founders have a lot more work. If they can't work extra, their companies fail.