

StableGains lost $42M in Anchor Protocol.
StableGains lost millions of dollars in customer funds in Anchor Protocol without telling its users. The Anchor Protocol offered depositors 19-20% APY before its parent ecosystem, Terra LUNA, lost tens of billions of dollars in market capitalization as LUNA fell below $0.01 and its stablecoin (UST) collapsed.
A Terra Research Forum member raised the alarm. StableGains changed its homepage and Terms and Conditions to reflect how it mitigates risk, a tacit admission that it should have done so from the start.
StableGains raised $600,000 in YCombinator's W22 batch. Moonfire, Broom Ventures, and Goodwater Capital invested $3 million more.
StableGains' 15% yield product attracted $42 million in deposits. StableGains kept most of its deposits in Anchor's UST pool earning 19-20% APY, kept one-quarter of the interest as a management fee, and then gave customers their promised 15% APY. It lost almost all customer funds when UST melted down. It changed withdrawal times, hurting customers.
- StableGains said de-pegging was unlikely. According to its website, 1 UST can be bought and sold for $1 of LUNA. LUNA became worthless, and Terra shut down its blockchain.
- It promised to diversify assets across several stablecoins to reduce the risk of one losing its $1 peg, but instead kept almost all of them in one basket.
- StableGains promised withdrawals in three business days, even if a stablecoin needed time to regain its peg. StableGains uses Coinbase for deposits and withdrawals, and customers receive the exact amount of USDC requested.
StableGains scrubs its website squeaky clean
StableGains later edited its website to say it only uses the "most trusted and tested stablecoins" and extended withdrawal times from three days to indefinite time "in extreme cases."
Previously, USDC, TerraUST (UST), and Dai were used (DAI). StableGains changed UST-related website content after the meltdown. It also removed most references to DAI.
Customers noticed a new clause in the Terms and Conditions denying StableGains liability for withdrawal losses. This new clause would have required customers to agree not to sue before withdrawing funds, avoiding a class-action lawsuit.
Customers must sign a waiver to receive a refund.
Erickson Kramer & Osborne law firm has asked StableGains to preserve all internal documents on customer accounts, marketing, and TerraUSD communications. The firm has not yet filed a lawsuit.
Thousands of StableGains customers lost an estimated $42 million.
Celsius Network customers also affected
CEL used Terra LUNA's Anchor Protocol. Celsius users lost money in the crypto market crash and UST meltdown. Many held CEL and LUNA as yielding deposits.
CEO Alex Mashinsky accused "unknown malefactors" of targeting Celsius Network without evidence. Celsius has not publicly investigated this claim as of this article's publication.
CEL fell before UST de-pegged. On June 2, 2021, it reached $8.01. May 19's close: $0.82.
When some Celsius Network users threatened to leave over token losses, Mashinsky replied, "Leave if you don't think I'm sincere and working harder than you, seven days a week."
Celsius Network withdrew $500 million from Anchor Protocol, but smaller holders had trouble.
Read original article here
More on Web3 & Crypto

TheRedKnight
3 years ago
Say goodbye to Ponzi yields - A new era of decentralized perpetual
Decentralized perpetual may be the next crypto market boom; with tons of perpetual popping up, let's look at two protocols that offer organic, non-inflationary yields.
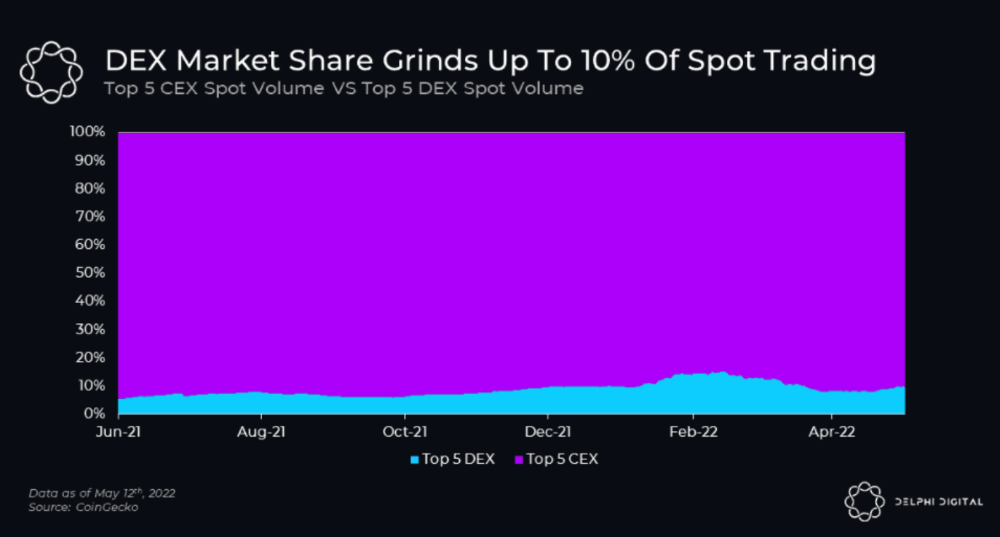
Decentralized derivatives exchanges' market share has increased tenfold in a year, but it's still 2% of CEXs'. DEXs have a long way to go before they can compete with centralized exchanges in speed, liquidity, user experience, and composability.
I'll cover gains.trade and GMX protocol in Polygon, Avalanche, and Arbitrum. Both protocols support leveraged perpetual crypto, stock, and Forex trading.
Why these protocols?
Decentralized GMX Gains protocol
Organic yield: path to sustainability
I've never trusted Defi's non-organic yields. Example: XYZ protocol. 20–75% of tokens may be set aside as farming rewards to provide liquidity, according to tokenomics.
Say you provide ETH-USDC liquidity. They advertise a 50% APR reward for this pair, 10% from trading fees and 40% from farming rewards. Only 10% is real, the rest is "Ponzi." The "real" reward is in protocol tokens.
Why keep this token? Governance voting or staking rewards are promoted services.
Most liquidity providers expect compensation for unused tokens. Basic psychological principles then? — Profit.
Nobody wants governance tokens. How many out of 100 care about the protocol's direction and will vote?
Staking increases your token's value. Currently, they're mostly non-liquid. If the protocol is compromised, you can't withdraw funds. Most people are sceptical of staking because of this.
"Free tokens," lack of use cases, and skepticism lead to tokens moving south. No farming reward protocols have lasted.
It may have shown strength in a bull market, but what about a bear market?
What is decentralized perpetual?
A perpetual contract is a type of futures contract that doesn't expire. So one can hold a position forever.
You can buy/sell any leveraged instruments (Long-Short) without expiration.
In centralized exchanges like Binance and coinbase, fees and revenue (liquidation) go to the exchanges, not users.
Users can provide liquidity that traders can use to leverage trade, and the revenue goes to liquidity providers.
Gains.trade and GMX protocol are perpetual trading platforms with a non-inflationary organic yield for liquidity providers.
GMX protocol
GMX is an Arbitrum and Avax protocol that rewards in ETH and Avax. GLP uses a fast oracle to borrow the "true price" from other trading venues, unlike a traditional AMM.
GLP and GMX are protocol tokens. GLP is used for leveraged trading, swapping, etc.
GLP is a basket of tokens, including ETH, BTC, AVAX, stablecoins, and UNI, LINK, and Stablecoins.
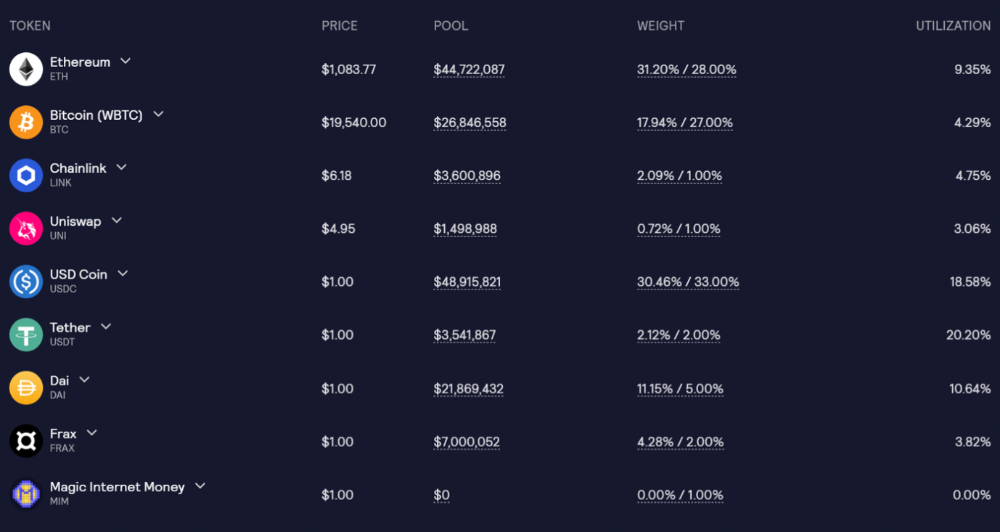
GLP composition on arbitrum
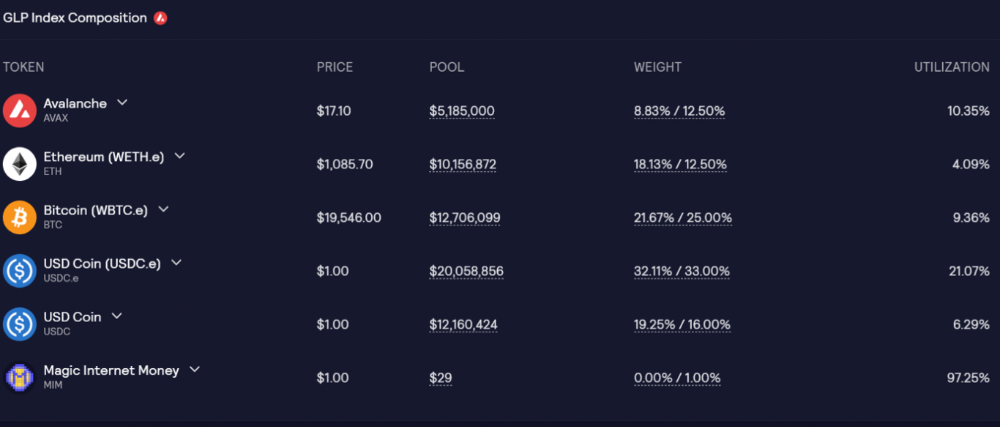
GLP composition on Avalanche
GLP token rebalances based on usage, providing liquidity without loss.
Protocol "runs" on Staking GLP. Depending on their chain, the protocol will reward users with ETH or AVAX. Current rewards are 22 percent (15.71 percent in ETH and the rest in escrowed GMX) and 21 percent (15.72 percent in AVAX and the rest in escrowed GMX). escGMX and ETH/AVAX percentages fluctuate.
Where is the yield coming from?
Swap fees, perpetual interest, and liquidations generate yield. 70% of fees go to GLP stakers, 30% to GMX. Organic yields aren't paid in inflationary farm tokens.
Escrowed GMX is vested GMX that unlocks in 365 days. To fully unlock GMX, you must farm the Escrowed GMX token for 365 days. That means less selling pressure for the GMX token.
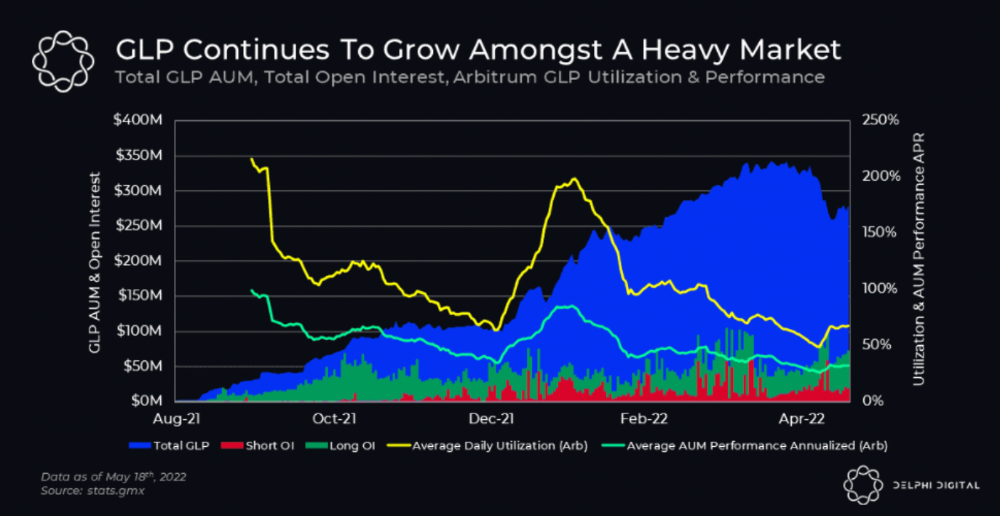
GMX's status
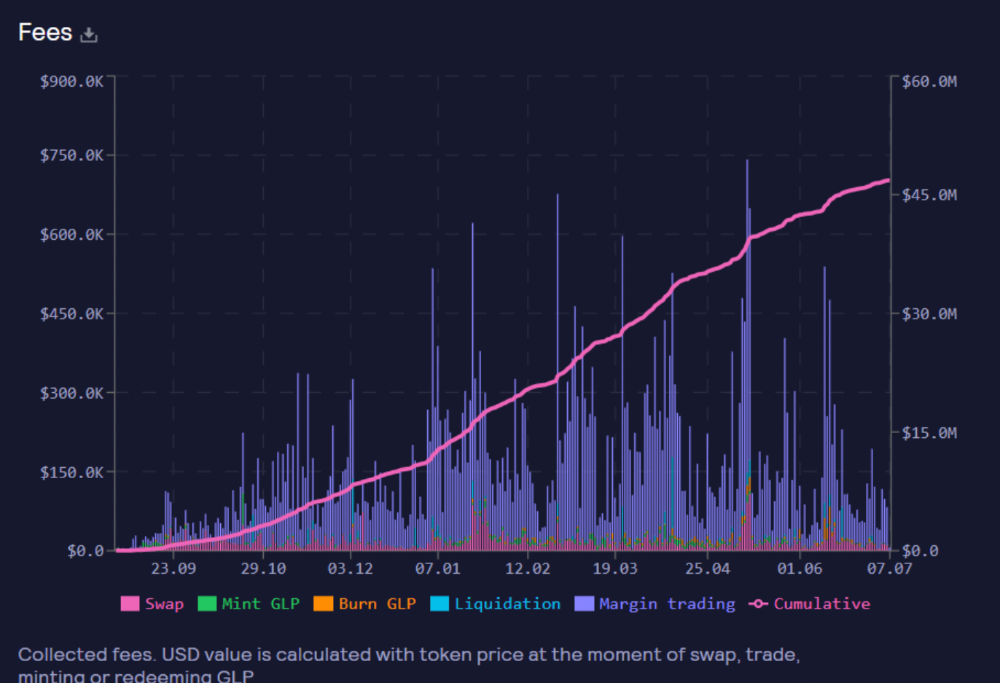
These are the fees in Arbitrum in the past 11 months by GMX.
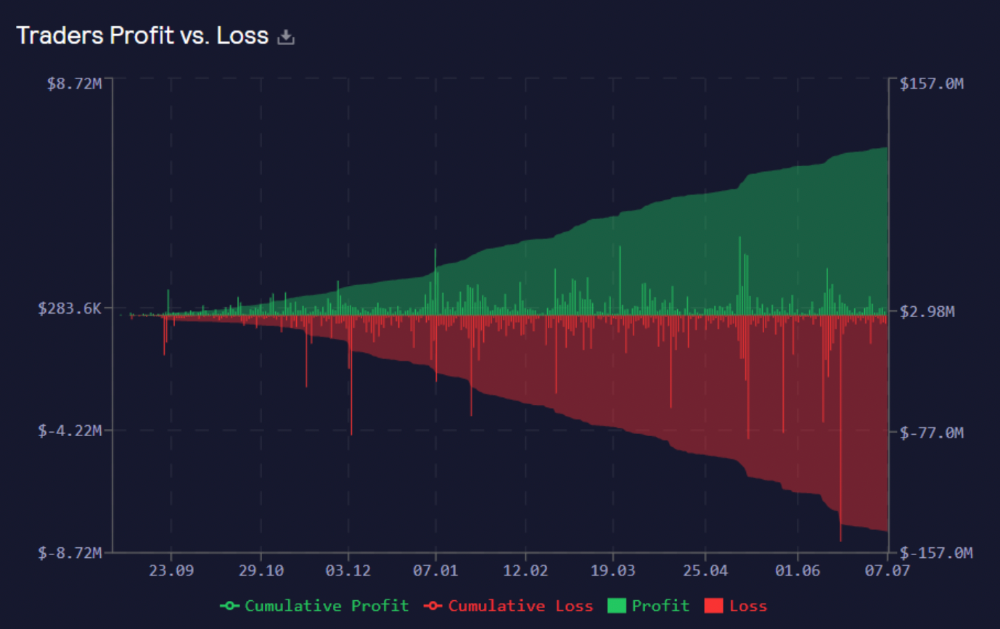
GMX works like a casino, which increases fees. Most fees come from Margin trading, which means most traders lose money; this money goes to the casino, or GLP stakers.
Strategies
My personal strategy is to DCA into GLP when markets hit bottom and stake it; GLP will be less volatile with extra staking rewards.
GLP YoY return vs. naked buying
Let's say I invested $10,000 in BTC, AVAX, and ETH in January.
BTC price: 47665$
ETH price: 3760$
AVAX price: $145
Current prices
BTC $21,000 (Down 56 percent )
ETH $1233 (Down 67.2 percent )
AVAX $20.36 (Down 85.95 percent )
Your $10,000 investment is now worth around $3,000.
How about GLP? My initial investment is 50% stables and 50% other assets ( Assuming the coverage ratio for stables is 50 percent at that time)
Without GLP staking yield, your value is $6500.
Let's assume the average APR for GLP staking is 23%, or $1500. So 8000$ total. It's 50% safer than holding naked assets in a bear market.
In a bull market, naked assets are preferable to GLP.
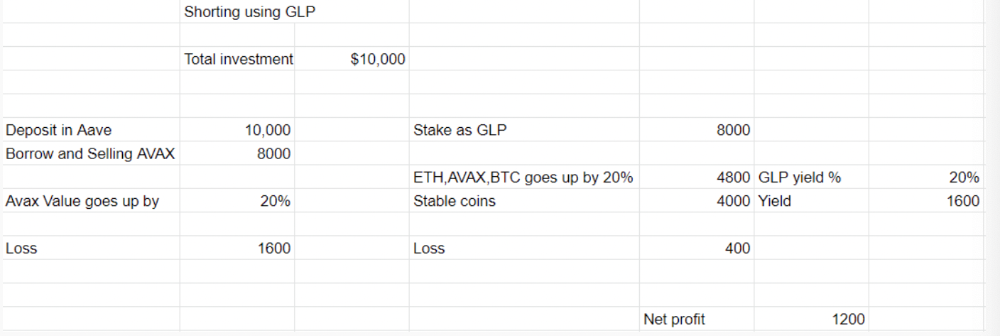
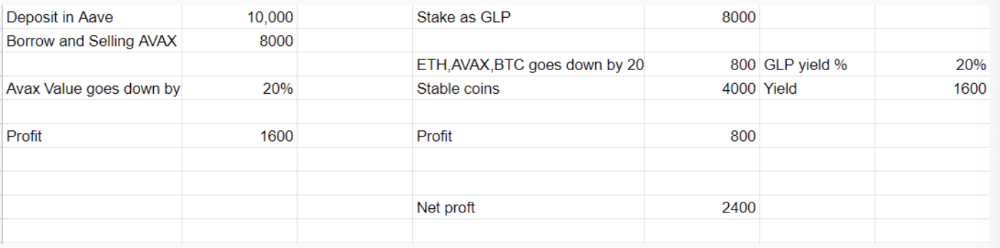
Short farming using GLP
Simple GLP short farming.
You use a stable asset as collateral to borrow AVAX. Sell it and buy GLP. Even if GLP rises, it won't rise as fast as AVAX, so we can get yields.
Let's do the maths
You deposit $10,000 USDT in Aave and borrow Avax. Say you borrow $8,000; you sell it, buy GLP, and risk 20%.
After a year, ETH, AVAX, and BTC rise 20%. GLP is $8800. $800 vanishes. 20% yields $1600. You're profitable. Shorting Avax costs $1600. (Assumptions-ETH, AVAX, BTC move the same, GLP yield is 20%. GLP has a 50:50 stablecoin/others ratio. Aave won't liquidate
In naked Avax shorting, Avax falls 20% in a year. You'll make $1600. If you buy GLP and stake it using the sold Avax and BTC, ETH and Avax go down by 20% - your profit is 20%, but with the yield, your total gain is $2400.
Issues with GMX
GMX's historical funding rates are always net positive, so long always pays short. This makes long-term shorts less appealing.
Oracle price discovery isn't enough. This limitation doesn't affect Bitcoin and ETH, but it affects less liquid assets. Traders can buy and sell less liquid assets at a lower price than their actual cost as long as GMX exists.
As users must provide GLP liquidity, adding more assets to GMX will be difficult. Next iteration will have synthetic assets.
Gains Protocol
Best leveraged trading platform. Smart contract-based decentralized protocol. 46 crypto pairs can be leveraged 5–150x and 10 Forex pairs 5–1000x. $10 DAI @ 150x (min collateral x leverage pos size is $1500 DAI). No funding fees, no KYC, trade DAI from your wallet, keep funds.
DAI single-sided staking and the GNS-DAI pool are important parts of Gains trading. GNS-DAI stakers get 90% of trading fees and 100% swap fees. 10 percent of trading fees go to DAI stakers, which is currently 14 percent!
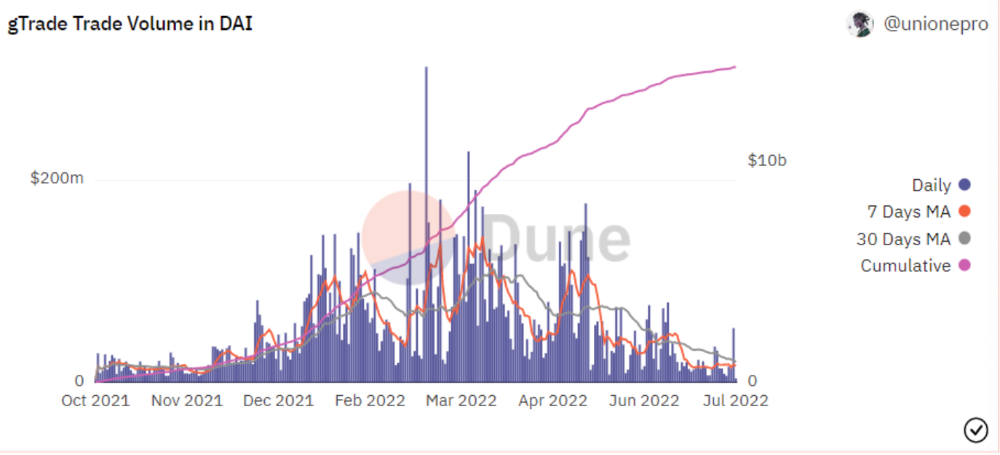
Trade volume
When a trader opens a trade, the leverage and profit are pulled from the DAI pool. If he loses, the protocol yield goes to the stakers.
If the trader's win rate is high and the DAI pool slowly depletes, the GNS token is minted and sold to refill DAI. Trader losses are used to burn GNS tokens. 25%+ of GNS is burned, making it deflationary.
Due to high leverage and volatility of crypto assets, most traders lose money and the protocol always wins, keeping GNS deflationary.
Gains uses a unique decentralized oracle for price feeds, which is better for leverage trading platforms. Let me explain.
Gains uses chainlink price oracles, not its own price feeds. Chainlink oracles only query centralized exchanges for price feeds every minute, which is unsuitable for high-precision trading.
Gains created a custom oracle that queries the eight chainlink nodes for the current price and, on average, for trade confirmation. This model eliminates every-second inquiries, which waste gas but are more efficient than chainlink's per-minute price.
This price oracle helps Gains open and close trades instantly, eliminate scam wicks, etc.
Other benefits include:
Stop-loss guarantee (open positions updated)
No scam wicks
Spot-pricing
Highest possible leverage
Fixed-spreads. During high volatility, a broker can increase the spread, which can hit your stop loss without the price moving.
Trade directly from your wallet and keep your funds.
>90% loss before liquidation (Some platforms liquidate as little as -50 percent)
KYC-free
Directly trade from wallet; keep funds safe
Further improvements
GNS-DAI liquidity providers fear the impermanent loss, so the protocol is migrating to its own liquidity and single staking GNS vaults. This allows users to stake GNS without permanent loss and obtain 90% DAI trading fees by staking. This starts in August.
Their upcoming improvements can be found here.
Gains constantly add new features and change pairs. It's an interesting protocol.
Conclusion
Next bull run, watch decentralized perpetual protocols. Effective tokenomics and non-inflationary yields may attract traders and liquidity providers. But still, there is a long way for them to develop, and I don't see them tackling the centralized exchanges any time soon until they fix their inherent problems and improve fast enough.
Read the full post here.

Rishi Dean
3 years ago
Coinbase's web3 app
Use popular Ethereum dapps with Coinbase’s new dapp wallet and browser
Tl;dr: This post highlights the ability to access web3 directly from your Coinbase app using our new dapp wallet and browser.
Decentralized autonomous organizations (DAOs) and decentralized finance (DeFi) have gained popularity in the last year (DAOs). The total value locked (TVL) of DeFi investments on the Ethereum blockchain has grown to over $110B USD, while NFTs sales have grown to over $30B USD in the last 12 months (LTM). New innovative real-world applications are emerging every day.
Today, a small group of Coinbase app users can access Ethereum-based dapps. Buying NFTs on Coinbase NFT and OpenSea, trading on Uniswap and Sushiswap, and borrowing and lending on Curve and Compound are examples.
Our new dapp wallet and dapp browser enable you to access and explore web3 directly from your Coinbase app.
Web3 in the Coinbase app
Users can now access dapps without a recovery phrase. This innovative dapp wallet experience uses Multi-Party Computation (MPC) technology to secure your on-chain wallet. This wallet's design allows you and Coinbase to share the 'key.' If you lose access to your device, the key to your dapp wallet is still safe and Coinbase can help recover it.
Set up your new dapp wallet by clicking the "Browser" tab in the Android app's navigation bar. Once set up, the Coinbase app's new dapp browser lets you search, discover, and use Ethereum-based dapps.
Looking forward
We want to enable everyone to seamlessly and safely participate in web3, and today’s launch is another step on that journey. We're rolling out the new dapp wallet and browser in the US on Android first to a small subset of users and plan to expand soon. Stay tuned!

Nabil Alouani
3 years ago
Why Cryptocurrency Is Not Dead Despite the FTX Scam
A fraud, free-market, antifragility tale

Crypto's only rival is public opinion.
In less than a week, mainstream media, bloggers, and TikTokers turned on FTX's founder.
While some were surprised, almost everyone with a keyboard and a Twitter account predicted the FTX collapse. These financial oracles should have warned the 1.2 million people Sam Bankman-Fried duped.
After happening, unexpected events seem obvious to our brains. It's a bug and a feature because it helps us cope with disasters and makes our reasoning suck.
Nobody predicted the FTX debacle. Bloomberg? Politicians. Non-famous. No cryptologists. Who?
When FTX imploded, taking billions of dollars with it, an outrage bomb went off, and the resulting shockwave threatens the crypto market's existence.
As someone who lost more than $78,000 in a crypto scam in 2020, I can only understand people’s reactions. When the dust settles and rationality returns, we'll realize this is a natural occurrence in every free market.
What specifically occurred with FTX? (Skip if you are aware.)
FTX is a cryptocurrency exchange where customers can trade with cash. It reached #3 in less than two years as the fastest-growing platform of its kind.
FTX's performance helped make SBF the crypto poster boy. Other reasons include his altruistic public image, his support for the Democrats, and his company Alameda Research.
Alameda Research made a fortune arbitraging Bitcoin.
Arbitrage trading uses small price differences between two markets to make money. Bitcoin costs $20k in Japan and $21k in the US. Alameda Research did that for months, making $1 million per day.
Later, as its capital grew, Alameda expanded its trading activities and began investing in other companies.
Let's now discuss FTX.
SBF's diabolic master plan began when he used FTX-created FTT coins to inflate his trading company's balance sheets. He used inflated Alameda numbers to secure bank loans.
SBF used money he printed himself as collateral to borrow billions for capital. Coindesk exposed him in a report.
One of FTX's early investors tweeted that he planned to sell his FTT coins over the next few months. This would be a minor event if the investor wasn't Binance CEO Changpeng Zhao (CZ).
The crypto space saw a red WARNING sign when CZ cut ties with FTX. Everyone with an FTX account and a brain withdrew money. Two events followed. FTT fell from $20 to $4 in less than 72 hours, and FTX couldn't meet withdrawal requests, spreading panic.
SBF reassured FTX users on Twitter. Good assets.
He lied.
SBF falsely claimed FTX had a liquidity crunch. At the time of his initial claims, FTX owed about $8 billion to its customers. Liquidity shortages are usually minor. To get cash, sell assets. In the case of FTX, the main asset was printed FTT coins.
Sam wouldn't get out of trouble even if he slashed the discount (from $20 to $4) and sold every FTT. He'd flood the crypto market with his homemade coins, causing the price to crash.
SBF was trapped. He approached Binance about a buyout, which seemed good until Binance looked at FTX's books.
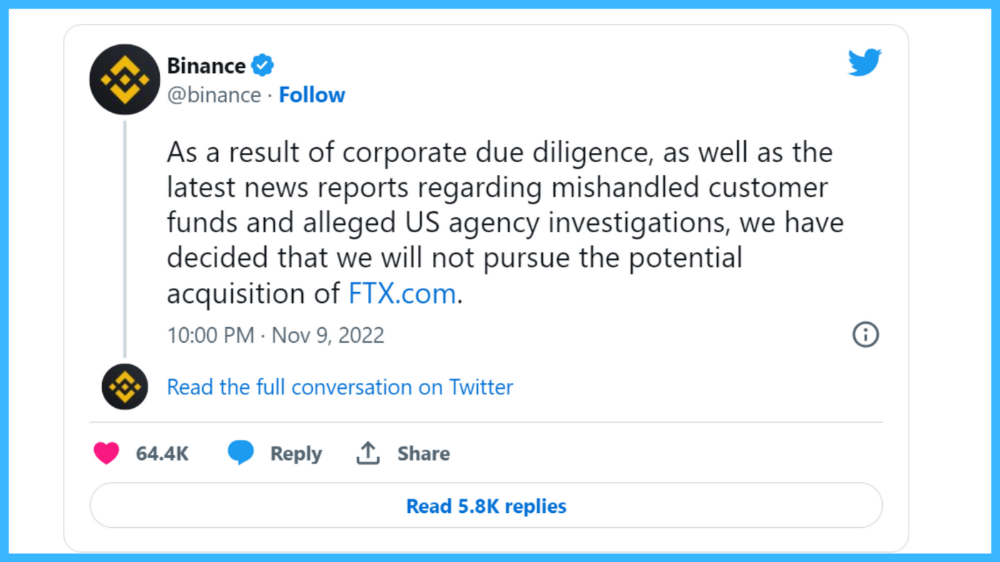
Binance's tweet ended SBF, and he had to apologize, resign as CEO, and file for bankruptcy.
Bloomberg estimated Sam's net worth to be zero by the end of that week. 0!
But that's not all. Twitter investigations exposed fraud at FTX and Alameda Research. SBF used customer funds to trade and invest in other companies.
Thanks to the Twitter indie reporters who made the mainstream press look amateurish. Some Twitter detectives didn't sleep for 30 hours to find answers. Others added to existing threads. Memes were hilarious.
One question kept repeating in my bald head as I watched the Blue Bird. Sam, WTF?
Then I understood.
SBF wanted that FTX becomes a bank.
Think about this. FTX seems healthy a few weeks ago. You buy 2 bitcoins using FTX. You'd expect the platform to take your dollars and debit your wallet, right?
No. They give I-Owe-Yous.
FTX records owing you 2 bitcoins in its internal ledger but doesn't credit your account. Given SBF's tricks, I'd bet on nothing.
What happens if they don't credit my account with 2 bitcoins? Your money goes into FTX's capital, where SBF and his friends invest in marketing, political endorsements, and buying other companies.
Over its two-year existence, FTX invested in 130 companies. Once they make a profit on their purchases, they'll pay you and keep the rest.
One detail makes their strategy dumb. If all FTX customers withdraw at once, everything collapses.
Financially savvy people think FTX's collapse resembles a bank run, and they're right. SBF designed FTX to operate like a bank.
You expect your bank to open a drawer with your name and put $1,000 in it when you deposit $1,000. They deposit $100 in your drawer and create an I-Owe-You for $900. What happens to $900?
Let's sum it up: It's boring and headache-inducing.
When you deposit money in a bank, they can keep 10% and lend the rest. Fractional Reserve Banking is a popular method. Fractional reserves operate within and across banks.
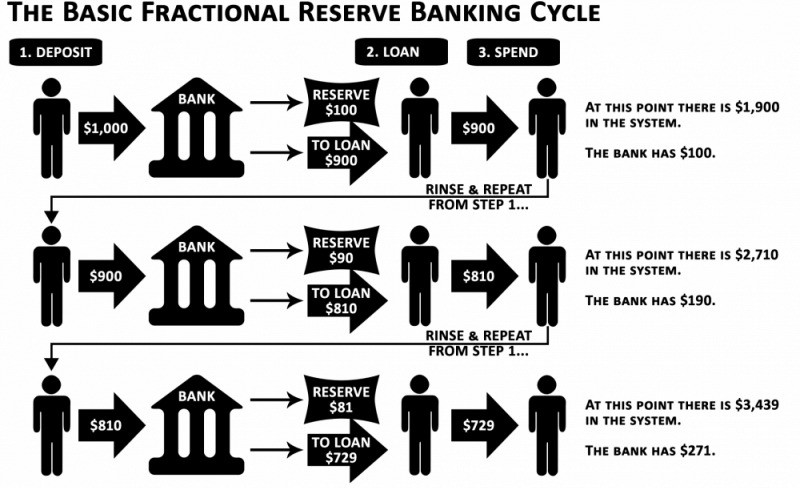
Fractional reserve banking generates $10,000 for every $1,000 deposited. People will pay off their debt plus interest.
As long as banks work together and the economy grows, their model works well.
SBF tried to replicate the system but forgot two details. First, traditional banks need verifiable collateral like real estate, jewelry, art, stocks, and bonds, not digital coupons. Traditional banks developed a liquidity buffer. The Federal Reserve (or Central Bank) injects massive cash into troubled banks.
Massive cash injections come from taxpayers. You and I pay for bankers' mistakes and annual bonuses. Yes, you may think banking is rigged. It's rigged, but it's the best financial game in 150 years. We accept its flaws, including bailouts for too-big-to-fail companies.
Anyway.
SBF wanted Binance's bailout. Binance said no, which was good for the crypto market.
Free markets are resilient.
Nassim Nicholas Taleb coined the term antifragility.
“Some things benefit from shocks; they thrive and grow when exposed to volatility, randomness, disorder, and stressors and love adventure, risk, and uncertainty. Yet, in spite of the ubiquity of the phenomenon, there is no word for the exact opposite of fragile. Let us call it antifragile. Antifragility is beyond resilience or robustness. The resilient resists shocks and stays the same; the antifragile gets better.”
The easiest way to understand how antifragile systems behave is to compare them with other types of systems.
Glass is like a fragile system. It snaps when shocked.
Similar to rubber, a resilient system. After a stressful episode, it bounces back.
A system that is antifragile is similar to a muscle. As it is torn in the gym, it gets stronger.
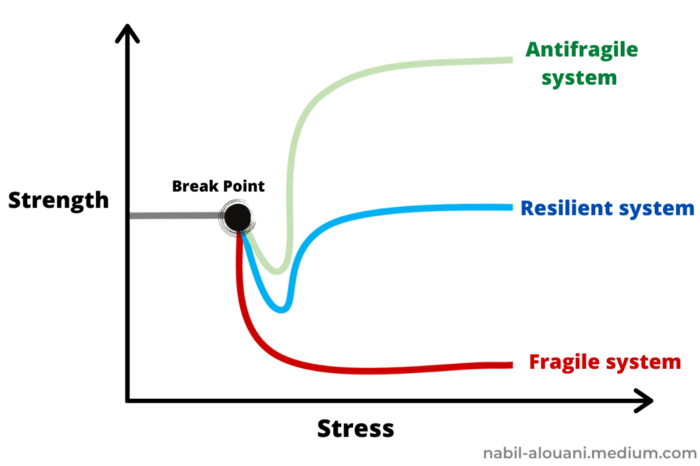
Time-changed things are antifragile. Culture, tech innovation, restaurants, revolutions, book sales, cuisine, economic success, and even muscle shape. These systems benefit from shocks and randomness in different ways, but they all pay a price for antifragility.
Same goes for the free market and financial institutions. Taleb's book uses restaurants as an example and ends with a reference to the 2008 crash.
“Restaurants are fragile. They compete with each other. But the collective of local restaurants is antifragile for that very reason. Had restaurants been individually robust, hence immortal, the overall business would be either stagnant or weak and would deliver nothing better than cafeteria food — and I mean Soviet-style cafeteria food. Further, it [the overall business] would be marred with systemic shortages, with once in a while a complete crisis and government bailout.”
Imagine the same thing with banks.
Independent banks would compete to offer the best services. If one of these banks fails, it will disappear. Customers and investors will suffer, but the market will recover from the dead banks' mistakes.
This idea underpins a free market. Bitcoin and other cryptocurrencies say this when criticizing traditional banking.
The traditional banking system's components never die. When a bank fails, the Federal Reserve steps in with a big taxpayer-funded check. This hinders bank evolution. If you don't let banking cells die and be replaced, your financial system won't be antifragile.
The interdependence of banks (centralization) means that one bank's mistake can sink the entire fleet, which brings us to SBF's ultimate travesty with FTX.
FTX has left the cryptocurrency gene pool.
FTX should be decentralized and independent. The super-star scammer invested in more than 130 crypto companies and linked them, creating a fragile banking-like structure. FTX seemed to say, "We exist because centralized banks are bad." But we'll be good, unlike the centralized banking system.
FTX saved several companies, including BlockFi and Voyager Digital.
FTX wanted to be a crypto bank conglomerate and Federal Reserve. SBF wanted to monopolize crypto markets. FTX wanted to be in bed with as many powerful people as possible, so SBF seduced politicians and celebrities.
Worst? People who saw SBF's plan flaws praised him. Experts, newspapers, and crypto fans praised FTX. When billions pour in, it's hard to realize FTX was acting against its nature.
Then, they act shocked when they realize FTX's fall triggered a domino effect. Some say the damage could wipe out the crypto market, but that's wrong.
Cell death is different from body death.
FTX is out of the game despite its size. Unfit, it fell victim to market natural selection.
Next?
The challengers keep coming. The crypto economy will improve with each failure.
Free markets are antifragile because their fragile parts compete, fostering evolution. With constructive feedback, evolution benefits customers and investors.
FTX shows that customers don't like being scammed, so the crypto market's health depends on them. Charlatans and con artists are eliminated quickly or slowly.
Crypto isn't immune to collapse. Cryptocurrencies can go extinct like biological species. Antifragility isn't immortality. A few more decades of evolution may be enough for humans to figure out how to best handle money, whether it's bitcoin, traditional banking, gold, or something else.
Keep your BS detector on. Start by being skeptical of this article's finance-related claims. Even if you think you understand finance, join the conversation.
We build a better future through dialogue. So listen, ask, and share. When you think you can't find common ground with the opposing view, remember:
Sam Bankman-Fried lied.
You might also like

Protos
3 years ago
Plagiarism on OpenSea: humans and computers
OpenSea, a non-fungible token (NFT) marketplace, is fighting plagiarism. A new “two-pronged” approach will aim to root out and remove copies of authentic NFTs and changes to its blue tick verified badge system will seek to enhance customer confidence.
According to a blog post, the anti-plagiarism system will use algorithmic detection of “copymints” with human reviewers to keep it in check.
Last year, NFT collectors were duped into buying flipped images of the popular BAYC collection, according to The Verge. The largest NFT marketplace had to remove its delay pay minting service due to an influx of copymints.
80% of NFTs removed by the platform were minted using its lazy minting service, which kept the digital asset off-chain until the first purchase.
NFTs copied from popular collections are opportunistic money-grabs. Right-click, save, and mint the jacked JPEGs that are then flogged as an authentic NFT.
The anti-plagiarism system will scour OpenSea's collections for flipped and rotated images, as well as other undescribed permutations. The lack of detail here may be a deterrent to scammers, or it may reflect the new system's current rudimentary nature.
Thus, human detectors will be needed to verify images flagged by the detection system and help train it to work independently.
“Our long-term goal with this system is two-fold: first, to eliminate all existing copymints on OpenSea, and second, to help prevent new copymints from appearing,” it said.
“We've already started delisting identified copymint collections, and we'll continue to do so over the coming weeks.”
It works for Twitter, why not OpenSea
OpenSea is also changing account verification. Early adopters will be invited to apply for verification if their NFT stack is worth $100 or more. OpenSea plans to give the blue checkmark to people who are active on Twitter and Discord.
This is just the beginning. We are committed to a future where authentic creators can be verified, keeping scammers out.
Also, collections with a lot of hype and sales will get a blue checkmark. For example, a new NFT collection sold by the verified BAYC account will have a blue badge to verify its legitimacy.
New requests will be responded to within seven days, according to OpenSea.
These programs and products help protect creators and collectors while ensuring our community can confidently navigate the world of NFTs.
By elevating authentic content and removing plagiarism, these changes improve trust in the NFT ecosystem, according to OpenSea.
OpenSea is indeed catching up with the digital art economy. Last August, DevianArt upgraded its AI image recognition system to find stolen tokenized art on marketplaces like OpenSea.
It scans all uploaded art and compares it to “public blockchain events” like Ethereum NFTs to detect stolen art.

The Mystique
3 years ago
Four Shocking Dark Web Incidents that Should Make You Avoid It
Dark Web activity? Is it as horrible as they say?

We peruse our phones for hours. Internet has improved our worldview.
However, the world's harshest realities remain buried on the internet and unattainable by everyone.
Browsers cannot access the Dark Web. Browse it with high-security authentication and exclusive access. There are compelling reasons to avoid the dark web at all costs.
1. The Dark Web and I

Darius wrote My Dark Web Story on reddit two years ago. The user claimed to have shared his dark web experience. DaRealEddyYT wanted to surf the dark web after hearing several stories.
He curiously downloaded Tor Browser, which provides anonymity and security.
In the Dark Room, bound
As Darius logged in, a text popped up: “Want a surprise? Click on this link.”
The link opened to a room with a chair. Only one light source illuminated the room. The chair held a female tied.
As the screen read "Let the game begin," a man entered the room and was paid in bitcoins to torment the girl.
The man dragged and tortured the woman.
A danger to safety
Leaving so soon, Darius, disgusted Darius tried to leave the stream. The anonymous user then sent Darius his personal information, including his address, which frightened him because he didn't know Tor was insecure.
After deleting the app, his phone camera was compromised.
He also stated that he left his residence and returned to find it unlocked and a letter saying, Thought we wouldn't find you? Reddit never updated the story.
The story may have been a fake, but a much scarier true story about the dark side of the internet exists.
2. The Silk Road Market

The dark web is restricted for a reason. The dark web has everything illicit imaginable. It's awful central.
The dark web has everything, from organ sales to drug trafficking to money laundering to human trafficking. Illegal drugs, pirated software, credit card, bank, and personal information can be found in seconds.
The dark web has reserved websites like Google. The Silk Road Website, which operated from 2011 to 2013, was a leading digital black market.
The FBI grew obsessed with site founder and processor Ross William Ulbricht.
The site became a criminal organization as money laundering and black enterprises increased. Bitcoin was utilized for credit card payment.
The FBI was close to arresting the site's administrator. Ross was detained after the agency closed Silk Road in 2013.
Two years later, in 2015, he was convicted and sentenced to two consecutive life terms and forty years. He appealed in 2016 but was denied, thus he is currently serving time.
The hefty sentence was for more than running a black marketing site. He was also convicted of murder-for-hire, earning about $730,000 in a short time.
3. Person-buying auctions

Bidding on individuals is another weird internet activity. After a Milan photo shoot, 20-year-old British model Chloe Ayling was kidnapped.
An ad agency in Milan made a bogus offer to shoot with the mother of a two-year-old boy. Four men gave her anesthetic and put her in a duffel bag when she arrived.
She was held captive for several days, and her images and $300,000 price were posted on the dark web. Black Death Trafficking Group kidnapped her to sell her for sex.
She was told two black death foot warriors abducted her. The captors released her when they found she was a mother because mothers were less desirable to sex slave buyers.
In July 2018, Lukasz Pawel Herba was arrested and sentenced to 16 years and nine months in prison. Being a young mother saved Chloe from creepy bidding.
However, it exceeds expectations of how many more would be in such danger daily without their knowledge.
4. Organ sales

Many are unaware of dark web organ sales. Patients who cannot acquire organs often turn to dark web brokers.
Brokers handle all transactions between donors and customers.
Bitcoins are used for dark web transactions, and the Tor server permits personal data on the web.
The WHO reports approximately 10,000 unlawful organ transplants annually. The black web sells kidneys, hearts, even eyes.
To protect our lives and privacy, we should manage our curiosity and never look up dangerous stuff.
While it's fascinating and appealing to know what's going on in the world we don't know about, it's best to prioritize our well-being because one never knows how bad it might get.
Sources

Nick Nolan
3 years ago
How to Make $1,037,100 in 4 Months with This Weird Website
One great idea might make you rich.
Imagine having a million-dollar concept in college that made a million.
2005 precisely.
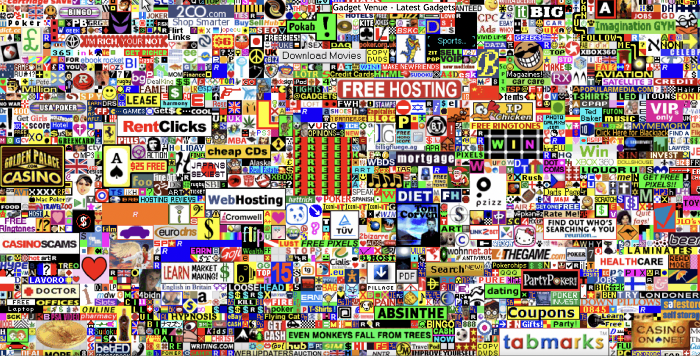
Alex Tew, 21, from Wiltshire, England, created The Million Dollar Homepage in August 2005. The idea is basic but beyond the ordinary, which is why it worked.
Alex built a 1,000,000-pixel webpage.
Each website pixel would cost $1. Since pixels are hard to discern, he sold 10x10 squares for $100.
He'd make a million if all the spots sold.
He may have thought about NFTs and the Metaverse decades ago.
MillionDollarHomepage.com launched in 2005.
Businesses and individuals could buy a website spot and add their logo, website link, and tagline. You bought an ad, but nobody visited the website.
If a few thousand people visited the website, it could drive traffic to your business's site.
Alex promised buyers the website would be up for 5 years, so it was a safe bet.
Alex's friend with a music website was the first to buy real estate on the site. Within two weeks, 4,700 pixels sold, and a tracker showed how many were sold and available.

Word-of-mouth marketing got the press's attention quickly. Everyone loves reading about new ways to make money, so it was a good news story.
By September, over 250,000 pixels had been sold, according to a BBC press release.
Alex and the website gained more media and public attention, so traffic skyrocketed. Two months after the site launched, 1,400 customers bought more than 500,000 pixels.
Businesses bought online real estate. They heard thousands visited the site, so they could get attention cheaply.
Unless you bought a few squares, I'm not sure how many people would notice your ad or click your link.
A sponge website owner emailed Alex:
“We tried Million Dollar Homepage because we were impressed at the level of ingenuity and the sheer simplicity of it. If we’re honest, we didn’t expect too much from it. Now, as a direct result, we are pitching for £18,000 GBP worth of new clients and have seen our site traffic increase over a hundred-fold. We’re even going to have to upgrade our hosting facility! It’s been exceptional.”
Web.archive.org screenshots show how the website changed.
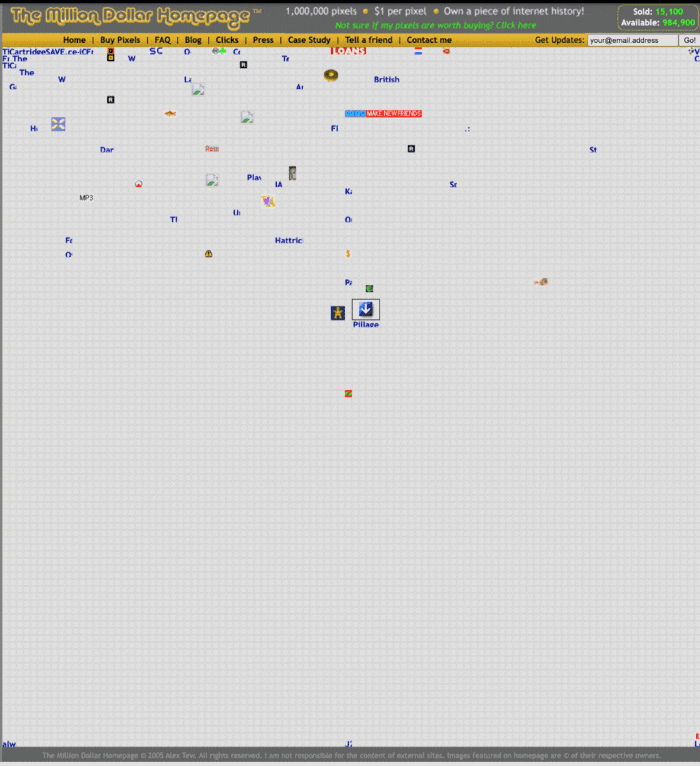
“The idea is to create something of an internet time capsule: a homepage that is unique and permanent. Everything on the internet keeps changing so fast, it will be nice to have something that stays solid and permanent for many years. You can be a part of that!” Alex Tew, 2005
The last 1,000 pixels were sold on January 1, 2006.
By then, the homepage had hundreds of thousands of monthly visitors. Alex put the last space on eBay due to high demand.
MillionDollarWeightLoss.com won the last pixels for $38,100, bringing revenue to $1,037,100 in 4 months.

Many have tried to replicate this website's success. They've all failed.
This idea only worked because no one had seen this website before.
This winner won't be repeated, but it should inspire you to try something new and creative.
Still popular, you could buy one of the linked domains. You can't buy pixels, but you can buy an expired domain.
One link I clicked costs $59,888.
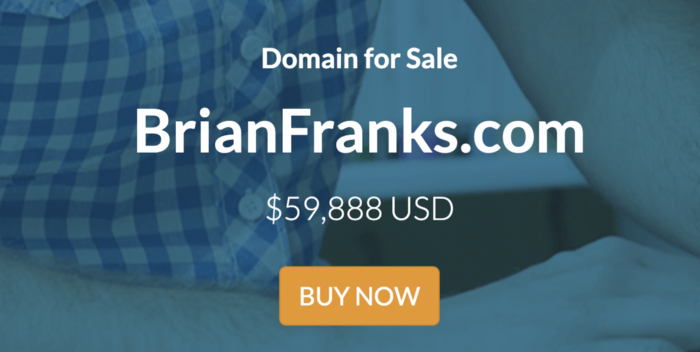
You'd own a piece of internet history if you spent that much on a domain.
Someone bought stablesgallery.co.uk after the domain expired and restored it.
Many of the linked websites have expired or been redirected, but some still link to the original. I couldn't find sponge's website. Can you?
This is a great example of how a simple creative idea can go viral.
Comment on this amazing success story.