


Coinbase's web3 app
Use popular Ethereum dapps with Coinbase’s new dapp wallet and browser
Tl;dr: This post highlights the ability to access web3 directly from your Coinbase app using our new dapp wallet and browser.
Decentralized autonomous organizations (DAOs) and decentralized finance (DeFi) have gained popularity in the last year (DAOs). The total value locked (TVL) of DeFi investments on the Ethereum blockchain has grown to over $110B USD, while NFTs sales have grown to over $30B USD in the last 12 months (LTM). New innovative real-world applications are emerging every day.
Today, a small group of Coinbase app users can access Ethereum-based dapps. Buying NFTs on Coinbase NFT and OpenSea, trading on Uniswap and Sushiswap, and borrowing and lending on Curve and Compound are examples.
Our new dapp wallet and dapp browser enable you to access and explore web3 directly from your Coinbase app.
Web3 in the Coinbase app
Users can now access dapps without a recovery phrase. This innovative dapp wallet experience uses Multi-Party Computation (MPC) technology to secure your on-chain wallet. This wallet's design allows you and Coinbase to share the 'key.' If you lose access to your device, the key to your dapp wallet is still safe and Coinbase can help recover it.
Set up your new dapp wallet by clicking the "Browser" tab in the Android app's navigation bar. Once set up, the Coinbase app's new dapp browser lets you search, discover, and use Ethereum-based dapps.
Looking forward
We want to enable everyone to seamlessly and safely participate in web3, and today’s launch is another step on that journey. We're rolling out the new dapp wallet and browser in the US on Android first to a small subset of users and plan to expand soon. Stay tuned!
More on Web3 & Crypto

Matt Ward
3 years ago
Is Web3 nonsense?
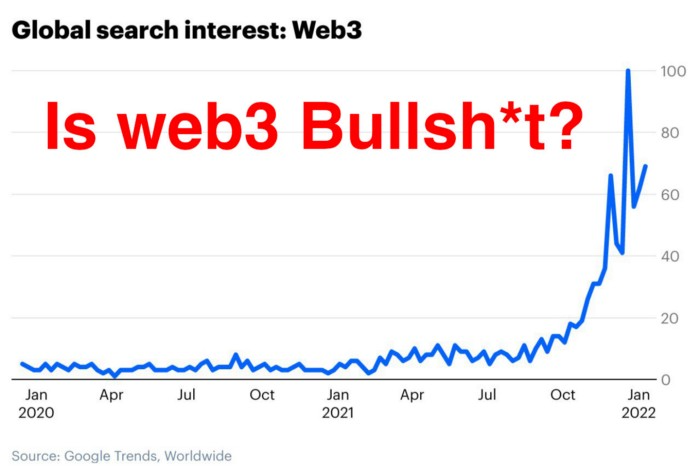
Crypto and blockchain have rebranded as web3. They probably thought it sounded better and didn't want the baggage of scam ICOs, STOs, and skirted securities laws.
It was like Facebook becoming Meta. Crypto's biggest players wanted to change public (and regulator) perception away from pump-and-dump schemes.
After the 2018 ICO gold rush, it's understandable. Every project that raised millions (or billions) never shipped a meaningful product.
Like many crazes, charlatans took the money and ran.
Despite its grifter past, web3 is THE hot topic today as more founders, venture firms, and larger institutions look to build the future decentralized internet.
Supposedly.
How often have you heard: This will change the world, fix the internet, and give people power?
Why are most of web3's biggest proponents (and beneficiaries) the same rich, powerful players who built and invested in the modern internet? It's like they want to remake and own the internet.
Something seems off about that.
Why are insiders getting preferential presale terms before the public, allowing early investors and proponents to flip dirt cheap tokens and advisors shares almost immediately after the public sale?
It's a good gig with guaranteed markups, no risk or progress.
If it sounds like insider trading, it is, at least practically. This is clear when people talk about blockchain/web3 launches and tokens.
Fast money, quick flips, and guaranteed markups/returns are common.
Incentives-wise, it's hard to blame them. Who can blame someone for following the rules to win? Is it their fault or regulators' for not leveling the playing field?
It's similar to oil companies polluting for profit, Instagram depressing you into buying a new dress, or pharma pushing an unnecessary pill.
All of that is fair game, at least until we change the playbook, because people (and corporations) change for pain or love. Who doesn't love money?
belief based on money gain
Sinclair:
“It is difficult to get a man to understand something when his salary depends upon his not understanding it.”
Bitcoin, blockchain, and web3 analogies?
Most blockchain and web3 proponents are true believers, not cynical capitalists. They believe blockchain's inherent transparency and permissionless trust allow humanity to evolve beyond our reptilian ways and build a better decentralized and democratic world.
They highlight issues with the modern internet and monopoly players like Google, Facebook, and Apple. Decentralization fixes everything
If we could give power back to the people and get governments/corporations/individuals out of the way, we'd fix everything.
Blockchain solves supply chain and child labor issues in China.
To meet Paris climate goals, reduce emissions. Create a carbon token.
Fixing online hatred and polarization Web3 Twitter and Facebook replacement.
Web3 must just be the answer for everything… your “perfect” silver bullet.
Nothing fits everyone. Blockchain has pros and cons like everything else.
Blockchain's viral, ponzi-like nature has an MLM (mid level marketing) feel. If you bought Taylor Swift's NFT, your investment is tied to her popularity.
Probably makes you promote Swift more. Play music loudly.
Here's another example:
Imagine if Jehovah’s Witnesses (or evangelical preachers…) got paid for every single person they converted to their cause.
It becomes a self-fulfilling prophecy as their faith and wealth grow.
Which breeds extremism? Ultra-Orthodox Jews are an example. maximalists
Bitcoin and blockchain are causes, religions. It's a money-making movement and ideal.
We're good at convincing ourselves of things we want to believe, hence filter bubbles.
I ignore anything that doesn't fit my worldview and seek out like-minded people, which algorithms amplify.
Then what?
Is web3 merely a new scam?
No, never!
Blockchain has many crucial uses.
Sending money home/abroad without bank fees;
Like fleeing a war-torn country and converting savings to Bitcoin;
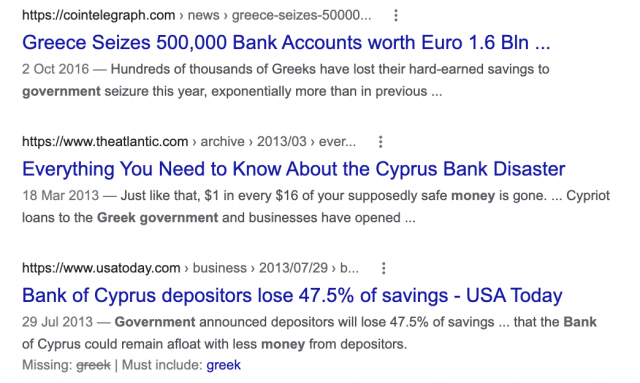
Like preventing Twitter from silencing dissidents.
Permissionless, trustless databases could benefit society and humanity. There are, however, many limitations.
Lost password?
What if you're cheated?
What if Trump/Putin/your favorite dictator incites a coup d'état?
What-ifs abound. Decentralization's openness brings good and bad.
No gatekeepers or firefighters to rescue you.
ISIS's fundraising is also frictionless.
Community-owned apps with bad interfaces and service.
Trade-offs rule.
So what compromises does web3 make?
What are your trade-offs? Decentralization has many strengths and flaws. Like Bitcoin's wasteful proof-of-work or Ethereum's political/wealth-based proof-of-stake.
To ensure the survival and veracity of the network/blockchain and to safeguard its nodes, extreme measures have been designed/put in place to prevent hostile takeovers aimed at altering the blockchain, i.e., adding money to your own wallet (account), etc.
These protective measures require significant resources and pose challenges. Reduced speed and throughput, high gas fees (cost to submit/write a transaction to the blockchain), and delayed development times, not to mention forked blockchain chains oops, web3 projects.
Protecting dissidents or rogue regimes makes sense. You need safety, privacy, and calm.
First-world life?
What if you assumed EVERYONE you saw was out to rob/attack you? You'd never travel, trust anyone, accomplish much, or live fully. The economy would collapse.
It's like an ant colony where half the ants do nothing but wait to be attacked.
Waste of time and money.
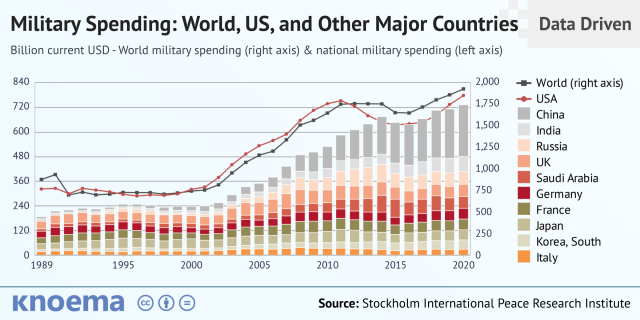
11% of the US budget goes to the military. Imagine what we could do with the $766B+ we spend on what-ifs annually.
Is so much hypothetical security needed?
Blockchain and web3 are similar.
Does your app need permissionless decentralization? Does your scooter-sharing company really need a proof-of-stake system and 1000s of nodes to avoid Russian hackers? Why?
Worst-case scenario? It's not life or death, unless you overstate the what-ifs. Web3 proponents find improbable scenarios to justify decentralization and tokenization.
Do I need a token to prove ownership of my painting? Unless I'm a master thief, I probably bought it.
despite losing the receipt.
I do, however, love Web 3.
Enough Web3 bashing for now. Understand? Decentralization isn't perfect, but it has huge potential when applied to the right problems.
I see many of the right problems as disrupting big tech's ruthless monopolies. I wrote several years ago about how tokenized blockchains could be used to break big tech's stranglehold on platforms, marketplaces, and social media.
Tokenomics schemes can be used for good and are powerful. Here’s how.
Before the ICO boom, I made a series of predictions about blockchain/crypto's future. It's still true.
Here's where I was then and where I see web3 going:
My 11 Big & Bold Predictions for Blockchain
In the near future, people may wear crypto cash rings or bracelets.
While some governments repress cryptocurrency, others will start to embrace it.
Blockchain will fundamentally alter voting and governance, resulting in a more open election process.
Money freedom will lead to a more geographically open world where people will be more able to leave when there is unrest.
Blockchain will make record keeping significantly easier, eliminating the need for a significant portion of government workers whose sole responsibility is paperwork.
Overrated are smart contracts.
6. Tokens will replace company stocks.
7. Blockchain increases real estate's liquidity, value, and volatility.
8. Healthcare may be most affected.
9. Crypto could end privacy and lead to Minority Report.
10. New companies with network effects will displace incumbents.
11. Soon, people will wear rings or bracelets with crypto cash.
Some have already happened, while others are still possible.
Time will tell if they happen.
And finally:
What will web3 be?
Who will be in charge?
Closing remarks
Hope you enjoyed this web3 dive. There's much more to say, but that's for another day.
We're writing history as we go.
Tech regulation, mergers, Bitcoin surge How will history remember us?
What about web3 and blockchain?
Is this a revolution or a tulip craze?
Remember, actions speak louder than words (share them in the comments).
Your turn.

Nitin Sharma
3 years ago
Web3 Terminology You Should Know
The easiest online explanation.

Web3 is growing. Crypto companies are growing.
Instagram, Adidas, and Stripe adopted cryptocurrency.
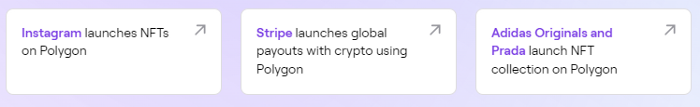
Bitcoin and other cryptocurrencies made web3 famous.
Most don't know where to start. Cryptocurrency, DeFi, etc. are investments.
Since we don't understand web3, I'll help you today.
Let’s go.
1. Web3
It is the third generation of the web, and it is built on the decentralization idea which means no one can control it.
There are static webpages that we can only read on the first generation of the web (i.e. Web 1.0).
Web 2.0 websites are interactive. Twitter, Medium, and YouTube.
Each generation controlled the website owner. Simply put, the owner can block us. However, data breaches and selling user data to other companies are issues.
They can influence the audience's mind since they have control.
Assume Twitter's CEO endorses Donald Trump. Result? Twitter would have promoted Donald Trump with tweets and graphics, enhancing his chances of winning.
We need a decentralized, uncontrollable system.
And then there’s Web3.0 to consider. As Bitcoin and Ethereum values climb, so has its popularity. Web3.0 is uncontrolled web evolution. It's good and bad.
Dapps, DeFi, and DAOs are here. It'll all be explained afterwards.
2. Cryptocurrencies:
No need to elaborate.
Bitcoin, Ethereum, Cardano, and Dogecoin are cryptocurrencies. It's digital money used for payments and other uses.
Programs must interact with cryptocurrencies.
3. Blockchain:
Blockchain facilitates bitcoin transactions, investments, and earnings.
This technology governs Web3. It underpins the web3 environment.
Let us delve much deeper.
Blockchain is simple. However, the name expresses the meaning.
Blockchain is a chain of blocks.
Let's use an image if you don't understand.
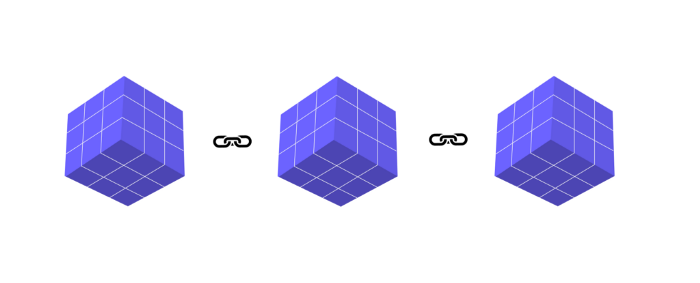
The graphic above explains blockchain. Think Blockchain. The block stores related data.
Here's more.
4. Smart contracts
Programmers and developers must write programs. Smart contracts are these blockchain apps.
That’s reasonable.
Decentralized web3.0 requires immutable smart contracts or programs.
5. NFTs
Blockchain art is NFT. Non-Fungible Tokens.
Explaining Non-Fungible Token may help.
Two sorts of tokens:
These tokens are fungible, meaning they can be changed. Think of Bitcoin or cash. The token won't change if you sell one Bitcoin and acquire another.
Non-Fungible Token: Since these tokens cannot be exchanged, they are exclusive. For instance, music, painting, and so forth.
Right now, Companies and even individuals are currently developing worthless NFTs.
The concept of NFTs is much improved when properly handled.
6. Dapp
Decentralized apps are Dapps. Instagram, Twitter, and Medium apps in the same way that there is a lot of decentralized blockchain app.
Curve, Yearn Finance, OpenSea, Axie Infinity, etc. are dapps.
7. DAOs
DAOs are member-owned and governed.
Consider it a company with a core group of contributors.
8. DeFi
We all utilize centrally regulated financial services. We fund these banks.
If you have $10,000 in your bank account, the bank can invest it and retain the majority of the profits.
We only get a penny back. Some banks offer poor returns. To secure a loan, we must trust the bank, divulge our information, and fill out lots of paperwork.
DeFi was built for such issues.
Decentralized banks are uncontrolled. Staking, liquidity, yield farming, and more can earn you money.
Web3 beginners should start with these resources.

Caleb Naysmith
3 years ago Draft
A Myth: Decentralization
It’s simply not conceivable, or at least not credible.
One of the most touted selling points of Crypto has always been this grandiose idea of decentralization. Bitcoin first arose in 2009 after the housing crisis and subsequent crash that came with it. It aimed to solve this supposed issue of centralization. Nobody “owns” Bitcoin in theory, so the idea then goes that it won’t be subject to the same downfalls that led to the 2008 crash or similarly speculative events that led to the 2008 disaster. The issue is the banks, not the human nature associated with the greedy individuals running them.
Subsequent blockchains have attempted to fix many of the issues of Bitcoin by increasing capacity, decreasing the costs and processing times associated with Bitcoin, and expanding what can be done with their blockchains. Since nobody owns Bitcoin, it hasn’t really been able to be expanded on. You have people like Vitalk Buterin, however, that actively work on Ethereum though.
The leap from Bitcoin to Ethereum was a massive leap toward centralization, and the trend has only gotten worse. In fact, crypto has since become almost exclusively centralized in recent years.
Decentralization is only good in theory
It’s a good idea. In fact, it’s a wonderful idea. However, like other utopian societies, individuals misjudge human nature and greed. In a perfect world, decentralization would certainly be a wonderful idea because sure, people may function as their own banks, move payments immediately, remain anonymous, and so on. However, underneath this are a couple issues:
You can already send money instantaneously today.
They are not decentralized.
Decentralization is a bad idea.
Being your own bank is a stupid move.
Let’s break these down. Some are quite simple, but lets have a look.
Sending money right away
One thing with crypto is the idea that you can send payments instantly. This has pretty much been entirely solved in current times. You can transmit significant sums of money instantly for a nominal cost and it’s instantaneously cleared. Venmo was launched in 2009 and has since increased to prominence, and currently is on most people's phones. I can directly send ANY amount of money quickly from my bank to another person's Venmo account.
Comparing that with ETH and Bitcoin, Venmo wins all around. I can send money to someone for free instantly in dollars and the only fee paid is optional depending on when you want it.
Both Bitcoin and Ethereum are subject to demand. If the blockchains have a lot of people trying to process transactions fee’s go up, and the time that it takes to receive your crypto takes longer. When Ethereum gets bad, people have reported spending several thousand of dollars on just 1 transaction.
These transactions take place via “miners” bundling and confirming transactions, then recording them on the blockchain to confirm that the transaction did indeed happen. They charge fees to do this and are also paid in Bitcoin/ETH. When a transaction is confirmed, it's then sent to the other users wallet. This within itself is subject to lots of controversy because each transaction needs to be confirmed 6 times, this takes massive amounts of power, and most of the power is wasted because this is an adversarial system in which the person that mines the transaction gets paid, and everyone else is out of luck. Also, these could theoretically be subject to a “51% attack” in which anyone with over 51% of the mining hash rate could effectively control all of the transactions, and reverse transactions while keeping the BTC resulting in “double spending”.
There are tons of other issues with this, but essentially it means: They rely on these third parties to confirm the transactions. Without people confirming these transactions, Bitcoin stalls completely, and if anyone becomes too dominant they can effectively control bitcoin.
Not to mention, these transactions are in Bitcoin and ETH, not dollars. So, you need to convert them to dollars still, and that's several more transactions, and likely to take several days anyway as the centralized exchange needs to send you the money by traditional methods.
They are not distributed
That takes me to the following point. This isn’t decentralized, at all. Bitcoin is the closest it gets because Satoshi basically closed it to new upgrades, although its still subject to:
Whales
Miners
It’s vital to realize that these are often the same folks. While whales aren’t centralized entities typically, they can considerably effect the price and outcome of Bitcoin. If the largest wallets holding as much as 1 million BTC were to sell, it’d effectively collapse the price perhaps beyond repair. However, Bitcoin can and is pretty much controlled by the miners. Further, Bitcoin is more like an oligarchy than decentralized. It’s been effectively used to make the rich richer, and both the mining and price is impacted by the rich. The overwhelming minority of those actually using it are retail investors. The retail investors are basically never the ones generating money from it either.
As far as ETH and other cryptos go, there is realistically 0 case for them being decentralized. Vitalik could not only kill it but even walking away from it would likely lead to a significant decline. It has tons of issues right now that Vitalik has promised to fix with the eventual Ethereum 2.0., and stepping away from it wouldn’t help.
Most tokens as well are generally tied to some promise of future developments and creators. The same is true for most NFT projects. The reason 99% of crypto and NFT projects fail is because they failed to deliver on various promises or bad dev teams, or poor innovation, or the founders just straight up stole from everyone. I could go more in-depth than this but go find any project and if there is a dev team, company, or person tied to it then it's likely, not decentralized. The success of that project is directly tied to the dev team, and if they wanted to, most hold large wallets and could sell it all off effectively killing the project. Not to mention, any crypto project that doesn’t have a locked contract can 100% be completely rugged and they can run off with all of the money.
Decentralization is undesirable
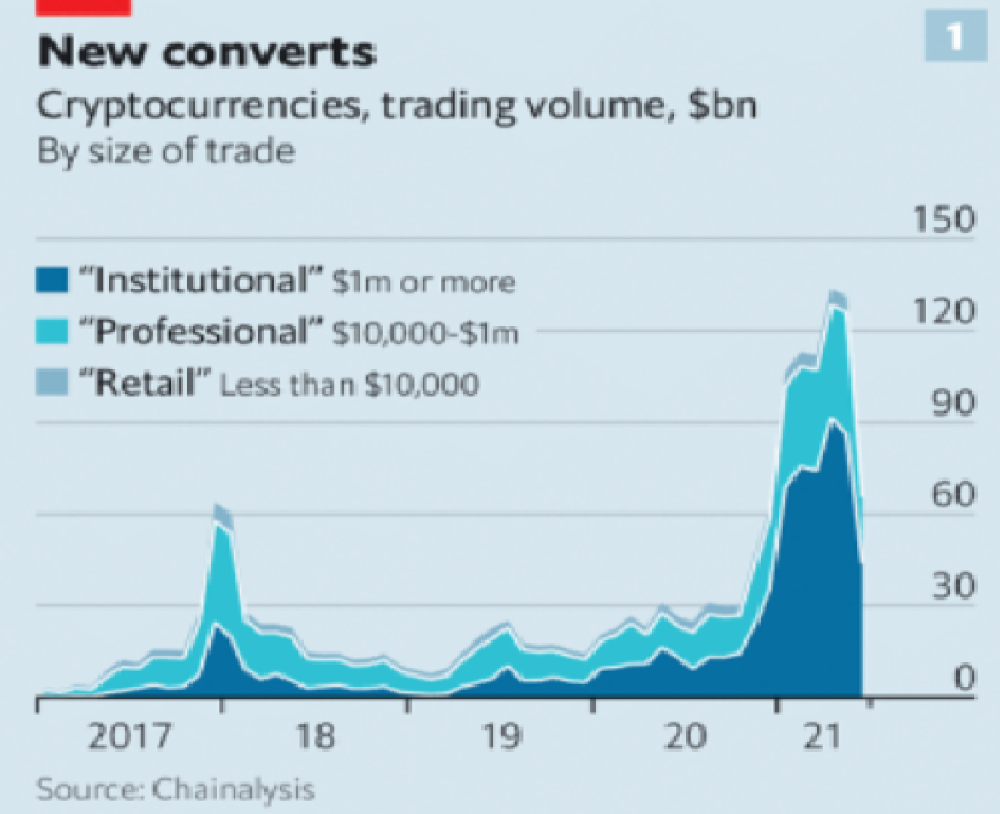
Even if they were decentralized then it would not be a good thing. The graphic above indicates this is effectively a rich person’s unregulated playground… so it’s exactly like… the very issue it tried to solve?
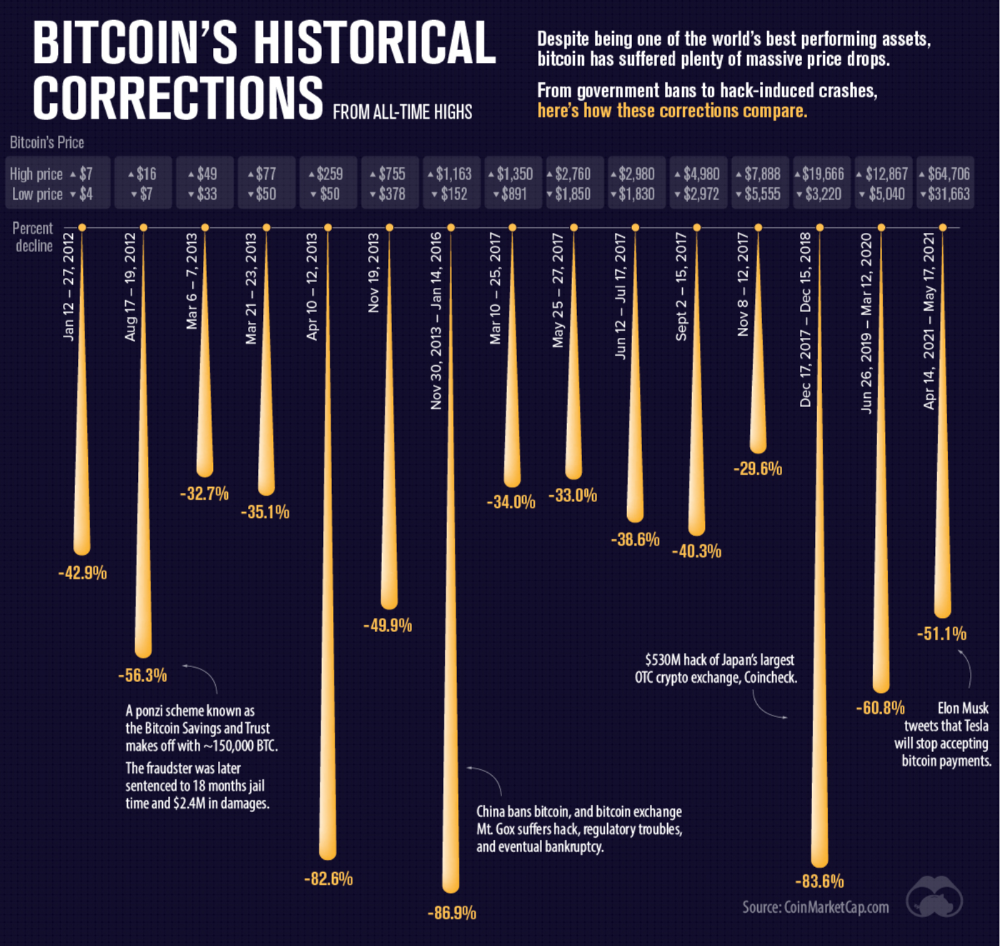
Not to mention, it’s supposedly meant to prevent things like 2008, but is regularly subjected to 50–90% drawdowns in value? Back when Bitcoin was only known in niche parts of the dark web and illegal markets, it would regularly drop as much as 90% and has a long history of massive drawdowns.
The majority of crypto is blatant scams, and ALL of crypto is a “zero” or “negative” sum game in that it relies on the next person buying for people to make money. This is not a good thing. This has yet to solve any issues around what caused the 2008 crisis. Rather, it seemingly amplified all of the bad parts of it actually. Crypto is the ultimate speculative asset and realistically has no valuation metric. People invest in Apple because it has revenue and cash on hand. People invest in crypto purely for speculation. The lack of regulation or accountability means this is amplified to the most extreme degree where anything goes: Fraud, deception, pump and dumps, scams, etc. This results in a pure speculative madhouse where, unsurprisingly, only the rich win. Not only that but the deck is massively stacked in against the everyday investor because you can’t do a pump and dump without money.
At the heart of all of this is still the same issues: greed and human nature. However, in setting out to solve the issues that allowed 2008 to happen, they made something that literally took all of the bad parts of 2008 and then amplified it. 2008, similarly, was due to greed and human nature but was allowed to happen due to lack of oversite, rich people's excessive leverage over the poor, and excessive speculation. Crypto trades SOLELY on human emotion, has 0 oversite, is pure speculation, and the power dynamic is just as bad or worse.
Why should each individual be their own bank?
This is the last one, and it's short and basic. Why do we want people functioning as their own bank? Everything we do relies on another person. Without the internet, and internet providers there is no crypto. We don’t have people functioning as their own home and car manufacturers or internet service providers. Sure, you might specialize in some of these things, but masquerading as your own bank is a horrible idea.
I am not in the banking industry so I don’t know all the issues with banking. Most people aren’t in banking or crypto, so they don’t know the ENDLESS scams associated with it, and they are bound to lose their money eventually.
If you appreciate this article and want to read more from me and authors like me, without any limits, consider buying me a coffee: buymeacoffee.com/calebnaysmith
You might also like

ANTHONY P.
3 years ago
Startups are difficult. Streamlining the procedure for creating the following unicorn.
New ventures are exciting. It's fun to imagine yourself rich, successful, and famous (if that's your thing). How you'll help others and make your family proud. This excitement can pull you forward for years, even when you intuitively realize that the path you're on may not lead to your desired success.
Know when to change course. Switching course can mean pivoting or changing direction.
In this not-so-short blog, I'll describe the journey of building your dream. And how the journey might look when you think you're building your dream, but fall short of that vision. Both can feel similar in the beginning, but there are subtle differences.
Let’s dive in.
How an exciting journey to a dead end looks and feels.
You want to help many people. You're business-minded, creative, and ambitious. You jump into entrepreneurship. You're excited, free, and in control.
I'll use tech as an example because that's what I know best, but this applies to any entrepreneurial endeavor.
So you start learning the basics of your field, say coding/software development. You read books, take courses, and may even join a bootcamp. You start practicing, and the journey begins. Once you reach a certain level of skill (which can take months, usually 12-24), you gain the confidence to speak with others in the field and find common ground. You might attract a co-founder this way with time. You and this person embark on a journey (Tip: the idea you start with is rarely the idea you end with).
Amateur mistake #1: You spend months building a product before speaking to customers.
Building something pulls you forward blindly. You make mistakes, avoid customers, and build with your co-founder or small team in the dark for months, usually 6-12 months.
You're excited when the product launches. We'll be billionaires! The market won't believe it. This excites you and the team. Launch.
….
Nothing happens.
Some people may sign up out of pity, only to never use the product or service again.
You and the team are confused, discouraged and in denial. They don't get what we've built yet. We need to market it better, we need to talk to more investors, someone will understand our vision.
This is a hopeless path, and your denial could last another 6 months. If you're lucky, while talking to consumers and investors (which you should have done from the start), someone who has been there before would pity you and give you an idea to pivot into that can create income.
Suppose you get this idea and pivot your business. Again, you've just pivoted into something limited by what you've already built. It may be a revenue-generating idea, but it's rarely new. Now you're playing catch-up, doing something others are doing but you can do better. (Tip #2: Don't be late.) Your chances of winning are slim, and you'll likely never catch up.
You're finally seeing revenue and feel successful. You can compete, but if you're not a first mover, you won't earn enough over time. You'll get by or work harder than ever to earn what a skilled trade could provide. You didn't go into business to stress out and make $100,000 or $200,000 a year. When you can make the same amount by becoming a great software developer, electrician, etc.
You become stuck. Either your firm continues this way for years until you realize there isn't enough growth to recruit a strong team and remove yourself from day-to-day operations due to competition. Or a catastrophic economic event forces you to admit that what you were building wasn't new and unique and wouldn't get you where you wanted to be.
This realization could take 6-10 years. No kidding.
The good news is, you’ve learned a lot along the way and this information can be used towards your next venture (if you have the energy).
Key Lesson: Don’t build something if you aren’t one of the first in the space building it just for the sake of building something.
-
Let's discuss what it's like to build something that can make your dream come true.
Case 2: Building something the market loves is difficult but rewarding.
It starts with a problem that hasn't been adequately solved for a long time but is now solvable due to technology. Or a new problem due to a change in how things are done.
Let's examine each example.
Example #1: Mass communication. The problem is now solvable due to some technological breakthrough.
Twitter — One of the first web 2 companies that became successful with the rise of smart mobile computing.
People can share their real-time activities via mobile device with friends, family, and strangers. Web 2 and smartphones made it easy and fun.
Example #2: A new problem has emerged due to some change in the way things are conducted.
Zoom- A web-conferencing company that reached massive success due to the movement towards “work from home”, remote/hybrid work forces.
Online web conferencing allows for face-to-face communication.
-
These two examples show how to build a unicorn-type company. It's a mix of solving the right problem at the right time, either through a technological breakthrough that opens up new opportunities or by fundamentally changing how people do things.
Let's find these opportunities.
Start by examining problems, such as how the world has changed and how we can help it adapt. It can also be both. Start team brainstorming. Research technologies, current world-trends, use common sense, and make a list. Then, choose the top 3 that you're most excited about and seem most workable based on your skillsets, values, and passion.
Once you have this list, create the simplest MVP you can and test it with customers. The prototype can be as simple as a picture or diagram of user flow and end-user value. No coding required. Market-test. Twitter's version 1 was simple. It was a web form that asked, "What are you doing?" Then publish it from your phone. A global status update, wherever you are. Currently, this company has a $50 billion market cap.
Here's their MVP screenshot.
Small things grow. Tiny. Simplify.
Remember Frequency and Value when brainstorming. Your product is high frequency (Twitter, Instagram, Snapchat, TikTok) or high value (Airbnb for renting travel accommodations), or both (Gmail).
Once you've identified product ideas that meet the above criteria, they're simple, have a high frequency of use, or provide deep value. You then bring it to market in the simplest, most cost-effective way. You can sell a half-working prototype with imagination and sales skills. You need just enough of a prototype to convey your vision to a user or customer.
With this, you can approach real people. This will do one of three things: give you a green light to continue on your vision as is, show you that there is no opportunity and people won't use it, or point you in a direction that is a blend of what you've come up with and what the customer / user really wants, and you update the prototype and go back to the maze. Repeat until you have enough yeses and conviction to build an MVP.

DC Palter
3 years ago
How Will You Generate $100 Million in Revenue? The Startup Business Plan
A top-down company plan facilitates decision-making and impresses investors.

A startup business plan starts with the product, the target customers, how to reach them, and how to grow the business.
Bottom-up is terrific unless venture investors fund it.
If it can prove how it can exceed $100M in sales, investors will invest. If not, the business may be wonderful, but it's not venture capital-investable.
As a rule, venture investors only fund firms that expect to reach $100M within 5 years.
Investors get nothing until an acquisition or IPO. To make up for 90% of failed investments and still generate 20% annual returns, portfolio successes must exit with a 25x return. A $20M-valued company must be acquired for $500M or more.
This requires $100M in sales (or being on a nearly vertical trajectory to get there). The company has 5 years to attain that milestone and create the requisite ROI.
This motivates venture investors (venture funds and angel investors) to hunt for $100M firms within 5 years. When you pitch investors, you outline how you'll achieve that aim.
I'm wary of pitches after seeing a million hockey sticks predicting $5M to $100M in year 5 that never materialized. Doubtful.
Startups fail because they don't have enough clients, not because they don't produce a great product. That jump from $5M to $100M never happens. The company reaches $5M or $10M, growing at 10% or 20% per year. That's great, but not enough for a $500 million deal.
Once it becomes clear the company won’t reach orbit, investors write it off as a loss. When a corporation runs out of money, it's shut down or sold in a fire sale. The company can survive if expenses are trimmed to match revenues, but investors lose everything.
When I hear a pitch, I'm not looking for bright income projections but a viable plan to achieve them. Answer these questions in your pitch.
Is the market size sufficient to generate $100 million in revenue?
Will the initial beachhead market serve as a springboard to the larger market or as quicksand that hinders progress?
What marketing plan will bring in $100 million in revenue? Is the market diffuse and will cost millions of dollars in advertising, or is it one, focused market that can be tackled with a team of salespeople?
Will the business be able to bridge the gap from a small but fervent set of early adopters to a larger user base and avoid lock-in with their current solution?
Will the team be able to manage a $100 million company with hundreds of people, or will hypergrowth force the organization to collapse into chaos?
Once the company starts stealing market share from the industry giants, how will it deter copycats?
The requirement to reach $100M may be onerous, but it provides a context for difficult decisions: What should the product be? Where should we concentrate? who should we hire? Every strategic choice must consider how to reach $100M in 5 years.
Focusing on $100M streamlines investor pitches. Instead of explaining everything, focus on how you'll attain $100M.
As an investor, I know I'll lose my money if the startup doesn't reach this milestone, so the revenue prediction is the first thing I look at in a pitch deck.
Reaching the $100M goal needs to be the first thing the entrepreneur thinks about when putting together the business plan, the central story of the pitch, and the criteria for every important decision the company makes.

B Kean
3 years ago
Russia's greatest fear is that no one will ever fear it again.
When everyone laughs at him, he's powerless.

1-2-3: Fold your hands and chuckle heartily. Repeat until you're really laughing.
We're laughing at Russia's modern-day shortcomings, if you hadn't guessed.
Watch Good Fellas' laughing scene on YouTube. Ray Liotta, Joe Pesci, and others laugh hysterically in a movie. Laugh at that scene, then think of Putin's macho guy statement on February 24 when he invaded Ukraine. It's cathartic to laugh at his expense.
Right? It makes me feel great that he was convinced the military action will be over in a week. I love reading about Putin's morning speech. Many stupid people on Earth supported him. Many loons hailed his speech historic.
Russia preys on the weak. Strong Ukraine overcame Russia. Ukraine's right. As usual, Russia is in the wrong.
A so-called thought leader recently complained on Russian TV that the West no longer fears Russia, which is why Ukraine is kicking Russia's ass.
Let's simplify for this Russian intellectual. Except for nuclear missiles, the West has nothing to fear from Russia. Russia is a weak, morally-empty country whose DNA has degraded to the point that evolution is already working to flush it out.
The West doesn't fear Russia since he heads a prominent Russian institution. Russian universities are intellectually barren. I taught at St. Petersburg University till June (since February I was virtually teaching) and was astounded by the lack of expertise.
Russians excel in science, math, engineering, IT, and anything that doesn't demand critical thinking or personal ideas.
Reflecting on many of the high-ranking individuals from around the West, Satanovsky said: “They are not interested in us. We only think we’re ‘big politics’ for them but for those guys we’re small politics. “We’re small politics, even though we think of ourselves as the descendants of the Russian Empire, of the USSR. We are not the Soviet Union, we don’t have enough weirdos and lunatics, we practically don’t have any (U.S. Has Stopped Fearing Us).”
Professor Dmitry Evstafiev, president of the Institute of the Middle East, praised Nikita Khrushchev's fiery nature because he made the world fear him, which made the Soviet Union great. If the world believes Putin is crazy, then Russia will be great, says this man. This is crazy.
Evstafiev covered his cowardice by saluting Putin. He praised his culture and Ukraine patience. This weakling professor ingratiates himself to Putin instead of calling him a cowardly, demonic shithead.
This is why we don't fear Russia, professor. Because you're all sycophantic weaklings who sold your souls to a Leningrad narcissist. Putin's nothing. He lacks intelligence. You've tied your country's fate and youth's future to this terrible monster. Disgraceful!
How can you loathe your country's youth so much to doom them to decades or centuries of ignominy? My son is half Russian and must now live with this portion of him.
We don't fear Russia because you don't realize that it should be appreciated, not frightened. That would need lobotomizing tens of millions of people like you.
Sadman. You let a Leningrad weakling castrate you and display your testicles. He shakes the container, saying, "Your balls are mine."
Why is Russia not feared?
Your self-inflicted national catastrophe is hilarious. Sadly, it's laugh-through-tears.