


More on Entrepreneurship/Creators

Bastian Hasslinger
3 years ago
Before 2021, most startups had excessive valuations. It is currently causing issues.
Higher startup valuations are often favorable for all parties. High valuations show a business's potential. New customers and talent are attracted. They earn respect.
Everyone benefits if a company's valuation rises.
Founders and investors have always been incentivized to overestimate a company's value.
Post-money valuations were inflated by 2021 market expectations and the valuation model's mechanisms.
Founders must understand both levers to handle a normalizing market.
2021, the year of miracles
2021 must've seemed miraculous to entrepreneurs, employees, and VCs. Valuations rose, and funding resumed after the first Covid-19 epidemic caution.
In 2021, VC investments increased from $335B to $643B. 518 new worldwide unicorns vs. 134 in 2020; 951 US IPOs vs. 431.
Things can change quickly, as 2020-21 showed.
Rising interest rates, geopolitical developments, and normalizing technology conditions drive down share prices and tech company market caps in 2022. Zoom, the poster-child of early lockdown success, is down 37% since 1st Jan.
Once-inflated valuations can become a problem in a normalizing market, especially for founders, employees, and early investors.
the reason why startups are always overvalued
To see why inflated valuations are a problem, consider one of its causes.
Private company values only fluctuate following a new investment round, unlike publicly-traded corporations. The startup's new value is calculated simply:
(Latest round share price) x (total number of company shares)
This is the industry standard Post-Money Valuation model.
Let’s illustrate how it works with an example. If a VC invests $10M for 1M shares (at $10/share), and the company has 10M shares after the round, its Post-Money Valuation is $100M (10/share x 10M shares).
This approach might seem like the most natural way to assess a business, but the model often unintentionally overstates the underlying value of the company even if the share price paid by the investor is fair. All shares aren't equal.
New investors in a corporation will always try to minimize their downside risk, or the amount they lose if things go wrong. New investors will try to negotiate better terms and pay a premium.
How the value of a struggling SpaceX increased
SpaceX's 2008 Series D is an example. Despite the financial crisis and unsuccessful rocket launches, the company's Post-Money Valuation was 36% higher after the investment round. Why?
Series D SpaceX shares were protected. In case of liquidation, Series D investors were guaranteed a 2x return before other shareholders.
Due to downside protection, investors were willing to pay a higher price for this new share class.
The Post-Money Valuation model overpriced SpaceX because it viewed all the shares as equal (they weren't).
Why entrepreneurs, workers, and early investors stand to lose the most
Post-Money Valuation is an effective and sufficient method for assessing a startup's valuation, despite not taking share class disparities into consideration.
In a robust market, where the firm valuation will certainly expand with the next fundraising round or exit, the inflated value is of little significance.
Fairness endures. If a corporation leaves at a greater valuation, each stakeholder will receive a proportional distribution. (i.e., 5% of a $100M corporation yields $5M).
SpaceX's inherent overvaluation was never a problem. Had it been sold for less than its Post-Money Valuation, some shareholders, including founders, staff, and early investors, would have seen their ownership drop.
The unforgiving world of 2022
In 2022, founders, employees, and investors who benefited from inflated values will face below-valuation exits and down-rounds.
For them, 2021 will be a curse, not a blessing.
Some tech giants are worried. Klarna's valuation fell from $45B (Oct 21) to $30B (Jun 22), Canvas from $40B to $27B, and GoPuffs from $17B to $8.3B.
Shazam and Blue Apron have to exit or IPO at a cheaper price. Premium share classes are protected, while others receive less. The same goes for bankrupts.
Those who continue at lower valuations will lose reputation and talent. When their value declines by half, generous employee stock options become less enticing, and their ability to return anything is questioned.
What can we infer about the present situation?
Such techniques to enhance your company's value or stop a normalizing market are fiction.
The current situation is a painful reminder for entrepreneurs and a crucial lesson for future firms.
The devastating market fall of the previous six months has taught us one thing:
Keep in mind that any valuation is speculative. Money Post A startup's valuation is a highly simplified approximation of its true value, particularly in the early phases when it lacks significant income or a cutting-edge product. It is merely a projection of the future and a hypothetical meter. Until it is achieved by an exit, a valuation is nothing more than a number on paper.
Assume the value of your company is lower than it was in the past. Your previous valuation might not be accurate now due to substantial changes in the startup financing markets. There is little reason to think that your company's value will remain the same given the 50%+ decline in many newly listed IT companies. Recognize how the market situation is changing and use caution.
Recognize the importance of the stake you hold. Each share class has a unique value that varies. Know the sort of share class you own and how additional contractual provisions affect the market value of your security. Frameworks have been provided by Metrick and Yasuda (Yale & UC) and Gornall and Strebulaev (Stanford) for comprehending the terms that affect investors' cash-flow rights upon withdrawal. As a result, you will be able to more accurately evaluate your firm and determine the worth of each share class.
Be wary of approving excessively protective share terms.
The trade-offs should be considered while negotiating subsequent rounds. Accepting punitive contractual terms could first seem like a smart option in order to uphold your inflated worth, but you should proceed with caution. Such provisions ALWAYS result in misaligned shareholders, with common shareholders (such as you and your staff) at the bottom of the list.

Rick Blyth
3 years ago
Looking for a Reliable Micro SaaS Niche
Niches are rich, as the adage goes.
Micro SaaS requires a great micro-niche; otherwise, it's merely plain old SaaS with a large audience.
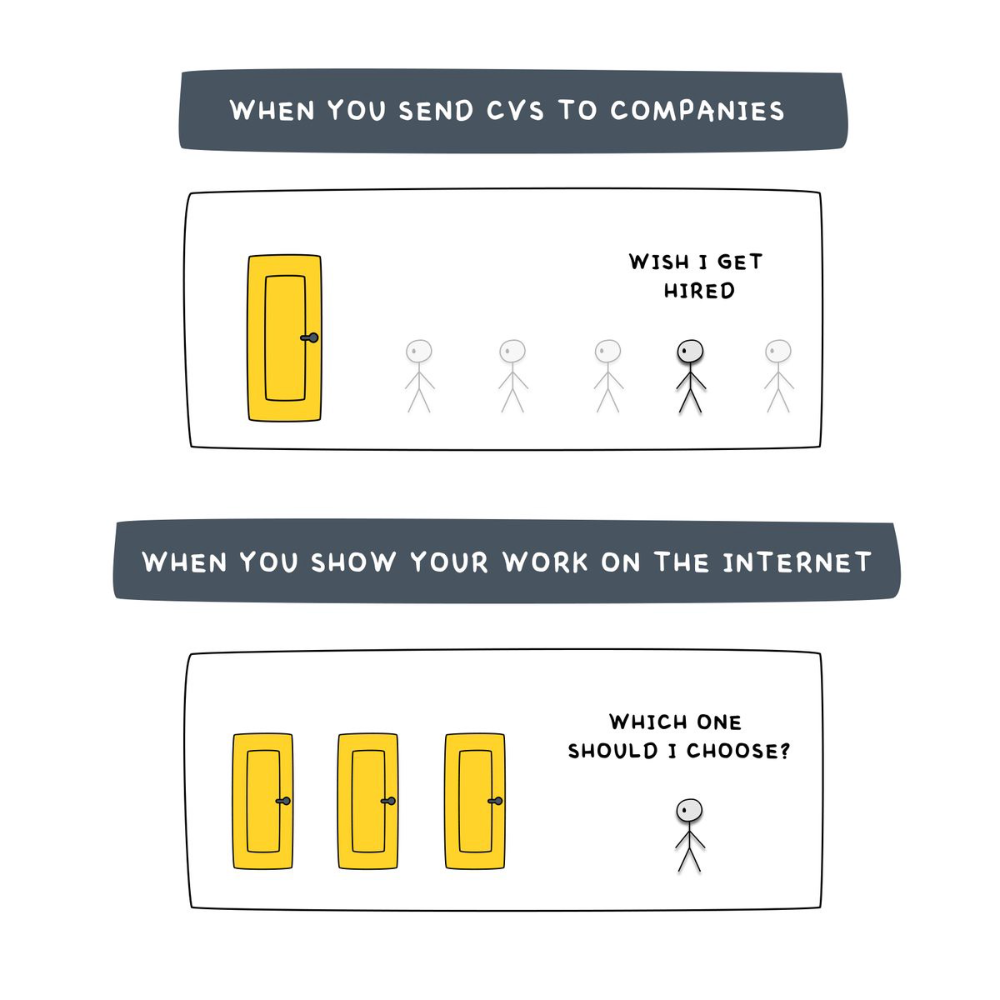
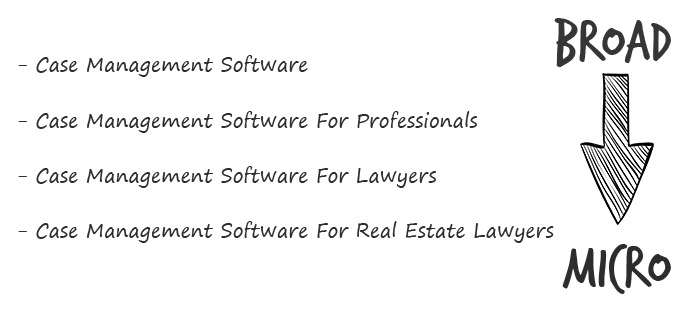
Instead of targeting broad markets with few identifying qualities, specialise down to a micro-niche. How would you target these users?
Better go tiny. You'll locate and engage new consumers more readily and serve them better with a customized solution.
Imagine you're a real estate lawyer looking for a case management solution. Because it's so specific to you, you'd be lured to this link:
instead of below:
Next, locate mini SaaS niches that could work for you. You're not yet looking at the problems/solutions in these areas, merely shortlisting them.
The market should be growing, not shrinking
We shouldn't design apps for a declining niche. We intend to target stable or growing niches for the next 5 to 10 years.
If it's a developing market, you may be able to claim a stake early. You must balance this strategy with safer, longer-established niches (accountancy, law, health, etc).
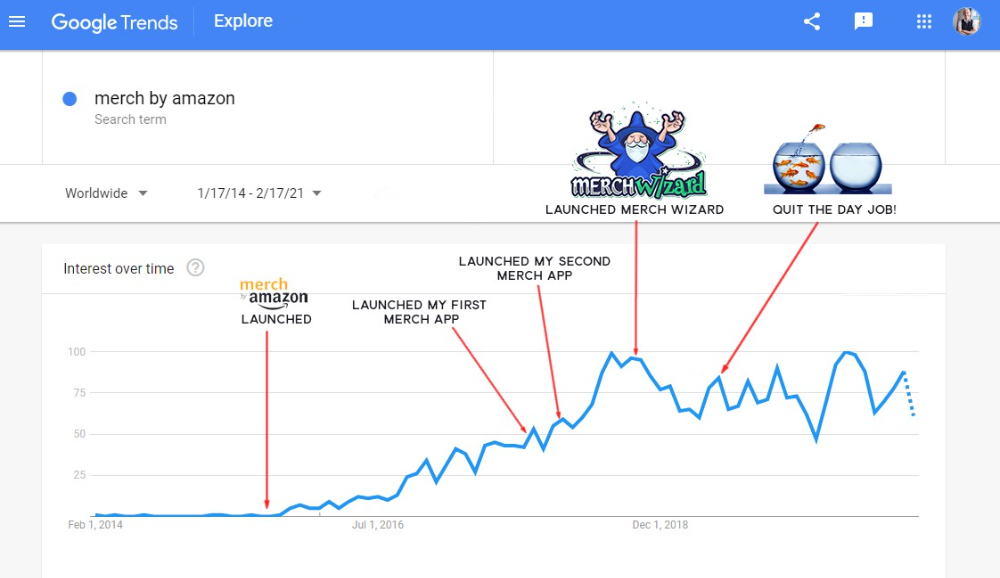
First Micro SaaS apps I designed were for Merch By Amazon creators, a burgeoning niche. I found this niche when searching for passive income.
Graphic designers and entrepreneurs post their art to Amazon to sell on clothes. When Amazon sells their design, they get a royalty. Since 2015, this platform and specialty have grown dramatically.
Amazon doesn't publicize the amount of creators on the platform, but it's possible to approximate by looking at Facebook groups, Reddit channels, etc.
I could see the community growing week by week, with new members joining. Merch was an up-and-coming niche, and designers made money when their designs sold. All I had to do was create tools that let designers focus on making bestselling designs.
Look at the Google Trends graph below to see how this niche has evolved and when I released my apps and resigned my job.
Are the users able to afford the tools?
Who's your average user? Consumer or business? Is your solution budgeted?
If they're students, you'll struggle to convince them to subscribe to your study-system app (ahead of video games and beer).
Let's imagine you designed a Shopify plugin that emails customers when a product is restocked. If your plugin just needs 5 product sales a month to justify its cost, everyone wins (just be mindful that one day Shopify could potentially re-create your plugins functionality within its core offering making your app redundant ).
Do specialized users buy tools? If so, that's comforting. If not, you'd better have a compelling value proposition for your end customer if you're the first.
This should include how much time or money your program can save or make the user.
Are you able to understand the Micro SaaS market?
Ideally, you're already familiar about the industry/niche. Maybe you're fixing a challenge from your day job or freelance work.
If not, evaluate how long it would take to learn the niche's users. Health & Fitness is easier to relate to and understand than hedge fund derivatives trading.
Competing in these complex (and profitable) fields might offer you an edge.
B2C, B2M, or B2B?
Consider your user base's demographics. Will you target businesses, consumers, or both? Let's examine the different consumer types:
B2B refers to business-to-business transactions where customers are other businesses. UpVoty, Plutio, Slingshot, Salesforce, Atlassian, and Hubspot are a few examples of SaaS, ranging from Micro SaaS to SaaS.
Business to Consumer (B2C), in which your clients are people who buy things. For instance, Duolingo, Canva, and Nomad List.
For instance, my tool KDP Wizard has a mixed user base of publishing enterprises and also entrepreneurial consumers selling low-content books on Amazon. This is a case of business to many (B2M), where your users are a mixture of businesses and consumers. There is a large SaaS called Dropbox that offers both personal and business plans.
Targeting a B2B vs. B2C niche is very different. The sales cycle differs.
A B2B sales staff must make cold calls to potential clients' companies. Long sales, legal, and contractual conversations are typically required for each business to get the go-ahead. The cost of obtaining a new customer is substantially more than it is for B2C, despite the fact that the recurring fees are significantly higher.
Since there is typically only one individual making the purchasing decision, B2C signups are virtually always self-service with reduced recurring fees. Since there is typically no outbound sales staff in B2C, acquisition costs are significantly lower than in B2B.
User Characteristics for B2B vs. B2C
Consider where your niche's users congregate if you don't already have a presence there.
B2B users frequent LinkedIn and Twitter. B2C users are on Facebook/Instagram/Reddit/Twitter, etc.
Churn is higher in B2C because consumers haven't gone through all the hoops of a B2B sale. Consumers are more unpredictable than businesses since they let their bank cards exceed limitations or don't update them when they expire.
With a B2B solution, there's a contractual arrangement and the firm will pay the subscription as long as they need it.
Depending on how you feel about the above (sales team vs. income vs. churn vs. targeting), you'll know which niches to pursue.
You ought to respect potential customers.
Would you hang out with customers?
You'll connect with users at conferences (in-person or virtual), webinars, seminars, screenshares, Facebook groups, emails, support calls, support tickets, etc.
If talking to a niche's user base makes you shudder, you're in for a tough road. Whether they're demanding or dull, avoid them if possible.
Merch users are mostly graphic designers, side hustlers, and entrepreneurs. These laid-back users embrace technologies that assist develop their Merch business.
I discovered there was only one annual conference for this specialty, held in Seattle, USA. I decided to organize a conference for UK/European Merch designers, despite never having done so before.
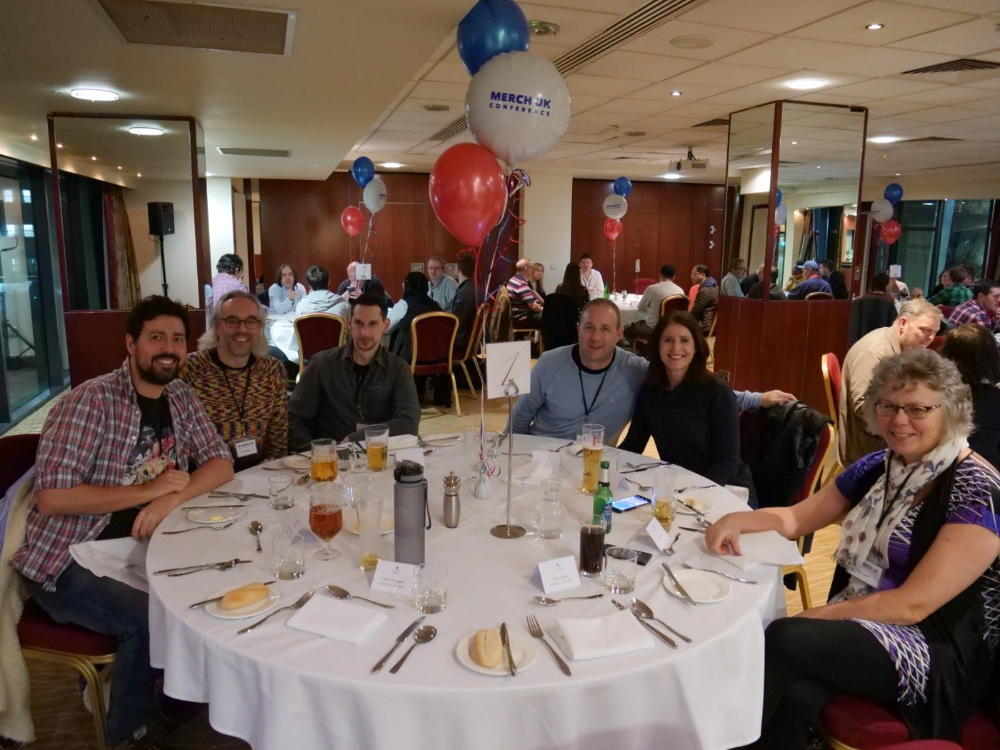
Hosting a conference for over 80 people was stressful, and it turned out to be much bigger than expected, with attendees from the US, Europe, and the UK.
I met many specialized users, built relationships, gained trust, and picked their brains in person. Many of the attendees were already Merch Wizard users, so hearing their feedback and ideas for future features was invaluable.
focused and specific
Instead of building for a generic, hard-to-reach market, target a specific group.
I liken it to fishing in a little, hidden pond. This small pond has only one species of fish, so you learn what bait it likes. Contrast that with trawling for hours to catch as many fish as possible, even if some aren't what you want.
In the case management scenario, it's difficult to target leads because several niches could use the app. Where do your potential customers hang out? Your generic solution: No.
It's easier to join a community of Real Estate Lawyers and see if your software can answer their pain points.
My Success with Micro SaaS
In my case, my Micro SaaS apps have been my chrome extensions. Since I launched them, they've earned me an average $10k MRR, allowing me to quit my lousy full-time job years ago.
I sold my apps after scaling them for a life-changing lump amount. Since then, I've helped unfulfilled software developers escape the 9-5 through Micro SaaS.
Whether it's a profitable side hustle or a liferaft to quit their job and become their own Micro SaaS boss.
Having built my apps to the point where I could quit my job, then scaled and sold them, I feel I can share my skills with software developers worldwide.
Read my free guide on self-funded SaaS to discover more about Micro SaaS, or download your own copy. 12 chapters cover everything from Idea to Exit.
Watch my YouTube video to learn how to construct a Micro SaaS app in 10 steps.

Jared Heyman
3 years ago
The survival and demise of Y Combinator startups
I've written a lot about Y Combinator's success, but as any startup founder or investor knows, many startups fail.
Rebel Fund invests in the top 5-10% of new Y Combinator startups each year, so we focus on identifying and supporting the most promising technology startups in our ecosystem. Given the power law dynamic and asymmetric risk/return profile of venture capital, we worry more about our successes than our failures. Since the latter still counts, this essay will focus on the proportion of YC startups that fail.
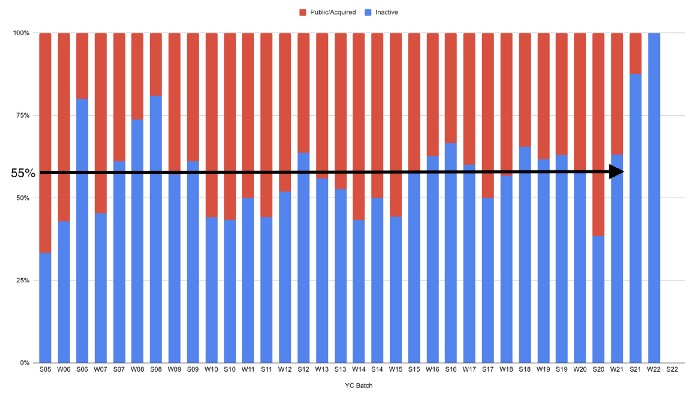
Since YC's launch in 2005, the figure below shows the percentage of active, inactive, and public/acquired YC startups by batch.
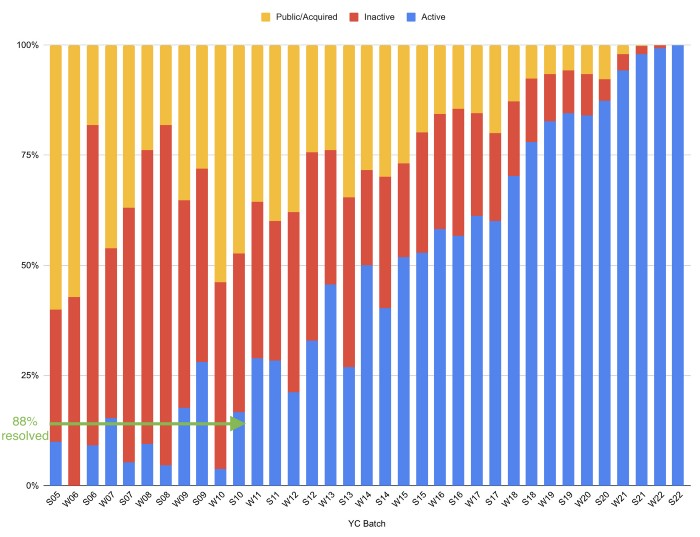
As more startups finish, the blue bars (active) decrease significantly. By 12 years, 88% of startups have closed or exited. Only 7% of startups reach resolution each year.
YC startups by status after 12 years:
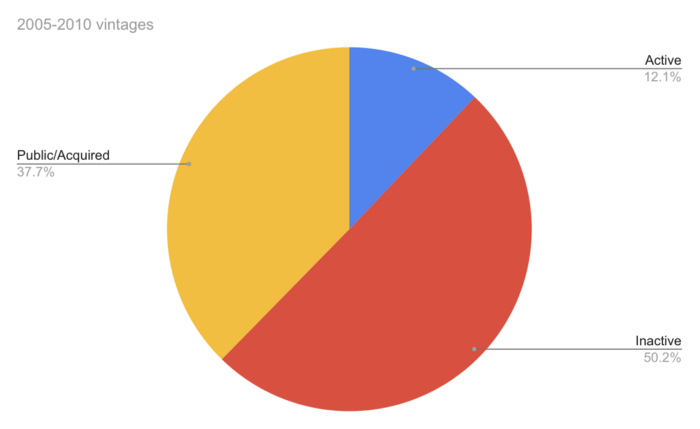
Half the startups have failed, over one-third have exited, and the rest are still operating.
In venture investing, it's said that failed investments show up before successful ones. This is true for YC startups, but only in their early years.
Below, we only present resolved companies from the first chart. Some companies fail soon after establishment, but after a few years, the inactive vs. public/acquired ratio stabilizes around 55:45. After a few years, a YC firm is roughly as likely to quit as fail, which is better than I imagined.
I prepared this post because Rebel investors regularly question me about YC startup failure rates and how long it takes for them to exit or shut down.
Early-stage venture investors can overlook it because 100x investments matter more than 0x investments.
YC founders can ignore it because it shouldn't matter if many of their peers succeed or fail ;)
You might also like

Jeff John Roberts
3 years ago
Jack Dorsey and Jay-Z Launch 'Bitcoin Academy' in Brooklyn rapper's home
The new Bitcoin Academy will teach Jay-Marcy Z's Houses neighbors "What is Cryptocurrency."
Jay-Z grew up in Brooklyn's Marcy Houses. The rapper and Block CEO Jack Dorsey are giving back to his hometown by creating the Bitcoin Academy.
The Bitcoin Academy will offer online and in-person classes, including "What is Money?" and "What is Blockchain?"
The program will provide participants with a mobile hotspot and a small amount of Bitcoin for hands-on learning.
Students will receive dinner and two evenings of instruction until early September. The Shawn Carter Foundation will help with on-the-ground instruction.
Jay-Z and Dorsey announced the program Thursday morning. It will begin at Marcy Houses but may be expanded.
Crypto Blockchain Plug and Black Bitcoin Billionaire, which has received a grant from Block, will teach the classes.
Jay-Z, Dorsey reunite
Jay-Z and Dorsey have previously worked together to promote a Bitcoin and crypto-based future.
In 2021, Dorsey's Block (then Square) acquired the rapper's streaming music service Tidal, which they propose using for NFT distribution.
Dorsey and Jay-Z launched an endowment in 2021 to fund Bitcoin development in Africa and India.
Dorsey is funding the new Bitcoin Academy out of his own pocket (as is Jay-Z), but he's also pushed crypto-related charitable endeavors at Block, including a $5 million fund backed by corporate Bitcoin interest.
This post is a summary. Read full article here

Anton Franzen
3 years ago
This is the driving force for my use of NFTs, which will completely transform the world.
Its not a fuc*ing fad.
It's not about boring monkeys or photos as nfts; that's just what's been pushed up and made a lot of money. The technology underlying those ridiculous nft photos will one day prove your house and automobile ownership and tell you where your banana came from. Are you ready for web3? Soar!
People don't realize that absolutely anything can and will be part of the blockchain and smart contracts, making them even better. I'll tell you a secret: it will and is happening.
Why?
Why is something blockchain-based a good idea? So let’s speak about cars!
So a new Tesla car is manufactured, and when you buy it, it is bound to an NFT on the blockchain that proves current ownership. The NFT in the smart contract can contain some data about the current owner of the car and some data about the car's status, such as the number of miles driven, the car's overall quality, and so on, as well as a reference to a digital document bound to the NFT that has more information.
Now, 40 years from now, if you want to buy a used automobile, you can scan the car's serial number to view its NFT and see all of its history, each owner, how long they owned it, if it had damages, and more. Since it's on the blockchain, it can't be tampered with.
When you're ready to buy it, the owner posts it for sale, you buy it, and it's sent to your wallet. 5 seconds to change owner, 100% safe and verifiable.
Incorporate insurance logic into the car contract. If you crashed, your car's smart contract would take money from your insurance contract and deposit it in an insurance company wallet.
It's limitless. Your funds may be used by investors to provide insurance as they profit from everyone's investments.
Or suppose all car owners in a country deposit a fixed amount of money into an insurance smart contract that promises if something happens, we'll take care of it. It could be as little as $100-$500 per year, and in a country with 10 million people, maybe 3 million would do that, which would be $500 000 000 in that smart contract and it would be used by the insurance company to invest in assets or take a cut, literally endless possibilities.
Instead of $300 per month, you may pay $300 per year to be covered if something goes wrong, and that may include multiple insurances.
What about your grocery store banana, though?
Yes that too.
You can scan a banana to learn its complete history. You'll be able to see where it was cultivated, every middleman in the supply chain, and hopefully the banana's quality, farm, and ingredients used.
If you want locally decent bananas, you can only buy them, offering you transparency and options. I believe it will be an online marketplace where farmers publish their farms and products for trust and transparency. You might also buy bananas from the farmer.
And? Food security to finish the article. If an order of bananas included a toxin, you could easily track down every banana from the same origin and supply chain and uncover the root cause. This is a tremendous thing that will save lives and have a big impact; did you realize that 1 in 6 Americans gets poisoned by food every year? This could lower the number.
To summarize:
Smart contracts can issue nfts as proof of ownership and include functionality.

Jack Burns
3 years ago
Here's what to expect from NASA Artemis 1 and why it's significant.
NASA's Artemis 1 mission will help return people to the Moon after a half-century break. The mission is a shakedown cruise for NASA's Space Launch System and Orion Crew Capsule.
The spaceship will visit the Moon, deploy satellites, and enter orbit. NASA wants to practice operating the spacecraft, test the conditions people will face on the Moon, and ensure a safe return to Earth.
We asked Jack Burns, a space scientist at the University of Colorado Boulder and former member of NASA's Presidential Transition Team, to describe the mission, explain what the Artemis program promises for space exploration, and reflect on how the space program has changed in the half-century since humans last set foot on the moon.
What distinguishes Artemis 1 from other rockets?
Artemis 1 is the Space Launch System's first launch. NASA calls this a "heavy-lift" vehicle. It will be more powerful than Apollo's Saturn V, which transported people to the Moon in the 1960s and 1970s.
It's a new sort of rocket system with two strap-on solid rocket boosters from the space shuttle. It's a mix of the shuttle and Saturn V.
The Orion Crew Capsule will be tested extensively. It'll spend a month in the high-radiation Moon environment. It will also test the heat shield, which protects the capsule and its occupants at 25,000 mph. The heat shield must work well because this is the fastest capsule descent since Apollo.
This mission will also carry miniature Moon-orbiting satellites. These will undertake vital precursor science, including as examining further into permanently shadowed craters where scientists suspect there is water and measuring the radiation environment to see long-term human consequences.
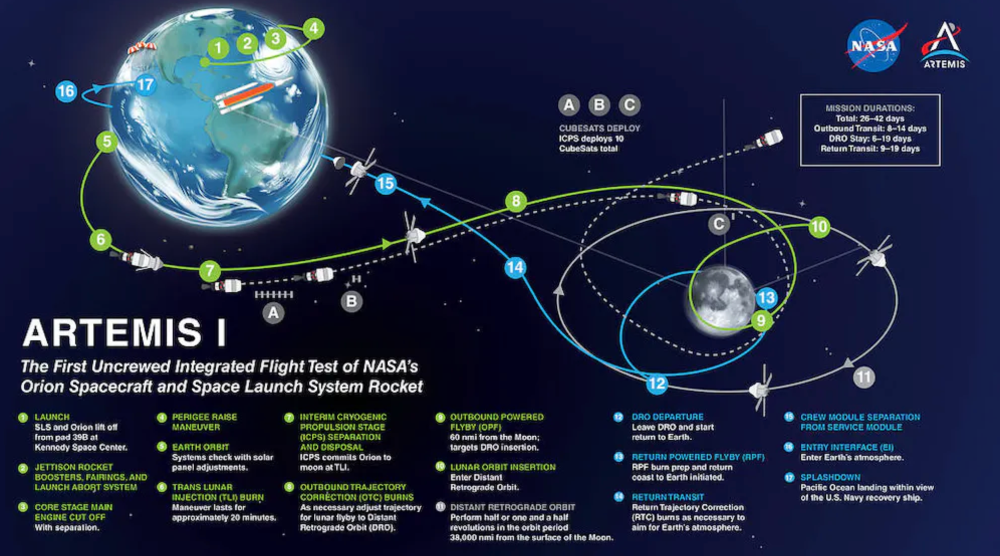
Artemis 1 will launch, fly to the Moon, place satellites, orbit it, return to Earth, and splash down in the ocean. NASA.
What's Artemis's goal? What launches are next?
The mission is a first step toward Artemis 3, which will lead to the first human Moon missions since 1972. Artemis 1 is unmanned.
Artemis 2 will have astronauts a few years later. Like Apollo 8, it will be an orbital mission that circles the Moon and returns. The astronauts will orbit the Moon longer and test everything with a crew.
Eventually, Artemis 3 will meet with the SpaceX Starship on the Moon's surface and transfer people. Orion will stay in orbit while the lunar Starship lands astronauts. They'll go to the Moon's south pole to investigate the water ice there.
Artemis is reminiscent of Apollo. What's changed in 50 years?
Kennedy wanted to beat the Soviets to the Moon with Apollo. The administration didn't care much about space flight or the Moon, but the goal would place America first in space and technology.
You live and die by the sword if you do that. When the U.S. reached the Moon, it was over. Russia lost. We planted flags and did science experiments. Richard Nixon canceled the program after Apollo 11 because the political goals were attained.
Large rocket with two boosters between two gates
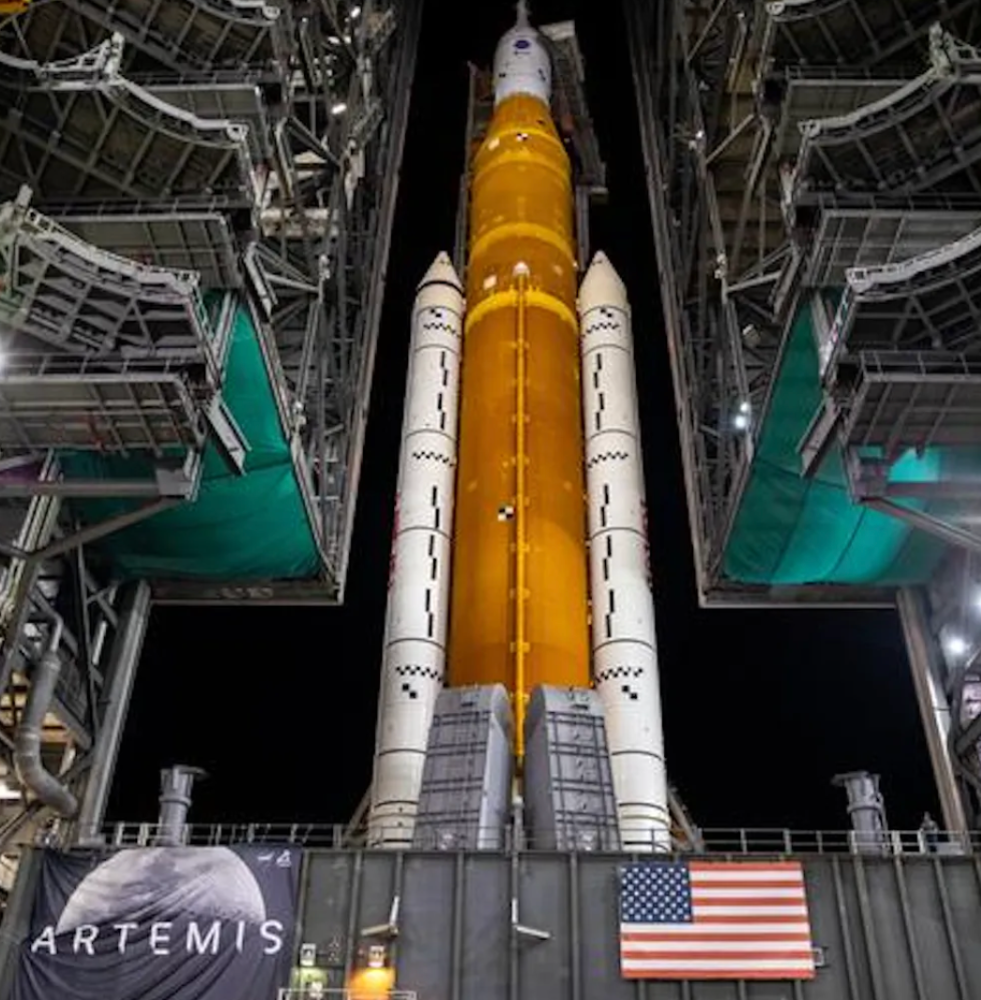
NASA's new Space Launch System is brought to a launchpad. NASA
50 years later... It's quite different. We're not trying to beat the Russians, Chinese, or anyone else, but to begin sustainable space exploration.
Artemis has many goals. It includes harnessing in-situ resources like water ice and lunar soil to make food, fuel, and building materials.
SpaceX is part of this first journey to the Moon's surface, therefore the initiative is also helping to develop a lunar and space economy. NASA doesn't own the Starship but is buying seats for astronauts. SpaceX will employ Starship to transport cargo, private astronauts, and foreign astronauts.
Fifty years of technology advancement has made getting to the Moon cheaper and more practical, and computer technology allows for more advanced tests. 50 years of technological progress have changed everything. Anyone with enough money can send a spacecraft to the Moon, but not humans.
Commercial Lunar Payload Services engages commercial companies to develop uncrewed Moon landers. We're sending a radio telescope to the Moon in January. Even 10 years ago, that was impossible.
Since humans last visited the Moon 50 years ago, technology has improved greatly.
What other changes does Artemis have in store?
The government says Artemis 3 will have at least one woman and likely a person of color.
I'm looking forward to seeing more diversity so young kids can say, "Hey, there's an astronaut that looks like me. I can do this. I can be part of the space program.”