


More on Personal Growth

Tim Denning
3 years ago
Read These Books on Personal Finance to Boost Your Net Worth
And retire sooner.

Books can make you filthy rich.
If you apply what you learn. In 2011, I was broke and had broken dreams.
Someone suggested I read finance books. One Up On Wall Street was his first recommendation.
Finance books were my crack.
I've read every money book since then. Some are good, but most stink.
These books will make you rich.
The Almanack of Naval Ravikant by Eric Jorgenson
This isn't a cliche book.
This book was inspired by a How to Get Rich tweet thread.
It’s one of the best tweets I’ve ever read.
Naval thinks differently. He nukes ordinary ideas. I've never heard better money advice.
Eric Jorgenson wrote a book about this tweet thread with Navals permission. A must-read, easy-to-digest book.
Best quote
Seek wealth, not money or status. Wealth is having assets that earn while you sleep. Money is how we transfer time and wealth. Status is your place in the social hierarchy — Naval
Morgan Housel's The Psychology of Money
Many finance books advise investing like a dunce.
They almost all peddle the buy an index fund BS. Different book.
It's about money-making psychology. Because any fool can get rich and drunk on their ego. Few can consistently make money.
Each chapter is short. A single-page chapter breaks all book publishing rules.
Best quote
Spending money to show people how much money you have is the fastest way to have less money — Morgan Housel
J.L. Collins' The Simple Path to Wealth
Most of the best money books were written by bloggers.
JL Collins blogs. This easy-to-read book was written for his daughter.
This book popularized the phrase F You Money. With enough money in your bank account and investment portfolio, you can say F You more.
A bad boss is an example. You can leave instead of enduring his wrath.
You can then sit at home and look for another job while financially secure. JL says its mind-freedom is powerful.
Best phrasing
You own the things you own and they in turn own you — J.L. Collins
Tony Robbins' Unshakeable
I like Tony. This book makes me sweaty.
Tony interviews the world's top financiers. He interviews people who rarely do so.
This book taught me all-weather portfolio. It's a way to invest in different asset classes in good, bad, recession, or depression times.
Look at it:
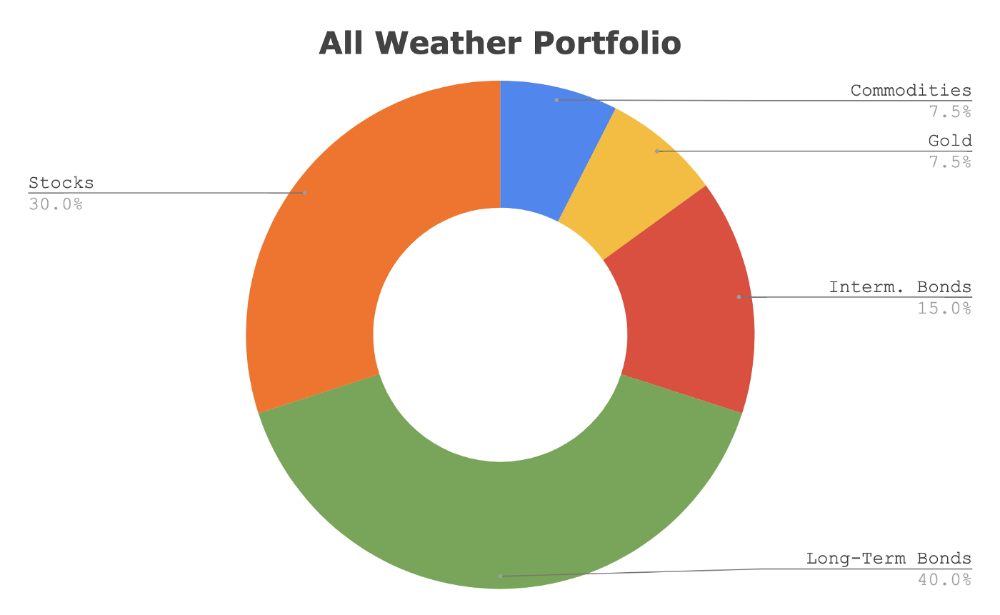
Investing isn’t about buying one big winner — that’s gambling. It’s about investing in a diversified portfolio of assets.
Best phrasing
The best opportunities come in times of maximum pessimism — Tony Robbins
Ben Graham's The Intelligent Investor
This book helped me distinguish between a spectator and an investor.
Spectators are those who shout that crypto, NFTs, or XYZ platform will die.
Tourists. They want attention and to say "I told you so." They make short-term and long-term predictions like fortunetellers. LOL. Idiots.
Benjamin Graham teaches smart investing. You'll buy a long-term asset. To be confident in recessions, use dollar-cost averaging.
Best phrasing
Those who do not remember the past are condemned to repeat it. — Benjamin Graham
The Napoleon Hill book Think and Grow Rich
This classic book introduced positive thinking to modern self-help.
Lazy pessimists can't become rich. No way.
Napoleon said, "Thoughts create reality."
No surprise that he discusses obsession and focus in this book. They are the fastest ways to make more money to invest in time and wealth-protecting assets.
Best phrasing
The starting point of all achievement is DESIRE. Keep this constantly in mind. Weak desire brings weak results, just as a small fire makes a small amount of heat — Napoleon Hill
Ramit Sethi's book I Will Teach You To Be Rich
This book is mostly good. The part about credit cards is trash.
Avoid credit card temptations. I don't care about their airline points.
This book teaches you to master money basics (that many people mess up) then automate it so your monkey brain doesn't ruin your financial future.
The book includes great negotiation tactics to help you make more money in less time.
Best quote
The 85 Percent Solution: Getting started is more important than becoming an expert — Ramit Sethi
David Bach's The Automatic Millionaire
You've probably met a six- or seven-figure earner who's broke. All their money goes to useless things like cars.
Money isn't as essential as what you do with it. David teaches how to automate your earnings for more money.
Compounding works once investing is automated. So you get rich.
His strategy eliminates luck and (almost) guarantees millionaire status.
Best phrasing
Every time you earn one dollar, make sure to pay yourself first — David Bach
Thomas J. Stanley's The Millionaire Next Door
Thomas defies the definition of rich.
He spends much of the book highlighting millionaire traits he's studied.
Rich people are quiet, so you wouldn't know they're wealthy. They don't earn much money or drive a BMW.
Thomas will give you the math to get started.
Best phrasing
I am not impressed with what people own. But I’m impressed with what they achieve. I’m proud to be a physician. Always strive to be the best in your field…. Don’t chase money. If you are the best in your field, money will find you. — Thomas J. Stanley
by Bill Perkins "Die With Zero"
Let’s end with one last book.
Bill's book angered many people. He says we spend too much time saving for retirement and die rich. That bank money is lost time.
Your grandkids could use the money. When children inherit money, they become lazy, entitled a-holes.
Bill wants us to spend our money on life-enhancing experiences. Stop saving money like monopoly monkeys.
Best phrasing
You should be focusing on maximizing your life enjoyment rather than on maximizing your wealth. Those are two very different goals. Money is just a means to an end: Having money helps you to achieve the more important goal of enjoying your life. But trying to maximize money actually gets in the way of achieving the more important goal — Bill Perkins

Neeramitra Reddy
3 years ago
The best life advice I've ever heard could very well come from 50 Cent.
He built a $40M hip-hop empire from street drug dealing.
50 Cent was nearly killed by 9mm bullets.
Before 50 Cent, Curtis Jackson sold drugs.
He sold coke to worried addicts after being orphaned at 8.
Pursuing police. Murderous hustlers and gangs. Unwitting informers.
Despite his hard life, his hip-hop career was a success.
An assassination attempt ended his career at the start.
What sane producer would want to deal with a man entrenched in crime?
Most would have drowned in self-pity and drank themselves to death.
But 50 Cent isn't most people. Life on the streets had given him fearlessness.
“Having a brush with death, or being reminded in a dramatic way of the shortness of our lives, can have a positive, therapeutic effect. So it is best to make every moment count, to have a sense of urgency about life.” ― 50 Cent, The 50th Law
50 released a series of mixtapes that caught Eminem's attention and earned him a $50 million deal!
50 Cents turned death into life.
Things happen; that is life.
We want problems solved.
Every human has problems, whether it's Jeff Bezos swimming in his billions, Obama in his comfortable retirement home, or Dan Bilzerian with his hired bikini models.
All problems.
Problems churn through life. solve one, another appears.
It's harsh. Life's unfair. We can face reality or run from it.
The latter will worsen your issues.
“The firmer your grasp on reality, the more power you will have to alter it for your purposes.” — 50 Cent, The 50th Law
In a fantasy-obsessed world, 50 Cent loves reality.
Wish for better problem-solving skills rather than problem-free living.
Don't wish, work.
We All Have the True Power of Alchemy
Humans are arrogant enough to think the universe cares about them.
That things happen as if the universe notices our nanosecond existences.
Things simply happen. Period.
By changing our perspective, we can turn good things bad.
The alchemists' search for the philosopher's stone may have symbolized the ability to turn our lead-like perceptions into gold.
Negativity bias tints our perceptions.
Normal sparring broke your elbow? Rest and rethink your training. Fired? You can improve your skills and get a better job.
Consider Curtis if he had fallen into despair.
The legend we call 50 Cent wouldn’t have existed.
The Best Lesson in Life Ever?
Neither avoid nor fear your reality.
That simple sentence contains every self-help tip and life lesson on Earth.
When reality is all there is, why fear it? avoidance?
Or worse, fleeing?
To accept reality, we must eliminate the words should be, could be, wish it were, and hope it will be.
It is. Period.
Only by accepting reality's chaos can you shape your life.
“Behind me is infinite power. Before me is endless possibility, around me is boundless opportunity. My strength is mental, physical and spiritual.” — 50 Cent
Matthew Royse
3 years ago
7 ways to improve public speaking
How to overcome public speaking fear and give a killer presentation
"Public speaking is people's biggest fear, according to studies. Death's second. The average person is better off in the casket than delivering the eulogy." — American comedian, actor, writer, and producer Jerry Seinfeld
People fear public speaking, according to research. Public speaking can be intimidating.
Most professions require public speaking, whether to 5, 50, 500, or 5,000 people. Your career will require many presentations. In a small meeting, company update, or industry conference.
You can improve your public speaking skills. You can reduce your anxiety, improve your performance, and feel more comfortable speaking in public.
“If I returned to college, I'd focus on writing and public speaking. Effective communication is everything.” — 38th president Gerald R. Ford
You can deliver a great presentation despite your fear of public speaking. There are ways to stay calm while speaking and become a more effective public speaker.
Seven tips to improve your public speaking today. Let's help you overcome your fear (no pun intended).
Know your audience.
"You're not being judged; the audience is." — Entrepreneur, author, and speaker Seth Godin
Understand your audience before speaking publicly. Before preparing a presentation, know your audience. Learn what they care about and find useful.
Your presentation may depend on where you're speaking. A classroom is different from a company meeting.
Determine your audience before developing your main messages. Learn everything about them. Knowing your audience helps you choose the right words, information (thought leadership vs. technical), and motivational message.
2. Be Observant
Observe others' speeches to improve your own. Watching free TED Talks on education, business, science, technology, and creativity can teach you a lot about public speaking.
What worked and what didn't?
What would you change?
Their strengths
How interesting or dull was the topic?
Note their techniques to learn more. Studying the best public speakers will amaze you.
Learn how their stage presence helped them communicate and captivated their audience. Please note their pauses, humor, and pacing.
3. Practice
"A speaker should prepare based on what he wants to learn, not say." — Author, speaker, and pastor Tod Stocker
Practice makes perfect when it comes to public speaking. By repeating your presentation, you can find your comfort zone.
When you've practiced your presentation many times, you'll feel natural and confident giving it. Preparation helps overcome fear and anxiety. Review notes and important messages.
When you know the material well, you can explain it better. Your presentation preparation starts before you go on stage.
Keep a notebook or journal of ideas, quotes, and examples. More content means better audience-targeting.
4. Self-record
Videotape your speeches. Check yourself. Body language, hands, pacing, and vocabulary should be reviewed.
Best public speakers evaluate their performance to improve.
Write down what you did best, what you could improve and what you should stop doing after watching a recording of yourself. Seeing yourself can be unsettling. This is how you improve.
5. Remove text from slides
"Humans can't read and comprehend screen text while listening to a speaker. Therefore, lots of text and long, complete sentences are bad, bad, bad.” —Communications expert Garr Reynolds
Presentation slides shouldn't have too much text. 100-slide presentations bore the audience. Your slides should preview what you'll say to the audience.
Use slides to emphasize your main point visually.
If you add text, use at least 40-point font. Your slides shouldn't require squinting to read. You want people to watch you, not your slides.
6. Body language
"Body language is powerful." We had body language before speech, and 80% of a conversation is read through the body, not the words." — Dancer, writer, and broadcaster Deborah Bull
Nonverbal communication dominates. Our bodies speak louder than words. Don't fidget, rock, lean, or pace.
Relax your body to communicate clearly and without distraction through nonverbal cues. Public speaking anxiety can cause tense body language.
Maintain posture and eye contact. Don’t put your hand in your pockets, cross your arms, or stare at your notes. Make purposeful hand gestures that match what you're saying.
7. Beginning/ending Strong
Beginning and end are memorable. Your presentation must start strong and end strongly. To engage your audience, don't sound robotic.
Begin with a story, stat, or quote. Conclude with a summary of key points. Focus on how you will start and end your speech.
You should memorize your presentation's opening and closing. Memorize something naturally. Excellent presentations start and end strong because people won't remember the middle.
Bringing It All Together
Seven simple yet powerful ways to improve public speaking. Know your audience, study others, prepare and rehearse, record yourself, remove as much text as possible from slides, and start and end strong.
Follow these tips to improve your speaking and audience communication. Prepare, practice, and learn from great speakers to reduce your fear of public speaking.
"Speaking to one person or a thousand is public speaking." — Vocal coach Roger Love
You might also like

DANIEL CLERY
3 years ago
Can space-based solar power solve Earth's energy problems?
Better technology and lower launch costs revive science-fiction tech.
Airbus engineers showed off sustainable energy's future in Munich last month. They captured sunlight with solar panels, turned it into microwaves, and beamed it into an airplane hangar, where it lighted a city model. The test delivered 2 kW across 36 meters, but it posed a serious question: Should we send enormous satellites to capture solar energy in space? In orbit, free of clouds and nighttime, they could create power 24/7 and send it to Earth.
Airbus engineer Jean-Dominique Coste calls it an engineering problem. “But it’s never been done at [large] scale.”
Proponents of space solar power say the demand for green energy, cheaper space access, and improved technology might change that. Once someone invests commercially, it will grow. Former NASA researcher John Mankins says it might be a trillion-dollar industry.
Myriad uncertainties remain, including whether beaming gigawatts of power to Earth can be done efficiently and without burning birds or people. Concept papers are being replaced with ground and space testing. The European Space Agency (ESA), which supported the Munich demo, will propose ground tests to member nations next month. The U.K. government offered £6 million to evaluate innovations this year. Chinese, Japanese, South Korean, and U.S. agencies are working. NASA policy analyst Nikolai Joseph, author of an upcoming assessment, thinks the conversation's tone has altered. What formerly appeared unattainable may now be a matter of "bringing it all together"
NASA studied space solar power during the mid-1970s fuel crunch. A projected space demonstration trip using 1970s technology would have cost $1 trillion. According to Mankins, the idea is taboo in the agency.
Space and solar power technology have evolved. Photovoltaic (PV) solar cell efficiency has increased 25% over the past decade, Jones claims. Telecoms use microwave transmitters and receivers. Robots designed to repair and refuel spacecraft might create solar panels.
Falling launch costs have boosted the idea. A solar power satellite large enough to replace a nuclear or coal plant would require hundreds of launches. ESA scientist Sanjay Vijendran: "It would require a massive construction complex in orbit."
SpaceX has made the idea more plausible. A SpaceX Falcon 9 rocket costs $2600 per kilogram, less than 5% of what the Space Shuttle did, and the company promised $10 per kilogram for its giant Starship, slated to launch this year. Jones: "It changes the equation." "Economics rules"
Mass production reduces space hardware costs. Satellites are one-offs made with pricey space-rated parts. Mars rover Perseverance cost $2 million per kilogram. SpaceX's Starlink satellites cost less than $1000 per kilogram. This strategy may work for massive space buildings consisting of many identical low-cost components, Mankins has long contended. Low-cost launches and "hypermodularity" make space solar power economical, he claims.
Better engineering can improve economics. Coste says Airbus's Munich trial was 5% efficient, comparing solar input to electricity production. When the Sun shines, ground-based solar arrays perform better. Studies show space solar might compete with existing energy sources on price if it reaches 20% efficiency.
Lighter parts reduce costs. "Sandwich panels" with PV cells on one side, electronics in the middle, and a microwave transmitter on the other could help. Thousands of them build a solar satellite without heavy wiring to move power. In 2020, a team from the U.S. Naval Research Laboratory (NRL) flew on the Air Force's X-37B space plane.
NRL project head Paul Jaffe said the satellite is still providing data. The panel converts solar power into microwaves at 8% efficiency, but not to Earth. The Air Force expects to test a beaming sandwich panel next year. MIT will launch its prototype panel with SpaceX in December.
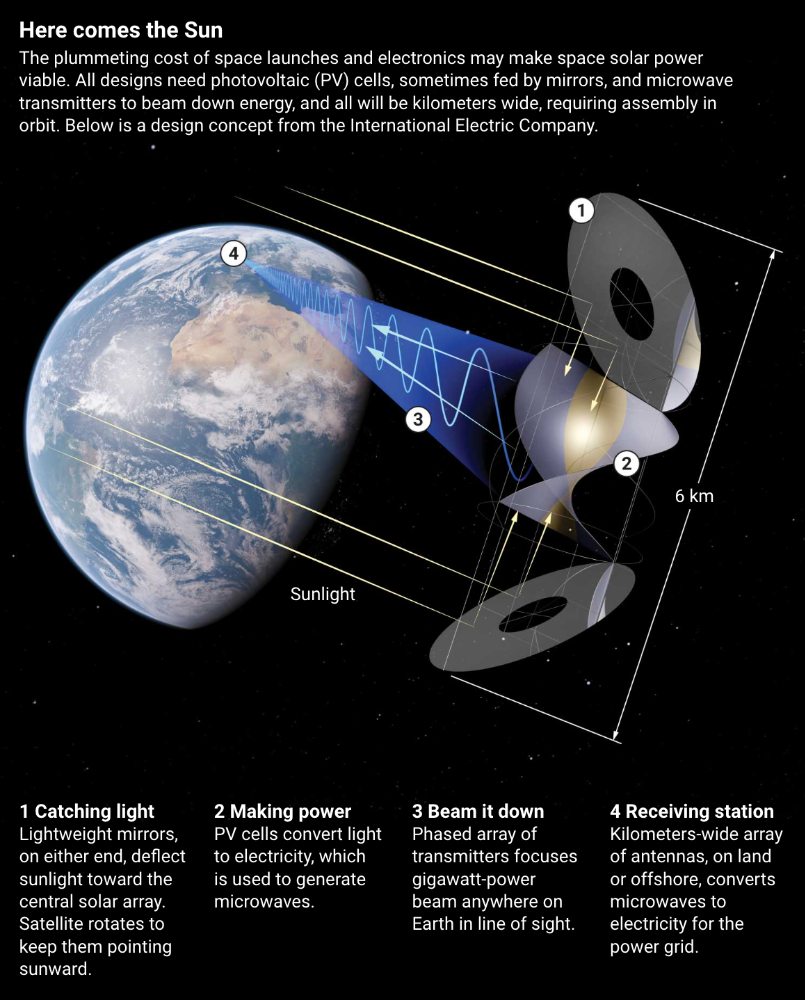
As a satellite orbits, the PV side of sandwich panels sometimes faces away from the Sun since the microwave side must always face Earth. To maintain 24-hour power, a satellite needs mirrors to keep that side illuminated and focus light on the PV. In a 2012 NASA study by Mankins, a bowl-shaped device with thousands of thin-film mirrors focuses light onto the PV array.
International Electric Company's Ian Cash has a new strategy. His proposed satellite uses enormous, fixed mirrors to redirect light onto a PV and microwave array while the structure spins (see graphic, above). 1 billion minuscule perpendicular antennas act as a "phased array" to electronically guide the beam toward Earth, regardless of the satellite's orientation. This design, argues Cash, is "the most competitive economically"
If a space-based power plant ever flies, its power must be delivered securely and efficiently. Jaffe's team at NRL just beamed 1.6 kW over 1 km, and teams in Japan, China, and South Korea have comparable attempts. Transmitters and receivers lose half their input power. Vijendran says space solar beaming needs 75% efficiency, "preferably 90%."
Beaming gigawatts through the atmosphere demands testing. Most designs aim to produce a beam kilometers wide so every ship, plane, human, or bird that strays into it only receives a tiny—hopefully harmless—portion of the 2-gigawatt transmission. Receiving antennas are cheap to build but require a lot of land, adds Jones. You could grow crops under them or place them offshore.
Europe's public agencies currently prioritize space solar power. Jones: "There's a devotion you don't see in the U.S." ESA commissioned two solar cost/benefit studies last year. Vijendran claims it might match ground-based renewables' cost. Even at a higher price, equivalent to nuclear, its 24/7 availability would make it competitive.
ESA will urge member states in November to fund a technical assessment. If the news is good, the agency will plan for 2025. With €15 billion to €20 billion, ESA may launch a megawatt-scale demonstration facility by 2030 and a gigawatt-scale facility by 2040. "Moonshot"

Chris Newman
3 years ago
Clean Food: Get Over Yourself If You Want to Save the World.

I’m a permaculture farmer. I want to create food-producing ecosystems. My hope is a world with easy access to a cuisine that nourishes consumers, supports producers, and leaves the Earth joyously habitable.
Permaculturists, natural farmers, plantsmen, and foodies share this ambition. I believe this group of green thumbs, stock-folk, and food champions is falling to tribalism, forgetting that rescuing the globe requires saving all of its inhabitants, even those who adore cheap burgers and Coke. We're digging foxholes and turning folks who disagree with us or don't understand into monsters.
Take Dr. Daphne Miller's comments at the end of her Slow Money Journal interview:
“Americans are going to fall into two camps when all is said and done: People who buy cheap goods, regardless of quality, versus people who are willing and able to pay for things that are made with integrity. We are seeing the limits of the “buying cheap crap” approach.”
This is one of the most judgmental things I've read outside the Bible. Consequences:
People who purchase inexpensive things (food) are ignorant buffoons who prefer to choose fair trade coffee over fuel as long as the price is correct.
It all depends on your WILL to buy quality or cheaply. Both those who are WILLING and those who ARE NOT exist. And able, too.
People who are unwilling and unable are purchasing garbage. You're giving your kids bad food. Both the Earth and you are being destroyed by your actions. Your camp is the wrong one. You’re garbage! Disgrace to you.
Dr. Miller didn't say it, but words are worthless until interpreted. This interpretation depends on the interpreter's economic, racial, political, religious, family, and personal history. Complementary language insults another. Imagine how that Brown/Harvard M.D.'s comment sounds to a low-income household with no savings.
Dr. Miller's comment reflects the echo chamber into which nearly all clean food advocates speak. It asks easy questions and accepts non-solutions like raising food prices and eating less meat. People like me have cultivated an insular world unencumbered by challenges beyond the margins. We may disagree about technical details in rotationally-grazing livestock, but we short circuit when asked how our system could supply half the global beef demand. Most people have never seriously considered this question. We're so loved and affirmed that challenging ourselves doesn't seem necessary. Were generals insisting we don't need to study the terrain because God is on our side?
“Yes, the $8/lb ground beef is produced the way it should be. Yes, it’s good for my body. Yes it’s good for the Earth. But it’s eight freaking dollars, and my kid needs braces and protein. Bye Felicia, we’re going to McDonald’s.”
-Bobby Q. Homemaker
Funny clean foodies. People don't pay enough for food; they should value it more. Turn the concept of buying food with integrity into a wedge and drive it into the heart of America, dividing the willing and unwilling.
We go apeshit if you call our products high-end.
I've heard all sorts of gaslighting to defend a $10/lb pork chop as accessible (things I’ve definitely said in the past):
At Whole Foods, it costs more.
The steak at the supermarket is overly affordable.
Pay me immediately or the doctor gets paid later.
I spoke with Timbercreek Market and Local Food Hub in front of 60 people. We were asked about local food availability.
They came to me last, after my co-panelists gave the same responses I would have given two years before.
I grumbled, "Our food is inaccessible." Nope. It's beyond the wallets of nearly everyone, and it's the biggest problem with sustainable food systems. We're criminally unserious about being leaders in sustainability until we propose solutions beyond economic relativism, wishful thinking, and insisting that vulnerable, distracted people do all the heavy lifting of finding a way to afford our food. And until we talk about solutions, all this preserve the world? False.
The room fell silent as if I'd revealed a terrible secret. Long, thunderous applause followed my other remarks. But I’m probably not getting invited back to any VNRLI events.
I make pricey cuisine. It’s high-end. I have customers who really have to stretch to get it, and they let me know it. They're forgoing other creature comforts to help me make a living and keep the Earth of my grandmothers alive, and they're doing it as an act of love. They believe in us and our work.
I remember it when I'm up to my shoulders in frigid water, when my vehicle stinks of four types of shit, when I come home covered in blood and mud, when I'm hauling water in 100-degree heat, when I'm herding pigs in a rainstorm and dodging lightning bolts to close the chickens. I'm reminded I'm not alone. Their enthusiasm is worth more than money; it helps me make a life and a living. I won't label that gift less than it is to make my meal seem more accessible.
Not everyone can sacrifice.
Let's not pretend we want to go back to peasant fare, despite our nostalgia. Industrial food has leveled what rich and poor eat. How food is cooked will be the largest difference between what you and a billionaire eat. Rich and poor have access to chicken, pork, and beef. You might be shocked how recently that wasn't the case. This abundance, particularly of animal protein, has helped vulnerable individuals.
Industrial food causes environmental damage, chronic disease, and distribution inequities. Clean food promotes non-industrial, artisan farming. This creates a higher-quality, more expensive product than the competition; we respond with aggressive marketing and the "people need to value food more" shtick geared at consumers who can spend the extra money.
The guy who is NOT able is rendered invisible by clean food's elitist marketing, which is bizarre given a.) clean food insists it's trying to save the world, yet b.) MOST PEOPLE IN THE WORLD ARE THAT GUY. No one can help him except feel-good charities. That's crazy.
Also wrong: a foodie telling a kid he can't eat a 99-cent fast food hamburger because it lacks integrity. Telling him how easy it is to save his ducketts and maybe have a grass-fed house burger at the end of the month as a reward, but in the meantime get your protein from canned beans you can't bake because you don't have a stove and, even if you did, your mom works two jobs and moonlights as an Uber driver so she doesn't have time to heat that shitup anyway.
A wealthy person's attitude toward the poor is indecent. It's 18th-century Versailles.
Human rights include access to nutritious food without social or environmental costs. As a food-forest-loving permaculture farmer, I no longer balk at the concept of cultured beef and hydroponics. My food is out of reach for many people, but access to decent food shouldn't be. Cultures and hydroponics could scale to meet the clean food affordability gap without externalities. If technology can deliver great, affordable beef without environmental negative effects, I can't reject it because it's new, unusual, or might endanger my business.
Why is your farm needed if cultured beef and hydroponics can feed the world? Permaculture food forests with trees, perennial plants, and animals are crucial to economically successful environmental protection. No matter how advanced technology gets, we still need clean air, water, soil, greenspace, and food.
Clean Food cultivated in/on live soil, minimally processed, and eaten close to harvest is part of the answer, not THE solution. Clean food advocates must recognize the conflicts at the intersection of environmental, social, and economic sustainability, the disproportionate effects of those conflicts on the poor and lower-middle classes, and the immorality and impracticality of insisting vulnerable people address those conflicts on their own and judging them if they don't.
Our clients, relatives, friends, and communities need an honest assessment of our role in a sustainable future. If we're serious about preserving the world, we owe honesty to non-customers. We owe our goal and sanity to honesty. Future health and happiness of the world left to the average person's pocketbook and long-term moral considerations is a dismal proposition with few parallels.
Let's make soil and grow food. Let the lab folks do their thing. We're all interdependent.
Max Chafkin
3 years ago
Elon Musk Bets $44 Billion on Free Speech's Future
Musk’s purchase of Twitter has sealed his bond with the American right—whether the platform’s left-leaning employees and users like it or not.
Elon Musk's pursuit of Twitter Inc. began earlier this month as a joke. It started slowly, then spiraled out of control, culminating on April 25 with the world's richest man agreeing to spend $44 billion on one of the most politically significant technology companies ever. There have been bigger financial acquisitions, but Twitter's significance has always outpaced its balance sheet. This is a unique Silicon Valley deal.
To recap: Musk announced in early April that he had bought a stake in Twitter, citing the company's alleged suppression of free speech. His complaints were vague, relying heavily on the dog whistles of the ultra-right. A week later, he announced he'd buy the company for $54.20 per share, four days after initially pledging to join Twitter's board. Twitter's directors noticed the 420 reference as well, and responded with a “shareholder rights” plan (i.e., a poison pill) that included a 420 joke.
Musk - Patrick Pleul/Getty Images
No one knew if the bid was genuine. Musk's Twitter plans seemed implausible or insincere. In a tweet, he referred to automated accounts that use his name to promote cryptocurrency. He enraged his prospective employees by suggesting that Twitter's San Francisco headquarters be turned into a homeless shelter, renaming the company Titter, and expressing solidarity with his growing conservative fan base. “The woke mind virus is making Netflix unwatchable,” he tweeted on April 19.
But Musk got funding, and after a frantic weekend of negotiations, Twitter said yes. Unlike most buyouts, Musk will personally fund the deal, putting up up to $21 billion in cash and borrowing another $12.5 billion against his Tesla stock.
Free Speech and Partisanship
Percentage of respondents who agree with the following
The deal is expected to replatform accounts that were banned by Twitter for harassing others, spreading misinformation, or inciting violence, such as former President Donald Trump's account. As a result, Musk is at odds with his own left-leaning employees, users, and advertisers, who would prefer more content moderation rather than less.
Dorsey - Photographer: Joe Raedle/Getty Images
Previously, the company's leadership had similar issues. Founder Jack Dorsey stepped down last year amid concerns about slowing growth and product development, as well as his dual role as CEO of payments processor Block Inc. Compared to Musk, a father of seven who already runs four companies (besides Tesla and SpaceX), Dorsey is laser-focused.
Musk's motivation to buy Twitter may be political. Affirming the American far right with $44 billion spent on “free speech” Right-wing activists have promoted a series of competing upstart Twitter competitors—Parler, Gettr, and Trump's own effort, Truth Social—since Trump was banned from major social media platforms for encouraging rioters at the US Capitol on Jan. 6, 2021. But Musk can give them a social network with lax content moderation and a real user base. Trump said he wouldn't return to Twitter after the deal was announced, but he wouldn't be the first to do so.
Trump - Eli Hiller/Bloomberg
Conservative activists and lawmakers are already ecstatic. “A great day for free speech in America,” said Missouri Republican Josh Hawley. The day the deal was announced, Tucker Carlson opened his nightly Fox show with a 10-minute laudatory monologue. “The single biggest political development since Donald Trump's election in 2016,” he gushed over Musk.
But Musk's supporters and detractors misunderstand how much his business interests influence his political ideology. He marketed Tesla's cars as carbon-saving machines that were faster and cooler than gas-powered luxury cars during George W. Bush's presidency. Musk gained a huge following among wealthy environmentalists who reserved hundreds of thousands of Tesla sedans years before they were made during Barack Obama's presidency. Musk in the Trump era advocated for a carbon tax, but he also fought local officials (and his own workers) over Covid rules that slowed the reopening of his Bay Area factory.
Teslas at the Las Vegas Convention Center Loop Central Station in April 2021. The Las Vegas Convention Center Loop was Musk's first commercial project. Ethan Miller/Getty Images
Musk's rightward shift matched the rise of the nationalist-populist right and the desire to serve a growing EV market. In 2019, he unveiled the Cybertruck, a Tesla pickup, and in 2018, he announced plans to manufacture it at a new plant outside Austin. In 2021, he decided to move Tesla's headquarters there, citing California's "land of over-regulation." After Ford and General Motors beat him to the electric truck market, Musk reframed Tesla as a company for pickup-driving dudes.
Similarly, his purchase of Twitter will be entwined with his other business interests. Tesla has a factory in China and is friendly with Beijing. This could be seen as a conflict of interest when Musk's Twitter decides how to treat Chinese-backed disinformation, as Amazon.com Inc. founder Jeff Bezos noted.
Musk has focused on Twitter's product and social impact, but the company's biggest challenges are financial: Either increase cash flow or cut costs to comfortably service his new debt. Even if Musk can't do that, he can still benefit from the deal. He has recently used the increased attention to promote other business interests: Boring has hyperloops and Neuralink brain implants on the way, Musk tweeted. Remember Tesla's long-promised robotaxis!
Musk may be comfortable saying he has no expectation of profit because it benefits his other businesses. At the TED conference on April 14, Musk insisted that his interest in Twitter was solely charitable. “I don't care about money.”
The rockets and weed jokes make it easy to see Musk as unique—and his crazy buyout will undoubtedly add to that narrative. However, he is a megabillionaire who is risking a small amount of money (approximately 13% of his net worth) to gain potentially enormous influence. Musk makes everything seem new, but this is a rehash of an old media story.