


More on Web3 & Crypto

Sam Bourgi
3 years ago
NFT was used to serve a restraining order on an anonymous hacker.
The international law firm Holland & Knight used an NFT built and airdropped by its asset recovery team to serve a defendant in a hacking case.
The law firms Holland & Knight and Bluestone used a nonfungible token to serve a defendant in a hacking case with a temporary restraining order, marking the first documented legal process assisted by an NFT.
The so-called "service token" or "service NFT" was served to an unknown defendant in a hacking case involving LCX, a cryptocurrency exchange based in Liechtenstein that was hacked for over $8 million in January. The attack compromised the platform's hot wallets, resulting in the loss of Ether (ETH), USD Coin (USDC), and other cryptocurrencies, according to Cointelegraph at the time.
On June 7, LCX claimed that around 60% of the stolen cash had been frozen, with investigations ongoing in Liechtenstein, Ireland, Spain, and the United States. Based on a court judgment from the New York Supreme Court, Centre Consortium, a company created by USDC issuer Circle and crypto exchange Coinbase, has frozen around $1.3 million in USDC.
The monies were laundered through Tornado Cash, according to LCX, but were later tracked using "algorithmic forensic analysis." The organization was also able to identify wallets linked to the hacker as a result of the investigation.
In light of these findings, the law firms representing LCX, Holland & Knight and Bluestone, served the unnamed defendant with a temporary restraining order issued on-chain using an NFT. According to LCX, this system "was allowed by the New York Supreme Court and is an example of how innovation can bring legitimacy and transparency to a market that some say is ungovernable."

Sam Hickmann
3 years ago
Token taxonomy: Utility vs Security vs NFT
Let's examine the differences between the three main token types and their functions.
As Ethereum grew, the term "token" became a catch-all term for all assets built on the Ethereum blockchain. However, different tokens were grouped based on their applications and features, causing some confusion. Let's examine the modification of three main token types: security, utility, and non-fungible.
Utility tokens
They provide a specific utility benefit (or a number of such). A utility token is similar to a casino chip, a table game ticket, or a voucher. Depending on the terms of issuing, they can be earned and used in various ways. A utility token is a type of token that represents a tool or mechanism required to use the application in question. Like a service, a utility token's price is determined by supply and demand. Tokens can also be used as a bonus or reward mechanism in decentralized systems: for example, if you like someone's work, give them an upvote and they get a certain number of tokens. This is a way for authors or creators to earn money indirectly.
The most common way to use a utility token is to pay with them instead of cash for discounted goods or services.
Utility tokens are the most widely used by blockchain companies. Most cryptocurrency exchanges accept fees in native utility tokens.
Utility tokens can also be used as a reward. Companies tokenize their loyalty programs so that points can be bought and sold on blockchain exchanges. These tokens are widely used in decentralized companies as a bonus system. You can use utility tokens to reward creators for their contributions to a platform, for example. It also allows members to exchange tokens for specific bonuses and rewards on your site.
Unlike security tokens, which are subject to legal restrictions, utility tokens can be freely traded.
Security tokens
Security tokens are essentially traditional securities like shares, bonds, and investment fund units in a crypto token form.
The key distinction is that security tokens are typically issued by private firms (rather than public companies) that are not listed on stock exchanges and in which you can not invest right now. Banks and large venture funds used to be the only sources of funding. A person could only invest in private firms if they had millions of dollars in their bank account. Privately issued security tokens outperform traditional public stocks in terms of yield. Private markets grew 50% faster than public markets over the last decade, according to McKinsey Private Equity Research.
A security token is a crypto token whose value is derived from an external asset or company. So it is governed as security (read about the Howey test further in this article). That is, an ownership token derives its value from the company's valuation, assets on the balance sheet, or dividends paid to token holders.
Why are Security Tokens Important?
Cryptocurrency is a lucrative investment. Choosing from thousands of crypto assets can mean the difference between millionaire and bankrupt. Without security tokens, crypto investing becomes riskier and generating long-term profits becomes difficult. These tokens have lower risk than other cryptocurrencies because they are backed by real assets or business cash flows. So having them helps to diversify a portfolio and preserve the return on investment in riskier assets.
Security tokens open up new funding avenues for businesses. As a result, investors can invest in high-profit businesses that are not listed on the stock exchange.
The distinction between utility and security tokens isn't as clear as it seems. However, this increases the risk for token issuers, especially in the USA. The Howey test is the main pillar regulating judicial precedent in this area.
What is a Howey Test?
An "investment contract" is determined by the Howey Test, a lawsuit settled by the US Supreme Court. If it does, it's a security and must be disclosed and registered under the Securities Act of 1933 and the Securities Exchange Act of 1934.
If the SEC decides that a cryptocurrency token is a security, a slew of issues arise. In practice, this ensures that the SEC will decide when a token can be offered to US investors and if the project is required to file a registration statement with the SEC.
Due to the Howey test's extensive wording, most utility tokens will be classified as securities, even if not intended to be. Because of these restrictions, most ICOs are not available to US investors. When asked about ICOs in 2018, then-SEC Chairman Jay Clayton said they were securities. The given statement adds to the risk. If a company issues utility tokens without registering them as securities, the regulator may impose huge fines or even criminal charges.
What other documents regulate tokens?
Securities Act (1993) or Securities Exchange Act (1934) in the USA; MiFID directive and Prospectus Regulation in the EU. These laws require registering the placement of security tokens, limiting their transfer, but protecting investors.
Utility tokens have much less regulation. The Howey test determines whether a given utility token is a security. Tokens recognized as securities are now regulated as such. Having a legal opinion that your token isn't makes the implementation process much easier. Most countries don't have strict regulations regarding utility tokens except KYC (Know Your Client) and AML (Anti Money-Laundering).
As cryptocurrency and blockchain technologies evolve, more countries create UT regulations. If your company is based in the US, be aware of the Howey test and the Bank Secrecy Act. It classifies UTs and their issuance as money transmission services in most states, necessitating a license and strict regulations. Due to high regulatory demands, UT issuers try to avoid the United States as a whole. A new law separating utility tokens from bank secrecy act will be introduced in the near future, giving hope to American issuers.
The rest of the world has much simpler rules requiring issuers to create basic investor disclosures. For example, the latest European legislation (MiCA) allows businesses to issue utility tokens without regulator approval. They must also prepare a paper with all the necessary information for the investors.
A payment token is a utility token that is used to make a payment. They may be subject to electronic money laws.
Because non-fungible tokens are a new instrument, there is no regulating paper yet. However, if the NFT is fractionalized, the smaller tokens acquired may be seen as securities.
NFT Tokens
Collectible tokens are also known as non-fungible tokens. Their distinctive feature is that they denote unique items such as artwork, merch, or ranks. Unlike utility tokens, which are fungible, meaning that two of the same tokens are identical, NFTs represent a unit of possession that is strictly one of a kind. In a way, NFTs are like baseball cards, each one unique and valuable.
As for today, the most recognizable NFT function is to preserve the fact of possession. Owning an NFT with a particular gif, meme, or sketch does not transfer the intellectual right to the possessor, but is analogous to owning an original painting signed by the author.
Collectible tokens can also be used as digital souvenirs, so to say. Businesses can improve their brand image by issuing their own branded NFTs, which represent ranks or achievements within the corporate ecosystem. Gamifying business ecosystems would allow people to connect with a brand and feel part of a community.
Which type of tokens is right for you as a business to raise capital?
For most businesses, it's best to raise capital with security tokens by selling existing shares to global investors. Utility tokens aren't meant to increase in value over time, so leave them for gamification and community engagement. In a blockchain-based business, however, a utility token is often the lifeblood of the operation, and its appreciation potential is directly linked to the company's growth. You can issue multiple tokens at once, rather than just one type. It exposes you to various investors and maximizes the use of digital assets.
Which tokens should I buy?
There are no universally best tokens. Their volatility, industry, and risk-reward profile vary. This means evaluating tokens in relation to your overall portfolio and personal preferences: what industries do you understand best, what excites you, how do you approach taxes, and what is your planning horizon? To build a balanced portfolio, you need to know these factors.
Conclusion
The three most common types of tokens today are security, utility, and NFT. Security tokens represent stocks, mutual funds, and bonds. Utility tokens can be perceived as an inside-product "currency" or "ignition key" that grants you access to goods and services or empowers with other perks. NFTs are unique collectible units that identify you as the owner of something.

Vitalik
4 years ago
An approximate introduction to how zk-SNARKs are possible (part 2)
If tasked with the problem of coming up with a zk-SNARK protocol, many people would make their way to this point and then get stuck and give up. How can a verifier possibly check every single piece of the computation, without looking at each piece of the computation individually? But it turns out that there is a clever solution.
Polynomials
Polynomials are a special class of algebraic expressions of the form:
- x+5
- x^4
- x^3+3x^2+3x+1
- 628x^{271}+318x^{270}+530x^{269}+…+69x+381
i.e. they are a sum of any (finite!) number of terms of the form cx^k
There are many things that are fascinating about polynomials. But here we are going to zoom in on a particular one: polynomials are a single mathematical object that can contain an unbounded amount of information (think of them as a list of integers and this is obvious). The fourth example above contained 816 digits of tau, and one can easily imagine a polynomial that contains far more.
Furthermore, a single equation between polynomials can represent an unbounded number of equations between numbers. For example, consider the equation A(x)+ B(x) = C(x). If this equation is true, then it's also true that:
- A(0)+B(0)=C(0)
- A(1)+B(1)=C(1)
- A(2)+B(2)=C(2)
- A(3)+B(3)=C(3)
And so on for every possible coordinate. You can even construct polynomials to deliberately represent sets of numbers so you can check many equations all at once. For example, suppose that you wanted to check:
- 12+1=13
- 10+8=18
- 15+8=23
- 15+13=28
You can use a procedure called Lagrange interpolation to construct polynomials A(x) that give (12,10,15,15) as outputs at some specific set of coordinates (eg. (0,1,2,3)), B(x) the outputs (1,8,8,13) on thos same coordinates, and so forth. In fact, here are the polynomials:
- A(x)=-2x^3+\frac{19}{2}x^2-\frac{19}{2}x+12
- B(x)=2x^3-\frac{19}{2}x^2+\frac{29}{2}x+1
- C(x)=5x+13
Checking the equation A(x)+B(x)=C(x) with these polynomials checks all four above equations at the same time.
Comparing a polynomial to itself
You can even check relationships between a large number of adjacent evaluations of the same polynomial using a simple polynomial equation. This is slightly more advanced. Suppose that you want to check that, for a given polynomial F, F(x+2)=F(x)+F(x+1) with the integer range {0,1…89} (so if you also check F(0)=F(1)=1, then F(100) would be the 100th Fibonacci number)
As polynomials, F(x+2)-F(x+1)-F(x) would not be exactly zero, as it could give arbitrary answers outside the range x={0,1…98}. But we can do something clever. In general, there is a rule that if a polynomial P is zero across some set S=\{x_1,x_2…x_n\} then it can be expressed as P(x)=Z(x)*H(x), where Z(x)=(x-x_1)*(x-x_2)*…*(x-x_n) and H(x) is also a polynomial. In other words, any polynomial that equals zero across some set is a (polynomial) multiple of the simplest (lowest-degree) polynomial that equals zero across that same set.
Why is this the case? It is a nice corollary of polynomial long division: the factor theorem. We know that, when dividing P(x) by Z(x), we will get a quotient Q(x) and a remainder R(x) is strictly less than that of Z(x). Since we know that P is zero on all of S, it means that R has to be zero on all of S as well. So we can simply compute R(x) via polynomial interpolation, since it's a polynomial of degree at most n-1 and we know n values (the zeros at S). Interpolating a polynomial with all zeroes gives the zero polynomial, thus R(x)=0 and H(x)=Q(x).
Going back to our example, if we have a polynomial F that encodes Fibonacci numbers (so F(x+2)=F(x)+F(x+1) across x=\{0,1…98\}), then I can convince you that F actually satisfies this condition by proving that the polynomial P(x)=F(x+2)-F(x+1)-F(x) is zero over that range, by giving you the quotient:
H(x)=\frac{F(x+2)-F(x+1)-F(x)}{Z(x)}
Where Z(x) = (x-0)*(x-1)*…*(x-98).
You can calculate Z(x) yourself (ideally you would have it precomputed), check the equation, and if the check passes then F(x) satisfies the condition!
Now, step back and notice what we did here. We converted a 100-step-long computation into a single equation with polynomials. Of course, proving the N'th Fibonacci number is not an especially useful task, especially since Fibonacci numbers have a closed form. But you can use exactly the same basic technique, just with some extra polynomials and some more complicated equations, to encode arbitrary computations with an arbitrarily large number of steps.
see part 3
You might also like

Nikhil Vemu
3 years ago
7 Mac Apps That Are Exorbitantly Priced But Totally Worth It

Wish you more bang for your buck
By ‘Cost a Bomb’ I didn’t mean to exaggerate. It’s an idiom that means ‘To be very expensive’. In fact, no app on the planet costs a bomb lol.
So, to the point.
Chronicle
(Freemium. For Pro, $24.99 | Available on Setapp)
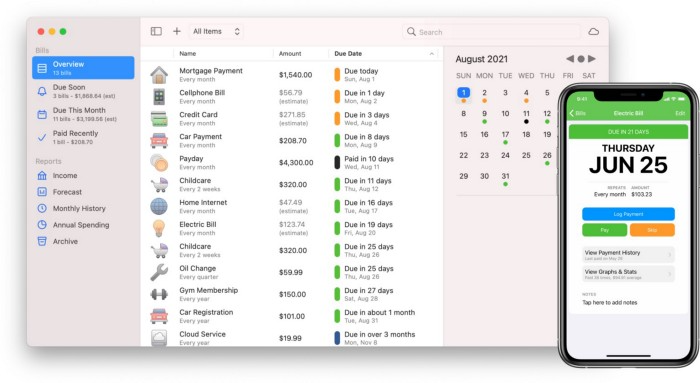
You probably have trouble keeping track of dozens of bills and subscriptions each month.
Try Chronicle.
Easy-to-use app
Add payment due dates and receive reminders,
Save payment documentation,
Analyze your spending by season, year, and month.
Observe expenditure trends and create new budgets.
Best of all, Chronicle features an integrated browser for fast payment and logging.
iOS and macOS sync.
SoundSource
($39 for lifetime)
Background Music, a free macOS program, was featured in #6 of this post last month.
It controls per-app volume, stereo balance, and audio over its max level.
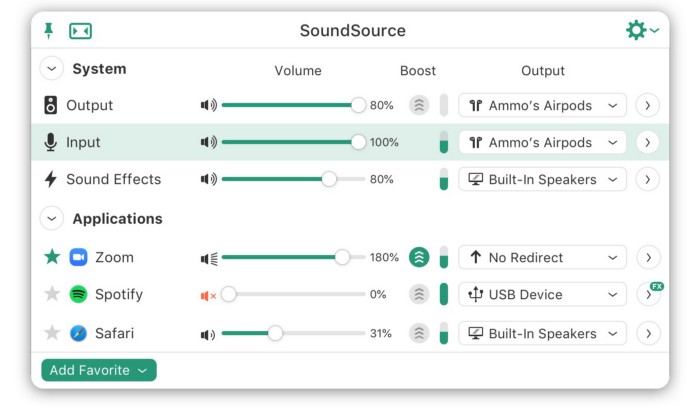
Background Music is fully supported. Additionally,
Connect various speakers to various apps (Wow! ),
change the audio sample rate for each app,
To facilitate access, add a floating SoundSource window.
Use its blocks in Shortcuts app,
On the menu bar, include meters for output/input devices and running programs.
PixelSnap
($39 for lifetime | Available on Setapp)
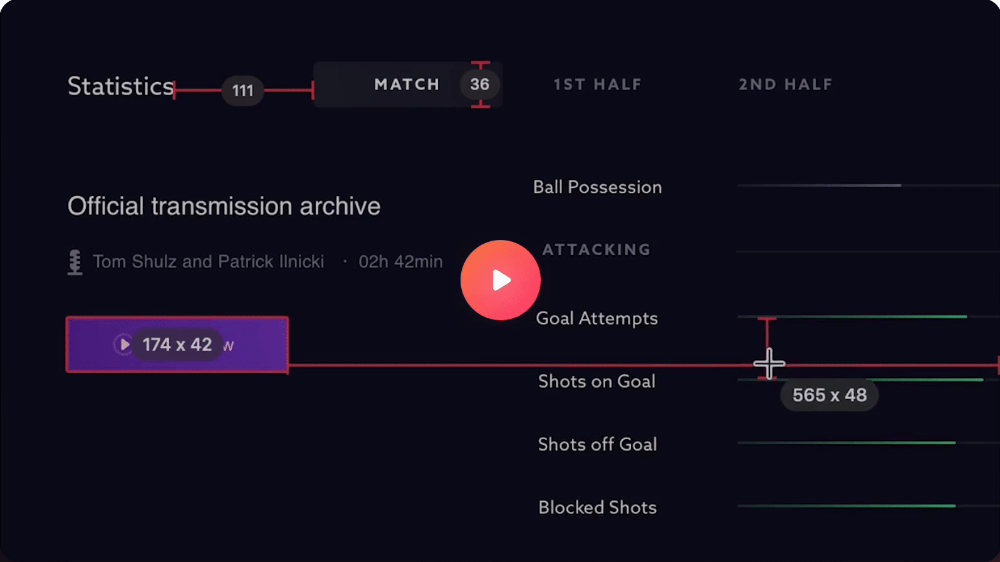
This software is heaven for UI designers.
It aids you.
quickly calculate screen distances (in pixels) ,
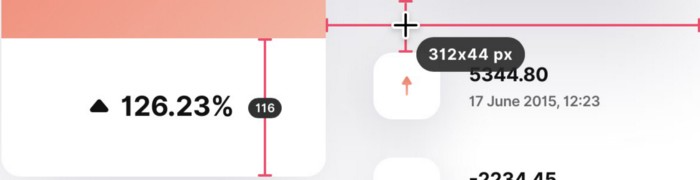
Drag an area around an object to determine its borders,
Measure the distances between the additional guides,
screenshots should be pixel-perfect.
What’s more.
You can
Adapt your tolerance for items with poor contrast and shadows.
Use your Touch Bar to perform important tasks, if you have one.
Mate Translation
($3.99 a month / $29.99 a year | Available on Setapp)
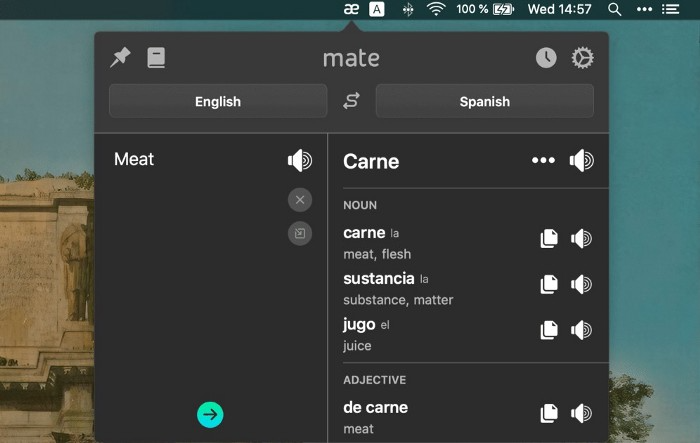
Mate Translate resembles a roided-up version of BarTranslate, which I wrote about in #1 of this piece last month.
If you translate often, utilize Mate Translate on macOS and Safari.
I'm really vocal about it.
It stays on the menu bar, and is accessible with a click or ⌥+shift+T hotkey.
It lets you
Translate in 103 different languages,
To translate text, double-click or right-click on it.
Totally translate websites. Additionally, Netflix subtitles,
Listen to their pronunciation to see how close it is to human.
iPhone and Mac sync Mate-ing history.
Swish
($16 for lifetime | Available on Setapp)
Swish is awesome!
Swipe, squeeze, tap, and hold movements organize chaotic desktop windows. Swish operates with mouse and trackpad.
Some gestures:
• Pinch Once: Close an app
• Pinch Twice: Quit an app
• Swipe down once: Minimise an app
• Pinch Out: Enter fullscreen mode
• Tap, Hold, & Swipe: Arrange apps in grids
 and many more...

After getting acquainted to the movements, your multitasking will improve.
Unite
($24.99 for lifetime | Available on Setapp)
It turns webapps into macOS apps. The end.
Unite's functionality is a million times better.
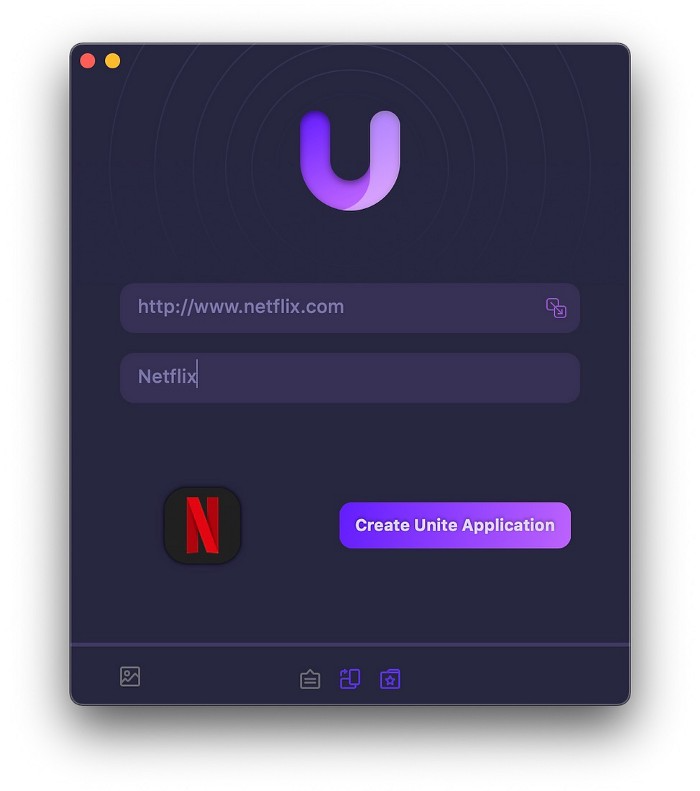
Provide extensive customization (incl. its icon, light and dark modes)
make menu bar applications,
Get badges for web notifications and automatically refresh websites,
Replace any dock icon in the window with it (Wow!) by selecting that portion of the window.
Use PiP (Picture-in-Picture) on video sites that support it.
Delete advertising,
Throughout macOS, use floating windows
and many more…
I feel $24.99 one-off for this tool is a great deal, considering all these features. What do you think?
CleanShot X
(Basic: $29 one-off. Pro: $8/month | Available on Setapp)
CleanShot X can achieve things the macOS screenshot tool cannot. Complete screenshot toolkit.
CleanShot X, like Pixel Snap 2 (#3), is fantastic.
Allows
Scroll to capture a long page,
screen recording,
With webcam on,
• With mic and system audio,
• Highlighting mouse clicks and hotkeys.
Maintain floating screenshots for reference
While capturing, conceal desktop icons and notifications.
Recognize text in screenshots (OCR),
You may upload and share screenshots using the built-in cloud.
These are just 6 in 50+ features, and you’re already saying Wow!

Sofien Kaabar, CFA
3 years ago
How to Make a Trading Heatmap
Python Heatmap Technical Indicator
Heatmaps provide an instant overview. They can be used with correlations or to predict reactions or confirm the trend in trading. This article covers RSI heatmap creation.
The Market System
Market regime:
Bullish trend: The market tends to make higher highs, which indicates that the overall trend is upward.
Sideways: The market tends to fluctuate while staying within predetermined zones.
Bearish trend: The market has the propensity to make lower lows, indicating that the overall trend is downward.
Most tools detect the trend, but we cannot predict the next state. The best way to solve this problem is to assume the current state will continue and trade any reactions, preferably in the trend.
If the EURUSD is above its moving average and making higher highs, a trend-following strategy would be to wait for dips before buying and assuming the bullish trend will continue.
Indicator of Relative Strength
J. Welles Wilder Jr. introduced the RSI, a popular and versatile technical indicator. Used as a contrarian indicator to exploit extreme reactions. Calculating the default RSI usually involves these steps:
Determine the difference between the closing prices from the prior ones.
Distinguish between the positive and negative net changes.
Create a smoothed moving average for both the absolute values of the positive net changes and the negative net changes.
Take the difference between the smoothed positive and negative changes. The Relative Strength RS will be the name we use to describe this calculation.
To obtain the RSI, use the normalization formula shown below for each time step.
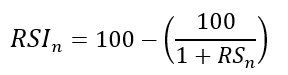
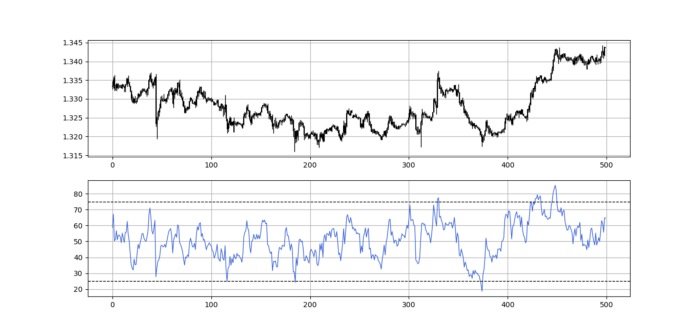
The 13-period RSI and black GBPUSD hourly values are shown above. RSI bounces near 25 and pauses around 75. Python requires a four-column OHLC array for RSI coding.
import numpy as np
def add_column(data, times):

    for i in range(1, times + 1):

        new = np.zeros((len(data), 1), dtype = float)

        data = np.append(data, new, axis = 1)
    return data
def delete_column(data, index, times):

    for i in range(1, times + 1):

        data = np.delete(data, index, axis = 1)
    return data
def delete_row(data, number):

    data = data[number:, ]

    return data
def ma(data, lookback, close, position):

    data = add_column(data, 1)

    for i in range(len(data)):

            try:

                data[i, position] = (data[i - lookback + 1:i + 1, close].mean())

            except IndexError:

                pass

    data = delete_row(data, lookback)

    return data
def smoothed_ma(data, alpha, lookback, close, position):

    lookback = (2 * lookback) - 1

    alpha = alpha / (lookback + 1.0)

    beta  = 1 - alpha

    data = ma(data, lookback, close, position)
    data[lookback + 1, position] = (data[lookback + 1, close] * alpha) + (data[lookback, position] * beta)
    for i in range(lookback + 2, len(data)):

            try:

                data[i, position] = (data[i, close] * alpha) + (data[i - 1, position] * beta)

            except IndexError:

                pass

    return data
def rsi(data, lookback, close, position):

    data = add_column(data, 5)

    for i in range(len(data)):

        data[i, position] = data[i, close] - data[i - 1, close]

    for i in range(len(data)):

        if data[i, position] > 0:

            data[i, position + 1] = data[i, position]

        elif data[i, position] < 0:

            data[i, position + 2] = abs(data[i, position])

    data = smoothed_ma(data, 2, lookback, position + 1, position + 3)
    data = smoothed_ma(data, 2, lookback, position + 2, position + 4)
    data[:, position + 5] = data[:, position + 3] / data[:, position + 4]

    data[:, position + 6] = (100 - (100 / (1 + data[:, position + 5])))
    data = delete_column(data, position, 6)
    data = delete_row(data, lookback)
    return data
Make sure to focus on the concepts and not the code. You can find the codes of most of my strategies in my books. The most important thing is to comprehend the techniques and strategies.
My weekly market sentiment report uses complex and simple models to understand the current positioning and predict the future direction of several major markets. Check out the report here:
Using the Heatmap to Find the Trend
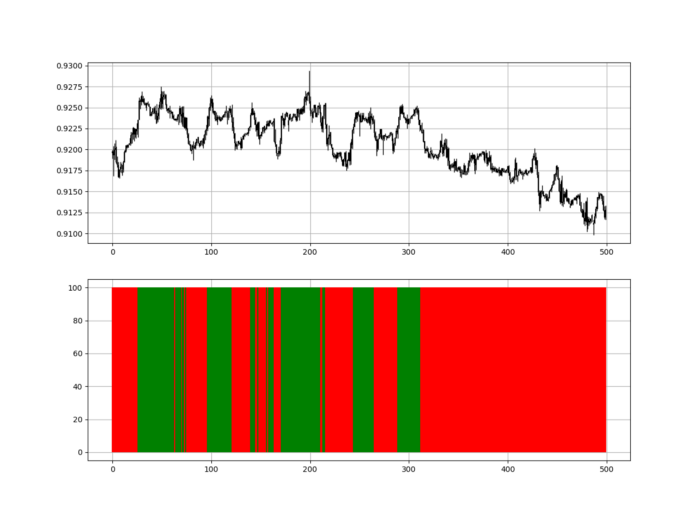
RSI trend detection is easy but useless. Bullish and bearish regimes are in effect when the RSI is above or below 50, respectively. Tracing a vertical colored line creates the conditions below. How:
When the RSI is higher than 50, a green vertical line is drawn.
When the RSI is lower than 50, a red vertical line is drawn.
Zooming out yields a basic heatmap, as shown below.
Plot code:
def indicator_plot(data, second_panel, window = 250):
    fig, ax = plt.subplots(2, figsize = (10, 5))
    sample = data[-window:, ]
    for i in range(len(sample)):
        ax[0].vlines(x = i, ymin = sample[i, 2], ymax = sample[i, 1], color = 'black', linewidth = 1)
        if sample[i, 3] > sample[i, 0]:
            ax[0].vlines(x = i, ymin = sample[i, 0], ymax = sample[i, 3], color = 'black', linewidth = 1.5)
        if sample[i, 3] < sample[i, 0]:
            ax[0].vlines(x = i, ymin = sample[i, 3], ymax = sample[i, 0], color = 'black', linewidth = 1.5)
        if sample[i, 3] == sample[i, 0]:
            ax[0].vlines(x = i, ymin = sample[i, 3], ymax = sample[i, 0], color = 'black', linewidth = 1.5)
    ax[0].grid()
    for i in range(len(sample)):
        if sample[i, second_panel] > 50:
            ax[1].vlines(x = i, ymin = 0, ymax = 100, color = 'green', linewidth = 1.5)
        if sample[i, second_panel] < 50:
            ax[1].vlines(x = i, ymin = 0, ymax = 100, color = 'red', linewidth = 1.5)
    ax[1].grid()
indicator_plot(my_data, 4, window = 500)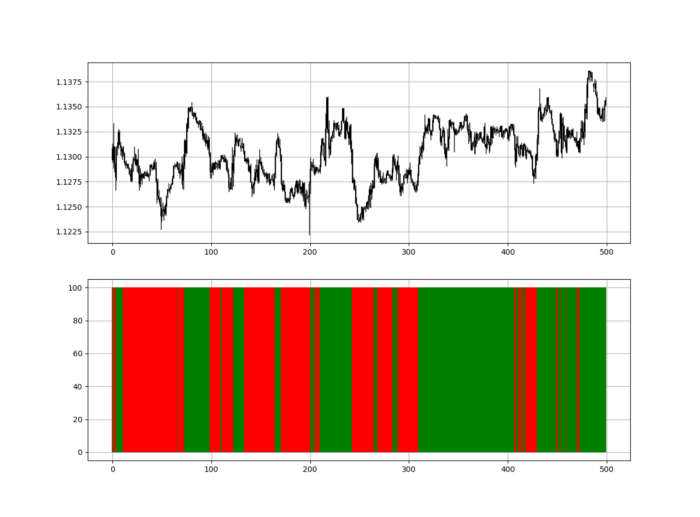
Call RSI on your OHLC array's fifth column. 4. Adjusting lookback parameters reduces lag and false signals. Other indicators and conditions are possible.
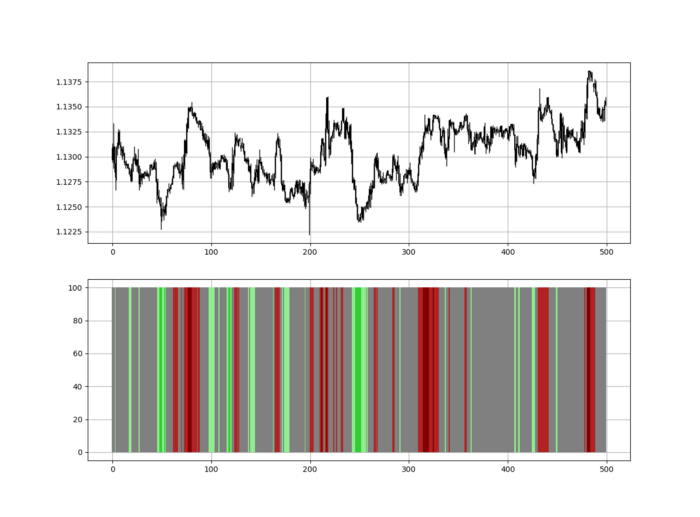
Another suggestion is to develop an RSI Heatmap for Extreme Conditions.
Contrarian indicator RSI. The following rules apply:
Whenever the RSI is approaching the upper values, the color approaches red.
The color tends toward green whenever the RSI is getting close to the lower values.
Zooming out yields a basic heatmap, as shown below.
Plot code:
import matplotlib.pyplot as plt
def indicator_plot(data, second_panel, window = 250):
    fig, ax = plt.subplots(2, figsize = (10, 5))
    sample = data[-window:, ]
    for i in range(len(sample)):
        ax[0].vlines(x = i, ymin = sample[i, 2], ymax = sample[i, 1], color = 'black', linewidth = 1)
        if sample[i, 3] > sample[i, 0]:
            ax[0].vlines(x = i, ymin = sample[i, 0], ymax = sample[i, 3], color = 'black', linewidth = 1.5)
        if sample[i, 3] < sample[i, 0]:
            ax[0].vlines(x = i, ymin = sample[i, 3], ymax = sample[i, 0], color = 'black', linewidth = 1.5)
        if sample[i, 3] == sample[i, 0]:
            ax[0].vlines(x = i, ymin = sample[i, 3], ymax = sample[i, 0], color = 'black', linewidth = 1.5)
    ax[0].grid()
    for i in range(len(sample)):
        if sample[i, second_panel] > 90:
            ax[1].vlines(x = i, ymin = 0, ymax = 100, color = 'red', linewidth = 1.5)
        if sample[i, second_panel] > 80 and sample[i, second_panel] < 90:
            ax[1].vlines(x = i, ymin = 0, ymax = 100, color = 'darkred', linewidth = 1.5)
        if sample[i, second_panel] > 70 and sample[i, second_panel] < 80:
            ax[1].vlines(x = i, ymin = 0, ymax = 100, color = 'maroon', linewidth = 1.5)
        if sample[i, second_panel] > 60 and sample[i, second_panel] < 70:
            ax[1].vlines(x = i, ymin = 0, ymax = 100, color = 'firebrick', linewidth = 1.5)
        if sample[i, second_panel] > 50 and sample[i, second_panel] < 60:
            ax[1].vlines(x = i, ymin = 0, ymax = 100, color = 'grey', linewidth = 1.5)
        if sample[i, second_panel] > 40 and sample[i, second_panel] < 50:
            ax[1].vlines(x = i, ymin = 0, ymax = 100, color = 'grey', linewidth = 1.5)
        if sample[i, second_panel] > 30 and sample[i, second_panel] < 40:
            ax[1].vlines(x = i, ymin = 0, ymax = 100, color = 'lightgreen', linewidth = 1.5)
        if sample[i, second_panel] > 20 and sample[i, second_panel] < 30:
            ax[1].vlines(x = i, ymin = 0, ymax = 100, color = 'limegreen', linewidth = 1.5)
        if sample[i, second_panel] > 10 and sample[i, second_panel] < 20:
            ax[1].vlines(x = i, ymin = 0, ymax = 100, color = 'seagreen', linewidth = 1.5)
        if sample[i, second_panel] > 0 and sample[i, second_panel] < 10:
            ax[1].vlines(x = i, ymin = 0, ymax = 100, color = 'green', linewidth = 1.5)
    ax[1].grid()
indicator_plot(my_data, 4, window = 500)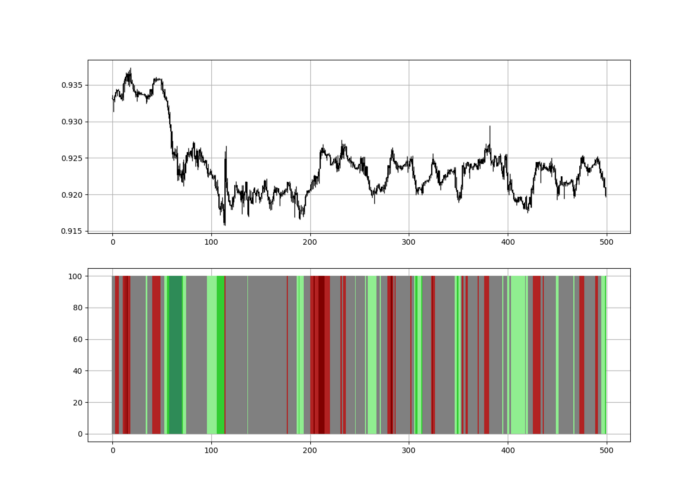
Dark green and red areas indicate imminent bullish and bearish reactions, respectively. RSI around 50 is grey.
Summary
To conclude, my goal is to contribute to objective technical analysis, which promotes more transparent methods and strategies that must be back-tested before implementation.
Technical analysis will lose its reputation as subjective and unscientific.
When you find a trading strategy or technique, follow these steps:
Put emotions aside and adopt a critical mindset.
Test it in the past under conditions and simulations taken from real life.
Try optimizing it and performing a forward test if you find any potential.
Transaction costs and any slippage simulation should always be included in your tests.
Risk management and position sizing should always be considered in your tests.
After checking the above, monitor the strategy because market dynamics may change and make it unprofitable.

Bernard Bado
3 years ago
Build This Before Someone Else Does!

Do you want to build and launch your own software company? To do this, all you need is a product that solves a problem.
Coming up with profitable ideas is not that easy. But you’re in luck because you got me!
I’ll give you the idea for free. All you need to do is execute it properly.
If you’re ready, let’s jump right into it! Starting with the problem.
Problem
Youtube has many creators. Every day, they think of new ways to entertain or inform us.
They work hard to make videos. Many of their efforts go to waste. They limit their revenue and reach.
Solution
Content repurposing solves this problem.
One video can become several TikToks. Creating YouTube videos from a podcast episode.
Or, one video might become a blog entry.
By turning videos into blog entries, Youtubers may develop evergreen SEO content, attract a new audience, and reach a non-YouTube audience.
Many YouTube creators want this easy feature.
Let's build it!
Implementation
We identified the problem, and we have a solution. All that’s left to do is see how it can be done.
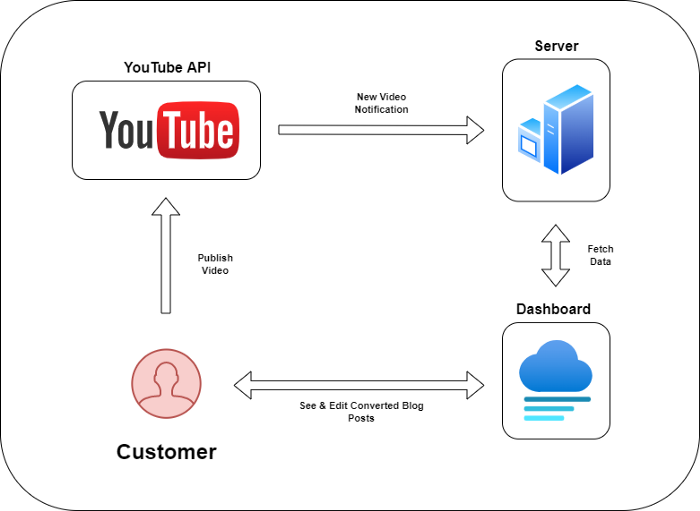
Monitoring new video uploads
First, watch when a friend uploads a new video. Everything should happen automatically without user input.
YouTube Webhooks make this easy. Our server listens for YouTube Webhook notifications.
After publishing a new video, we create a conversion job.
Creating a Blog Post from a Video
Next, turn a video into a blog article.
To convert, we must extract the video's audio (which can be achieved by using FFmpeg on the server).
Once we have the audio channel, we can use speech-to-text.
Services can accomplish this easily.
Speech-to-text on Google
Google Translate
Deepgram
Deepgram's affordability and integration make it my pick.
After conversion, the blog post needs formatting, error checking, and proofreading.
After this, a new blog post will appear in our web app's dashboard.
Completing a blog post
After conversion, users must examine and amend their blog posts.
Our application dashboard would handle all of this. It's a dashboard-style software where users can:
Link their Youtube account
Check out the converted videos in the future.
View the conversions that are ongoing.
Edit and format converted blog articles.
It's a web-based app.
It doesn't matter how it's made but I'd choose Next.js.
Next.js is a React front-end standard. Vercel serverless functions could conduct the conversions.
This would let me host the software for free and reduce server expenditures.
Taking It One Step Further
SaaS in a nutshell. Future improvements include integrating with WordPress or Ghost.
Our app users could then publish blog posts. Streamlining the procedure.
MVPs don't need this functionality.
Final Thoughts
Repurposing content helps you post more often, reach more people, and develop faster.
Many agencies charge a fortune for this service. Handmade means pricey.
Content creators will go crazy if you automate and cheaply solve this problem.
Just execute this idea!