


10 Ways to Make Money Online in 2022
As a tech-savvy person (and software engineer) or just a casual technology user, I'm sure you've had this same question countless times: How do I make money online? and how do I make money with my PC/Mac?
You're in luck! Today, I will list the top 5 easiest ways to make money online. Maybe a top ten in the future? Top 5 tips for 2022.
1. Using the gig economy
There are many websites on the internet that allow you to earn extra money using skills and equipment that you already own.
I'm referring to the gig economy. It's a great way to earn a steady passive income from the comfort of your own home. For some sites, premium subscriptions are available to increase sales and access features like bidding on more proposals.
Some of these are:
- Freelancer
- Upwork
- Fiverr (⭐ my personal favorite)
- TaskRabbit
2. Mineprize
MINEPRIZE is a great way to make money online. What's more, You need not do anything! You earn money by lending your idle CPU power to MINEPRIZE.
To register with MINEPRIZE, all you need is an email address and a password. Let MINEPRIZE use your resources, and watch the money roll in! You can earn up to $100 per month by letting your computer calculate. That's insane.
3. Writing
“O Romeo, Romeo, why art thou Romeo?” Okay, I admit that not all writing is Shakespearean. To be a copywriter, you'll need to be fluent in English. Thankfully, we don't have to use typewriters anymore.
Writing is a skill that can earn you a lot of money (claps for the rhyme).
Here are a few ways you can make money typing on your fancy keyboard:
Self-publish a book
Write scripts for video creators
Write for social media
Book-checking
Content marketing help
What a list within a list!
4. Coding
Yes, kids. You've probably coded before if you understand
You've probably coded before if you understand
print("hello world");
Computational thinking (or coding) is one of the most lucrative ways to earn extra money, or even as a main source of income.
Of course, there are hardcode coders (like me) who write everything line by line, binary di — okay, that last part is a bit exaggerated.
But you can also make money by writing websites or apps or creating low code or no code platforms.
But you can also make money by writing websites or apps or creating low code or no code platforms.
Some low-code platforms
Sheet : spreadsheets to apps :
Loading... We'll install your new app... No-Code Your team can create apps and automate tasks. Agile…
www.appsheet.com
Low-code platform | Business app creator - Zoho Creator
Work is going digital, and businesses of all sizes must adapt quickly. Zoho Creator is a...
www.zoho.com
Sell your data with TrueSource. NO CODE NEEDED
Upload data, configure your product, and earn in minutes.
www.truesource.io
Cool, huh?
5. Created Content
If we use the internet correctly, we can gain unfathomable wealth and extra money. But this one is a bit more difficult. Unlike some of the other items on this list, it takes a lot of time up front.
I'm referring to sites like YouTube and Medium. It's a great way to earn money both passively and actively. With the likes of Jake- and Logan Paul, PewDiePie (a.k.a. Felix Kjellberg) and others, it's never too late to become a millionaire on YouTube. YouTubers are always rising to the top with great content.
6. NFTs and Cryptocurrency
It is now possible to amass large sums of money by buying and selling digital assets on NFTs and cryptocurrency exchanges. Binance's Initial Game Offer rewards early investors who produce the best results.
One awesome game sold a piece of its plot for US$7.2 million! It's Axie Infinity. It's free and available on Google Play and Apple Store.
7. Affiliate Marketing
Affiliate marketing is a form of advertising where businesses pay others (like bloggers) to promote their goods and services. Here's an example. I write a blog (like this one) and post an affiliate link to an item I recommend buying — say, a camera — and if you buy the camera, I get a commission!
These programs pay well:
- Elementor
- AWeber
- Sendinblue
- ConvertKit\sLeadpages
- GetResponse
- SEMRush\sFiverr
- Pabbly
8. Start a blog
Now, if you're a writer or just really passionate about something or a niche, blogging could potentially monetize that passion!
Create a blog about anything you can think of. It's okay to start right here on Medium, as I did.
9. Dropshipping
And I mean that in the best possible way — drop shopping is ridiculously easy to set up, but difficult to maintain for some.
Luckily, Shopify has made setting up an online store a breeze. Drop-shipping from Alibaba and DHGate is quite common. You've got a winner if you can find a local distributor willing to let you drop ship their product!
10. Set up an Online Course
If you have a skill and can articulate it, online education is for you.
Skillshare, Pluralsight, and Coursera have all made inroads in recent years, upskilling people with courses that YOU can create and earn from.
That's it for today! Please share if you liked this post. If not, well —
More on Web3 & Crypto

Sam Hickmann
3 years ago
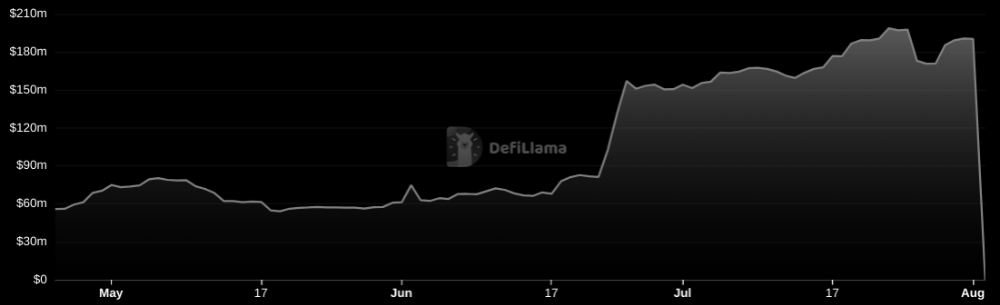
Nomad.xyz got exploited for $190M
Key Takeaways:
Another hack. This time was different. This is a doozy.
Why? Nomad got exploited for $190m. It was crypto's 5th-biggest hack. Ouch.
It wasn't hackers, but random folks. What happened:
A Nomad smart contract flaw was discovered. They couldn't drain the funds at once, so they tried numerous transactions. Rookie!
People noticed and copied the attack.
They just needed to discover a working transaction, substitute the other person's address with theirs, and run it.

In a two-and-a-half-hour attack, $190M was siphoned from Nomad Bridge.
Nomad is a novel approach to blockchain interoperability that leverages an optimistic mechanism to increase the security of cross-chain communication. — nomad.xyz
This hack was permissionless, therefore anyone could participate.
After the fatal blow, people fought over the scraps.
Cross-chain bridges remain a DeFi weakness and exploit target. When they collapse, it's typically total.
$190M...gobbled.
Unbacked assets are hurting Nomad-dependent chains. Moonbeam, EVMOS, and Milkomeda's TVLs dropped.
This incident is every-man-for-himself, although numerous whitehats exploited the issue...
But what triggered the feeding frenzy?
How did so many pick the bones?
After a normal upgrade in June, the bridge's Replica contract was initialized with a severe security issue. The 0x00 address was a trusted root, therefore all messages were valid by default.
After a botched first attempt (costing $350k in gas), the original attacker's exploit tx called process() without first 'proving' its validity.
The process() function executes all cross-chain messages and checks the merkle root of all messages (line 185).
The upgrade caused transactions with a'messages' value of 0 (invalid, according to old logic) to be read by default as 0x00, a trusted root, passing validation as 'proven'
Any process() calls were valid. In reality, a more sophisticated exploiter may have designed a contract to drain the whole bridge.
Copycat attackers simply copied/pasted the same process() function call using Etherscan, substituting their address.
The incident was a wild combination of crowdhacking, whitehat activities, and MEV-bot (Maximal Extractable Value) mayhem.
For example, 🍉🍉🍉. eth stole $4M from the bridge, but claims to be whitehat.

Others stood out for the wrong reasons. Repeat criminal Rari Capital (Artibrum) exploited over $3M in stablecoins, which moved to Tornado Cash.
The top three exploiters (with 95M between them) are:
$47M: 0x56D8B635A7C88Fd1104D23d632AF40c1C3Aac4e3
$40M: 0xBF293D5138a2a1BA407B43672643434C43827179
$8M: 0xB5C55f76f90Cc528B2609109Ca14d8d84593590E
Here's a list of all the exploiters:
The project conducted a Quantstamp audit in June; QSP-19 foreshadowed a similar problem.
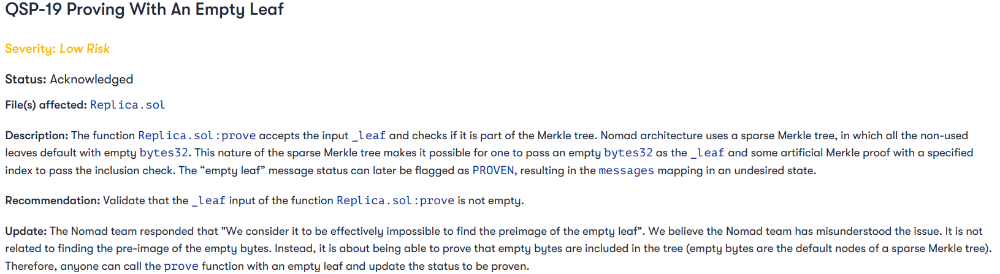
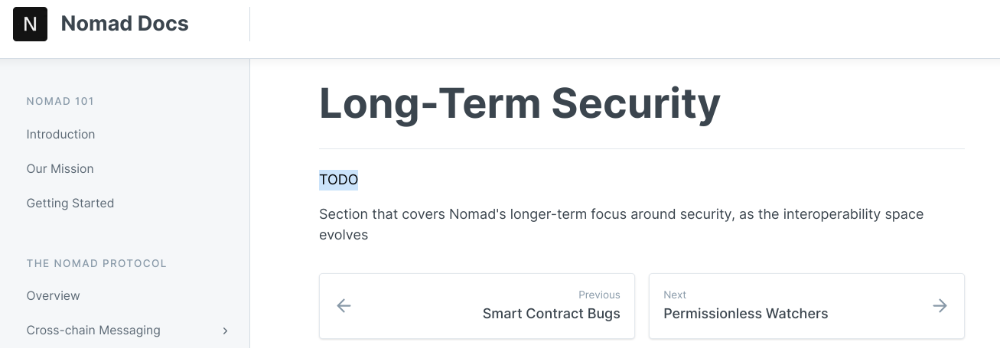
The auditor's comments that "We feel the Nomad team misinterpreted the issue" speak to a troubling attitude towards security that the project's "Long-Term Security" plan appears to confirm:
Concerns were raised about the team's response time to a live, public exploit; the team's official acknowledgement came three hours later.
"Removing the Replica contract as owner" stopped the exploit, but it was too late to preserve the cash.
Closed blockchain systems are only as strong as their weakest link.
The Harmony network is in turmoil after its bridge was attacked and lost $100M in late June.
What's next for Nomad's ecosystems?
Moonbeam's TVL is now $135M, EVMOS's is $3M, and Milkomeda's is $20M.
Loss of confidence may do more damage than $190M.
Cross-chain infrastructure is difficult to secure in a new, experimental sector. Bridge attacks can pollute an entire ecosystem or more.
Nomadic liquidity has no permanent home, so consumers will always migrate in pursuit of the "next big thing" and get stung when attentiveness wanes.
DeFi still has easy prey...
Sources: rekt.news & The Milk Road.

Nitin Sharma
3 years ago
Web3 Terminology You Should Know
The easiest online explanation.

Web3 is growing. Crypto companies are growing.
Instagram, Adidas, and Stripe adopted cryptocurrency.

Bitcoin and other cryptocurrencies made web3 famous.
Most don't know where to start. Cryptocurrency, DeFi, etc. are investments.
Since we don't understand web3, I'll help you today.
Let’s go.
1. Web3
It is the third generation of the web, and it is built on the decentralization idea which means no one can control it.
There are static webpages that we can only read on the first generation of the web (i.e. Web 1.0).
Web 2.0 websites are interactive. Twitter, Medium, and YouTube.
Each generation controlled the website owner. Simply put, the owner can block us. However, data breaches and selling user data to other companies are issues.
They can influence the audience's mind since they have control.
Assume Twitter's CEO endorses Donald Trump. Result? Twitter would have promoted Donald Trump with tweets and graphics, enhancing his chances of winning.
We need a decentralized, uncontrollable system.
And then there’s Web3.0 to consider. As Bitcoin and Ethereum values climb, so has its popularity. Web3.0 is uncontrolled web evolution. It's good and bad.
Dapps, DeFi, and DAOs are here. It'll all be explained afterwards.
2. Cryptocurrencies:
No need to elaborate.
Bitcoin, Ethereum, Cardano, and Dogecoin are cryptocurrencies. It's digital money used for payments and other uses.
Programs must interact with cryptocurrencies.
3. Blockchain:
Blockchain facilitates bitcoin transactions, investments, and earnings.
This technology governs Web3. It underpins the web3 environment.
Let us delve much deeper.
Blockchain is simple. However, the name expresses the meaning.
Blockchain is a chain of blocks.
Let's use an image if you don't understand.
The graphic above explains blockchain. Think Blockchain. The block stores related data.
Here's more.
4. Smart contracts
Programmers and developers must write programs. Smart contracts are these blockchain apps.
That’s reasonable.
Decentralized web3.0 requires immutable smart contracts or programs.
5. NFTs
Blockchain art is NFT. Non-Fungible Tokens.
Explaining Non-Fungible Token may help.
Two sorts of tokens:
These tokens are fungible, meaning they can be changed. Think of Bitcoin or cash. The token won't change if you sell one Bitcoin and acquire another.
Non-Fungible Token: Since these tokens cannot be exchanged, they are exclusive. For instance, music, painting, and so forth.
Right now, Companies and even individuals are currently developing worthless NFTs.
The concept of NFTs is much improved when properly handled.
6. Dapp
Decentralized apps are Dapps. Instagram, Twitter, and Medium apps in the same way that there is a lot of decentralized blockchain app.
Curve, Yearn Finance, OpenSea, Axie Infinity, etc. are dapps.
7. DAOs
DAOs are member-owned and governed.
Consider it a company with a core group of contributors.
8. DeFi
We all utilize centrally regulated financial services. We fund these banks.
If you have $10,000 in your bank account, the bank can invest it and retain the majority of the profits.
We only get a penny back. Some banks offer poor returns. To secure a loan, we must trust the bank, divulge our information, and fill out lots of paperwork.
DeFi was built for such issues.
Decentralized banks are uncontrolled. Staking, liquidity, yield farming, and more can earn you money.
Web3 beginners should start with these resources.

Jeff Scallop
3 years ago
The Age of Decentralized Capitalism and DeFi
DeCap is DeFi's killer app.
“Software is eating the world.” Marc Andreesen, venture capitalist
DeFi. Imagine a blockchain-based alternative financial system that offers the same products and services as traditional finance, but with more variety, faster, more secure, lower cost, and simpler access.
Decentralised finance (DeFi) is a marketplace without gatekeepers or central authority managing the flow of money, where customers engage directly with smart contracts running on a blockchain.
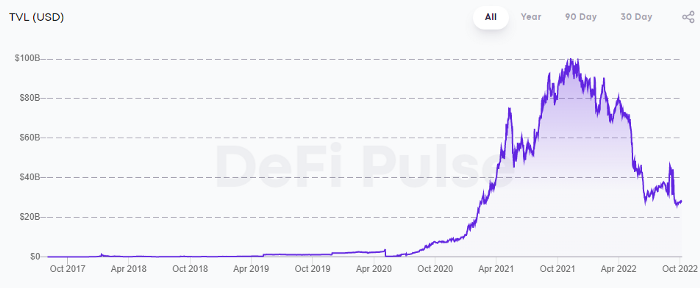
DeFi grew exponentially in 2020/21, with Total Value Locked (an inadequate estimate for market size) topping at $100 billion. After that, it crashed.
The accumulation of funds by individuals with high discretionary income during the epidemic, the novelty of crypto trading, and the high yields given (5% APY for stablecoins on established platforms to 100%+ for risky assets) are among the primary elements explaining this exponential increase.
No longer your older brothers DeFi
Since transactions are anonymous, borrowers had to overcollateralize DeFi 1.0. To borrow $100 in stablecoins, you must deposit $150 in ETH. DeFi 1.0's business strategy raises two problems.
Why does DeFi offer interest rates that are higher than those of the conventional financial system?;
Why would somebody put down more cash than they intended to borrow?
Maxed out on their own resources, investors took loans to acquire more crypto; the demand for those loans raised DeFi yields, which kept crypto prices increasing; as crypto prices rose, investors made a return on their positions, allowing them to deposit more money and borrow more crypto.
This is a bull market game. DeFi 1.0's overcollateralization speculation is dead. Cryptocrash sank it.
The “speculation by overcollateralisation” world of DeFi 1.0 is dead
At a JP Morgan digital assets conference, institutional investors were more interested in DeFi than crypto or fintech. To me, that shows DeFi 2.0's institutional future.
DeFi 2.0 protocols must handle KYC/AML, tax compliance, market abuse, and cybersecurity problems to be institutional-ready.
Stablecoins gaining market share under benign regulation and more CBDCs coming online in the next couple of years could help DeFi 2.0 separate from crypto volatility.
DeFi 2.0 will have a better footing to finally decouple from crypto volatility
Then we can transition from speculation through overcollateralization to DeFi's genuine comparative advantages: cheaper transaction costs, near-instant settlement, more efficient price discovery, faster time-to-market for financial innovation, and a superior audit trail.
Akin to Amazon for financial goods
Amazon decimated brick-and-mortar shops by offering millions of things online, warehouses by keeping just-in-time inventory, and back-offices by automating invoicing and payments. Software devoured retail. DeFi will eat banking with software.
DeFi is the Amazon for financial items that will replace fintech. Even the most advanced internet brokers offer only 100 currency pairings and limited bonds, equities, and ETFs.
Old banks settlement systems and inefficient, hard-to-upgrade outdated software harm them. For advanced gamers, it's like driving an F1 vehicle on dirt.
It is like driving a F1 car on a dirt road, for the most sophisticated players
Central bankers throughout the world know how expensive and difficult it is to handle cross-border payments using the US dollar as the reserve currency, which is vulnerable to the economic cycle and geopolitical tensions.
Decentralization is the only method to deliver 24h global financial markets. DeFi 2.0 lets you buy and sell startup shares like Google or Tesla. VC funds will trade like mutual funds. Or create a bundle coverage for your car, house, and NFTs. Defi 2.0 consumes banking and creates Global Wall Street.
Defi 2.0 is how software eats banking and delivers the global Wall Street
Decentralized Capitalism is Emerging
90% of markets are digital. 10% is hardest to digitalize. That's money creation, ID, and asset tokenization.
90% of financial markets are already digital. The only problem is that the 10% left is the hardest to digitalize
Debt helped Athens construct a powerful navy that secured trade routes. Bonds financed the Renaissance's wars and supply chains. Equity fueled industrial growth. FX drove globalization's payments system. DeFi's plans:
If the 20th century was a conflict between governments and markets over economic drivers, the 21st century will be between centralized and decentralized corporate structures.
Offices vs. telecommuting. China vs. onshoring/friendshoring. Oil & gas vs. diverse energy matrix. National vs. multilateral policymaking. DAOs vs. corporations Fiat vs. crypto. TradFi vs.
An age where the network effects of the sharing economy will overtake the gains of scale of the monopolistic competition economy
This is the dawn of Decentralized Capitalism (or DeCap), an age where the network effects of the sharing economy will reach a tipping point and surpass the scale gains of the monopolistic competition economy, further eliminating inefficiencies and creating a more robust economy through better data and automation. DeFi 2.0 enables this.
DeFi needs to pay the piper now.
DeCap won't be Web3.0's Shangri-La, though. That's too much for an ailing Atlas. When push comes to shove, DeFi folks want to survive and fight another day for the revolution. If feasible, make a tidy profit.
Decentralization wasn't meant to circumvent regulation. It circumvents censorship. On-ramp, off-ramp measures (control DeFi's entry and exit points, not what happens in between) sound like a good compromise for DeFi 2.0.
The sooner authorities realize that DeFi regulation is made ex-ante by writing code and constructing smart contracts with rules, the faster DeFi 2.0 will become the more efficient and safe financial marketplace.
More crucially, we must boost system liquidity. DeFi's financial stability risks are downplayed. DeFi must improve its liquidity management if it's to become mainstream, just as banks rely on capital constraints.
This reveals the complex and, frankly, inadequate governance arrangements for DeFi protocols. They redistribute control from tokenholders to developers, which is bad governance regardless of the economic model.
But crypto can only ride the existing banking system for so long before forming its own economy. DeFi will upgrade web2.0's financial rails till then.
You might also like

Desiree Peralta
3 years ago
Why Now Is Your Chance To Create A Millionaire Career
People don’t believe in influencers anymore; they need people like you.

Social media influencers have dominated for years. We've seen videos, images, and articles of *famous* individuals unwrapping, reviewing, and endorsing things.
This industry generates billions. This year, marketers spent $2.23 billion on Instagram, $1 million on Youtube, and $775 million on Tiktok. This marketing has helped start certain companies.
Influencers are dying, so ordinary people like us may take over this billion-dollar sector. Why?
Why influencers are perishing
Most influencers lie to their fans, especially on Instagram. Influencers' first purpose was to make their lives so flawless that others would want to buy their stuff.
In 2015, an Australian influencer with 600,000 followers went viral for revealing all her photos and everything she did to seem great before deleting her account.
“I dramatically edited the pictures, I manipulated the environements, and made my life look perfect in social media… I remember I obsessively checked the like count for a full week since uploading it, a selfie that now has close to 2,500 likes. It got 5 likes. This was when I was so hungry for social media validation … This was the reason why I quit social media: for me, personally, it consumed me. I wasn’t living in a 3D world.”
Influencers then lost credibility.
Influencers seem to live in a bubble, separate from us. Thanks to self-popularity love's and constant awareness campaigns, people find these people ridiculous.
Influencers are praised more for showing themselves as natural and common than for showing luxuries and lies.

Little by little, they are dying, making room for a new group to take advantage of this multi-million dollar business, which gives us (ordinary people) a big opportunity to grow on any content creation platform we want.
Why this is your chance to develop on any platform for creating content
In 2021, I wrote “Not everyone who talks about money is a Financial Advisor, be careful of who you take advice from,”. In it, I warned that not everyone with a large following is a reputable source of financial advice.
Other writers hated this post and said I was wrong.
People don't want Jeff Bezos or Elon Musk's counsel, they said. They prefer to hear about their neighbor's restroom problems or his closest friend's terrible business.
Real advice from regular folks.
And I found this was true when I returned to my independent YouTube channel and had more than 1000 followers after having abandoned it with fewer than 30 videos in 2021 since there were already many personal finance and travel channels and I thought mine wasn't special.
People appreciated my videos because I was a 20-something girl trying to make money online, and they believed my advice more than that of influencers with thousands of followers.
I think today is the greatest time to grow on any platform as an ordinary person. Normal individuals give honest recommendations about what works for them and look easier to make because they have the same options as us.
Nobody cares how a millionaire acquired a Lamborghini unless it's entertaining. Education works now. Real counsel from average people is replicable.
Many individuals don't appreciate how false influencers seem (unreal bodies and excessive surgery and retouching) since it makes them feel uneasy.
That's why body-positive advertisements have been so effective, but they've lost ground in places like Tiktok, where the audience wants more content from everyday people than influencers living amazing lives. More people will relate to your content if you appear genuine.
Last thoughts
Influencers are dwindling. People want more real people to give real advice and demonstrate an ordinary life.
People will enjoy anything you tell about your daily life as long as you provide value, and you can build a following rapidly if you're honest.
This is a millionaire industry that is getting more expensive and will go with what works, so stand out immediately.

Bernard Bado
3 years ago
Build This Before Someone Else Does!

Do you want to build and launch your own software company? To do this, all you need is a product that solves a problem.
Coming up with profitable ideas is not that easy. But you’re in luck because you got me!
I’ll give you the idea for free. All you need to do is execute it properly.
If you’re ready, let’s jump right into it! Starting with the problem.
Problem
Youtube has many creators. Every day, they think of new ways to entertain or inform us.
They work hard to make videos. Many of their efforts go to waste. They limit their revenue and reach.
Solution
Content repurposing solves this problem.
One video can become several TikToks. Creating YouTube videos from a podcast episode.
Or, one video might become a blog entry.
By turning videos into blog entries, Youtubers may develop evergreen SEO content, attract a new audience, and reach a non-YouTube audience.
Many YouTube creators want this easy feature.
Let's build it!
Implementation
We identified the problem, and we have a solution. All that’s left to do is see how it can be done.
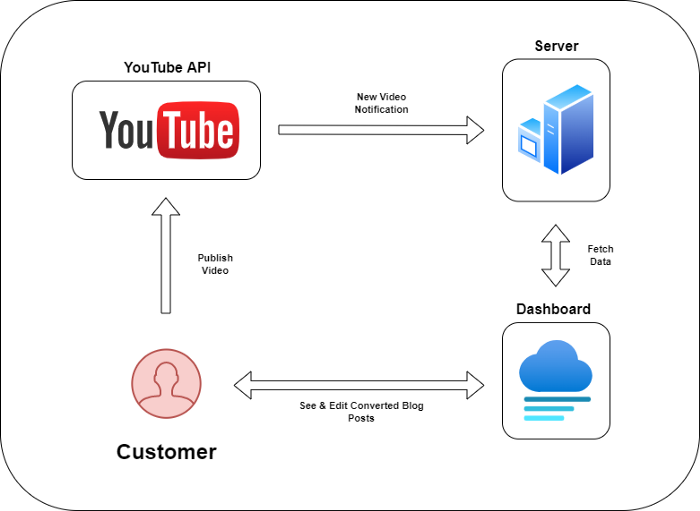
Monitoring new video uploads
First, watch when a friend uploads a new video. Everything should happen automatically without user input.
YouTube Webhooks make this easy. Our server listens for YouTube Webhook notifications.
After publishing a new video, we create a conversion job.
Creating a Blog Post from a Video
Next, turn a video into a blog article.
To convert, we must extract the video's audio (which can be achieved by using FFmpeg on the server).
Once we have the audio channel, we can use speech-to-text.
Services can accomplish this easily.
Speech-to-text on Google
Google Translate
Deepgram
Deepgram's affordability and integration make it my pick.
After conversion, the blog post needs formatting, error checking, and proofreading.
After this, a new blog post will appear in our web app's dashboard.
Completing a blog post
After conversion, users must examine and amend their blog posts.
Our application dashboard would handle all of this. It's a dashboard-style software where users can:
Link their Youtube account
Check out the converted videos in the future.
View the conversions that are ongoing.
Edit and format converted blog articles.
It's a web-based app.
It doesn't matter how it's made but I'd choose Next.js.
Next.js is a React front-end standard. Vercel serverless functions could conduct the conversions.
This would let me host the software for free and reduce server expenditures.
Taking It One Step Further
SaaS in a nutshell. Future improvements include integrating with WordPress or Ghost.
Our app users could then publish blog posts. Streamlining the procedure.
MVPs don't need this functionality.
Final Thoughts
Repurposing content helps you post more often, reach more people, and develop faster.
Many agencies charge a fortune for this service. Handmade means pricey.
Content creators will go crazy if you automate and cheaply solve this problem.
Just execute this idea!

Jari Roomer
3 years ago
5 ways to never run out of article ideas
“Perfectionism is the enemy of the idea muscle. " — James Altucher

Writer's block is a typical explanation for low output. Success requires productivity.
In four years of writing, I've never had writer's block. And you shouldn't care.
You'll never run out of content ideas if you follow a few tactics. No, I'm not overpromising.
Take Note of Ideas
Brains are strange machines. Blank when it's time to write. Idiot. Nothing. We get the best article ideas when we're away from our workstation.
In the shower
Driving
In our dreams
Walking
During dull chats
Meditating
In the gym
No accident. The best ideas come in the shower, in nature, or while exercising.
(Your workstation is the worst place for creativity.)
The brain has time and space to link 'dots' of information during rest. It's eureka! New idea.
If you're serious about writing, capture thoughts as they come.
Immediately write down a new thought. Capture it. Don't miss it. Your future self will thank you.
As a writer, entrepreneur, or creative, letting ideas slide is bad.
I recommend using Evernote, Notion, or your device's basic note-taking tool to capture article ideas.
It doesn't matter whatever app you use as long as you collect article ideas.
When you practice 'idea-capturing' enough, you'll have an unending list of article ideas when writer's block hits.
High-Quality Content
More books, films, Medium pieces, and Youtube videos I consume, the more I'm inspired to write.
What you eat shapes who you are.
Celebrity gossip and fear-mongering news won't help your writing. It won't help you write regularly.
Instead, read expert-written books. Watch documentaries to improve your worldview. Follow amazing people online.
Develop your 'idea muscle' Daily creativity takes practice. The more you exercise your 'idea muscles,' the easier it is to generate article ideas.
I've trained my 'concept muscle' using James Altucher's exercise.
Write 10 ideas daily.
Write ten book ideas every day if you're an author. Write down 10 business ideas per day if you're an entrepreneur. Write down 10 investing ideas per day.
Write 10 article ideas per day. You become a content machine.
It doesn't state you need ten amazing ideas. You don't need 10 ideas. Ten ideas, regardless of quality.
Like at the gym, reps are what matter. With each article idea, you gain creativity. Writer's block is no match for this workout.
Quit Perfectionism
Perfectionism is bad for writers. You'll have bad articles. You'll have bad ideas. OK. It's creative.
Writing success requires prolificacy. You can't have 'perfect' articles.
“Perfectionism is the enemy of the idea muscle. Perfectionism is your brain trying to protect you from harm.” — James Altucher
Vincent van Gogh painted 900 pieces. The Starry Night is the most famous.
Thomas Edison invented 1093 things, but not all were as important as the lightbulb or the first movie camera.
Mozart composed nearly 600 compositions, but only Serenade No13 became popular.
Always do your best. Perfectionism shouldn't stop you from working. Write! Publicize. Make. Even if imperfect.
Write Your Story
Living an interesting life gives you plenty to write about. If you travel a lot, share your stories or lessons learned.
Describe your business's successes and shortcomings.
Share your experiences with difficulties or addictions.
More experiences equal more writing material.
If you stay indoors, perusing social media, you won't be inspired to write.
Have fun. Travel. Strive. Build a business. Be bold. Live a life worth writing about, and you won't run out of material.