


More on Leadership

Nir Zicherman
3 years ago
The Great Organizational Conundrum
Only two of the following three options can be achieved: consistency, availability, and partition tolerance

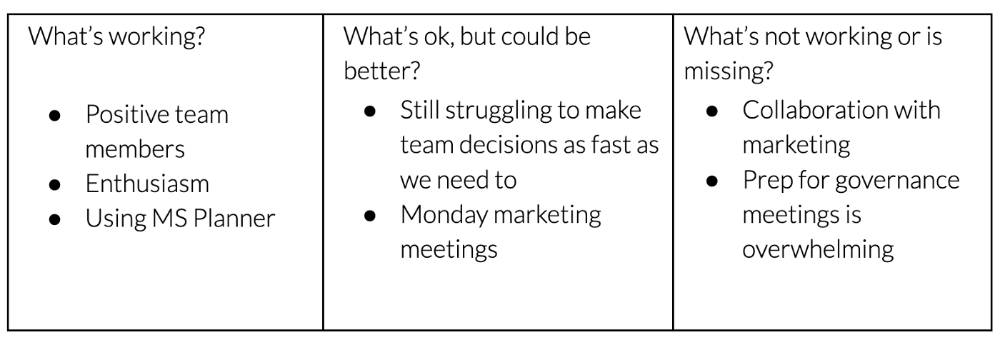
Someone told me that growing from 30 to 60 is the biggest adjustment for a team or business.
I remember thinking, That's random. Each company is unique. I've seen teams of all types confront the same issues during development periods. With new enterprises starting every year, we should be better at navigating growing difficulties.
As a team grows, its processes and systems break down, requiring reorganization or declining results. Why always? Why isn't there a perfect scaling model? Why hasn't that been found?
The Three Things Productive Organizations Must Have
Any company should be efficient and productive. Three items are needed:
First, it must verify that no two team members have conflicting information about the roadmap, strategy, or any input that could affect execution. Teamwork is required.
Second, it must ensure that everyone can receive the information they need from everyone else quickly, especially as teams become more specialized (an inevitability in a developing organization). It requires everyone's accessibility.
Third, it must ensure that the organization can operate efficiently even if a piece is unavailable. It's partition-tolerant.
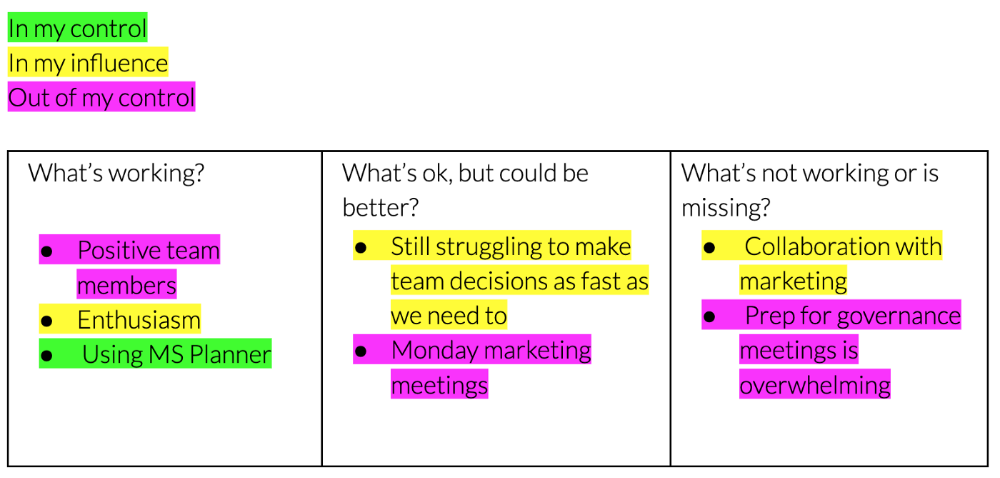
From my experience with the many teams I've been on, invested in, or advised, achieving all three is nearly impossible. Why a perfect organization model cannot exist is clear after analysis.
The CAP Theorem: What is it?
Eric Brewer of Berkeley discovered the CAP Theorem, which argues that a distributed data storage should have three benefits. One can only have two at once.
The three benefits are consistency, availability, and partition tolerance, which implies that even if part of the system is offline, the remainder continues to work.
This notion is usually applied to computer science, but I've realized it's also true for human organizations. In a post-COVID world, many organizations are hiring non-co-located staff as they grow. CAP Theorem is more important than ever. Growing teams sometimes think they can develop ways to bypass this law, dooming themselves to a less-than-optimal team dynamic. They should adopt CAP to maximize productivity.
Path 1: Consistency and availability equal no tolerance for partitions
Let's imagine you want your team to always be in sync (i.e., for someone to be the source of truth for the latest information) and to be able to share information with each other. Only division into domains will do.
Numerous developing organizations do this, especially after the early stage (say, 30 people) when everyone may wear many hats and be aware of all the moving elements. After a certain point, it's tougher to keep generalists aligned than to divide them into specialized tasks.
In a specialized, segmented team, leaders optimize consistency and availability (i.e. every function is up-to-speed on the latest strategy, no one is out of sync, and everyone is able to unblock and inform everyone else).
Partition tolerance suffers. If any component of the organization breaks down (someone goes on vacation, quits, underperforms, or Gmail or Slack goes down), productivity stops. There's no way to give the team stability, availability, and smooth operation during a hiccup.
Path 2: Partition Tolerance and Availability = No Consistency
Some businesses avoid relying too heavily on any one person or sub-team by maximizing availability and partition tolerance (the organization continues to function as a whole even if particular components fail). Only redundancy can do that. Instead of specializing each member, the team spreads expertise so people can work in parallel. I switched from Path 1 to Path 2 because I realized too much reliance on one person is risky.
What happens after redundancy? Unreliable. The more people may run independently and in parallel, the less anyone can be the truth. Lack of alignment or updated information can lead to people executing slightly different strategies. So, resources are squandered on the wrong work.
Path 3: Partition and Consistency "Tolerance" equates to "absence"
The third, least-used path stresses partition tolerance and consistency (meaning answers are always correct and up-to-date). In this organizational style, it's most critical to maintain the system operating and keep everyone aligned. No one is allowed to read anything without an assurance that it's up-to-date (i.e. there’s no availability).
Always short-lived. In my experience, a business that prioritizes quality and scalability over speedy information transmission can get bogged down in heavy processes that hinder production. Large-scale, this is unsustainable.
Accepting CAP
When two puzzle pieces fit, the third won't. I've watched developing teams try to tackle these difficulties, only to find, as their ancestors did, that they can never be entirely solved. Idealized solutions fail in reality, causing lost effort, confusion, and lower production.
As teams develop and change, they should embrace CAP, acknowledge there is a limit to productivity in a scaling business, and choose the best two-out-of-three path.

Caspar Mahoney
3 years ago
Changing Your Mindset From a Project to a Product
Product game mindsets? How do these vary from Project mindset?

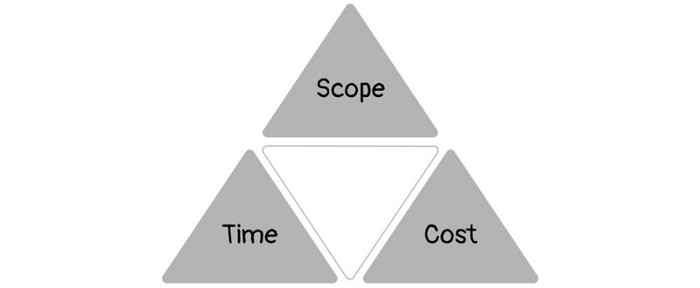
1950s spawned the Iron Triangle. Project people everywhere know and live by it. In stakeholder meetings, it is used to stretch the timeframe, request additional money, or reduce scope.
Quality was added to this triangle as things matured.
Quality was intended to be transformative, but none of these principles addressed why we conduct projects.
Value and benefits are key.
Product value is quantified by ROI, revenue, profit, savings, or other metrics. For me, every project or product delivery is about value.
Most project managers, especially those schooled 5-10 years or more ago (thousands working in huge corporations worldwide), understand the world in terms of the iron triangle. What does that imply? They worry about:
a) enough time to get the thing done.
b) have enough resources (budget) to get the thing done.
c) have enough scope to fit within (a) and (b) >> note, they never have too little scope, not that I have ever seen! although, theoretically, this could happen.
Boom—iron triangle.
To make the triangle function, project managers will utilize formal governance (Steering) to move those things. Increase money, scope, or both if time is short. Lacking funds? Increase time, scope, or both.
In current product development, shifting each item considerably may not yield value/benefit.
Even terrible. This approach will fail because it deprioritizes Value/Benefit by focusing the major stakeholders (Steering participants) and delivery team(s) on Time, Scope, and Budget restrictions.
Pre-agile, this problem was terrible. IT projects failed wildly. History is here.
Value, or benefit, is central to the product method. Product managers spend most of their time planning value-delivery paths.
Product people consider risk, schedules, scope, and budget, but value comes first. Let me illustrate.
Imagine managing internal products in an enterprise. Your core customer team needs a rapid text record of a chat to fix a problem. The consumer wants a feature/features added to a product you're producing because they think it's the greatest spot.
Project-minded, I may say;
Ok, I have budget as this is an existing project, due to run for a year. This is a new requirement to add to the features we’re already building. I think I can keep the deadline, and include this scope, as it sounds related to the feature set we’re building to give the desired result”.
This attitude repeats Scope, Time, and Budget.
Since it meets those standards, a project manager will likely approve it. If they have a backlog, they may add it and start specking it out assuming it will be built.
Instead, think like a product;
What problem does this feature idea solve? Is that problem relevant to the product I am building? Can that problem be solved quicker/better via another route ? Is it the most valuable problem to solve now? Is the problem space aligned to our current or future strategy? or do I need to alter/update the strategy?
A product mindset allows you to focus on timing, resource/cost, feasibility, feature detail, and so on after answering the aforementioned questions.
The above oversimplifies because
Leadership in discovery

Project managers are facilitators of ideas. This is as far as they normally go in the ‘idea’ space.
Business Requirements collection in classic project delivery requires extensive upfront documentation.
Agile project delivery analyzes requirements iteratively.
However, the project manager is a facilitator/planner first and foremost, therefore topic knowledge is not expected.
I mean business domain, not technical domain (to confuse matters, it is true that in some instances, it can be both technical and business domains that are important for a single individual to master).
Product managers are domain experts. They will become one if they are training/new.
They lead discovery.
Product Manager-led discovery is much more than requirements gathering.
Requirements gathering involves a Business Analyst interviewing people and documenting their requests.
The project manager calculates what fits and what doesn't using their Iron Triangle (presumably in their head) and reports back to Steering.
If this requirements-gathering exercise failed to identify requirements, what would a project manager do? or bewildered by project requirements and scope?
They would tell Steering they need a Business SME or Business Lead assigning or more of their time.
Product discovery requires the Product Manager's subject knowledge and a new mindset.
How should a Product Manager handle confusing requirements?
Product Managers handle these challenges with their talents and tools. They use their own knowledge to fill in ambiguity, but they have the discipline to validate those assumptions.
To define the problem, they may perform qualitative or quantitative primary research.
They might discuss with UX and Engineering on a whiteboard and test assumptions or hypotheses.
Do Product Managers escalate confusing requirements to Steering/Senior leaders? They would fix that themselves.
Product managers raise unclear strategy and outcomes to senior stakeholders. Open talks, soft skills, and data help them do this. They rarely raise requirements since they have their own means of handling them without top stakeholder participation.
Discovery is greenfield, exploratory, research-based, and needs higher-order stakeholder management, user research, and UX expertise.
Product Managers also aid discovery. They lead discovery. They will not leave customer/user engagement to a Business Analyst. Administratively, a business analyst could aid. In fact, many product organizations discourage business analysts (rely on PM, UX, and engineer involvement with end-users instead).
The Product Manager must drive user interaction, research, ideation, and problem analysis, therefore a Product professional must be skilled and confident.
Creating vs. receiving and having an entrepreneurial attitude

Product novices and project managers focus on details rather than the big picture. Project managers prefer spreadsheets to strategy whiteboards and vision statements.
These folks ask their manager or senior stakeholders, "What should we do?"
They then elaborate (in Jira, in XLS, in Confluence or whatever).
They want that plan populated fast because it reduces uncertainty about what's going on and who's supposed to do what.
Skilled Product Managers don't only ask folks Should we?
They're suggesting this, or worse, Senior stakeholders, here are some options. After asking and researching, they determine what value this product adds, what problems it solves, and what behavior it changes.
Therefore, to move into Product, you need to broaden your view and have courage in your ability to discover ideas, find insightful pieces of information, and collate them to form a valuable plan of action. You are constantly defining RoI and building Business Cases, so much so that you no longer create documents called Business Cases, it is simply ingrained in your work through metrics, intelligence, and insights.
Product Management is not a free lunch.
Plateless.
Plates and food must be prepared.
In conclusion, Product Managers must make at least three mentality shifts:
You put value first in all things. Time, money, and scope are not as important as knowing what is valuable.
You have faith in the field and have the ability to direct the search. YYou facilitate, but you don’t just facilitate. You wouldn't want to limit your domain expertise in that manner.
You develop concepts, strategies, and vision. You are not a waiter or an inbox where other people can post suggestions; you don't merely ask folks for opinion and record it. However, you excel at giving things that aren't clearly spoken or written down physical form.

William Anderson
3 years ago
When My Remote Leadership Skills Took Off
4 Ways To Manage Remote Teams & Employees
The wheels hit the ground as I landed in Rochester.
Our six-person satellite office was now part of my team.
Their manager only reported to me the day before, but I had my ticket booked ahead of time.
I had managed remote employees before but this was different. Engineers dialed into headquarters for every meeting.
So when I learned about the org chart change, I knew a strong first impression would set the tone for everything else.
I was either their boss, or their boss's boss, and I needed them to know I was committed.
Managing a fleet of satellite freelancers or multiple offices requires treating others as more than just a face behind a screen.
You must comprehend each remote team member's perspective and daily interactions.
The good news is that you can start using these techniques right now to better understand and elevate virtual team members.
1. Make Visits To Other Offices
If budgeted, visit and work from offices where teams and employees report to you. Only by living alongside them can one truly comprehend their problems with communication and other aspects of modern life.
2. Have Others Come to You
• Having remote, distributed, or satellite employees and teams visit headquarters every quarter or semi-quarterly allows the main office culture to rub off on them.
When remote team members visit, more people get to meet them, which builds empathy.
If you can't afford to fly everyone, at least bring remote managers or leaders. Hopefully they can resurrect some culture.
3. Weekly Work From Home
No home office policy?
Make one.
WFH is a team-building, problem-solving, and office-viewing opportunity.
For dial-in meetings, I started working from home on occasion.
It also taught me which teams “forget” or “skip” calls.
As a remote team member, you experience all the issues first hand.
This isn't as accurate for understanding teams in other offices, but it can be done at any time.
4. Increase Contact Even If It’s Just To Chat
Don't underestimate office banter.
Sometimes it's about bonding and trust, other times it's about business.
If you get all this information in real-time, please forward it.
Even if nothing critical is happening, call remote team members to check in and chat.
I guarantee that building relationships and rapport will increase both their job satisfaction and yours.
You might also like

Sam Warain
3 years ago
The Brilliant Idea Behind Kim Kardashian's New Private Equity Fund

Kim Kardashian created Skky Partners. Consumer products, internet & e-commerce, consumer media, hospitality, and luxury are company targets.
Some call this another Kardashian publicity gimmick.

This maneuver is brilliance upon closer inspection. Why?
1) Kim has amassed a sizable social media fan base:
Over 320 million Instagram and 70 million Twitter users follow Kim Kardashian.
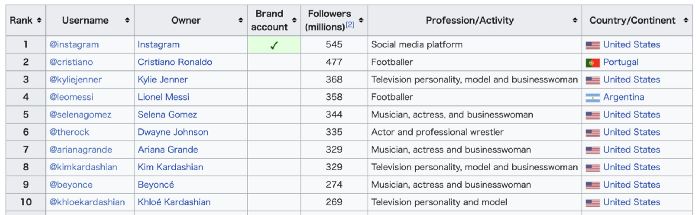
Kim Kardashian's Instagram account ranks 8th. Three Kardashians in top 10 is ridiculous.
This gives her access to consumer data. She knows what people are discussing. Investment firms need this data.
Quality, not quantity, of her followers matters. Studies suggest that her following are more engaged than Selena Gomez and Beyonce's.
Kim's followers are worth roughly $500 million to her brand, according to a research. They trust her and buy what she recommends.
2) She has a special aptitude for identifying trends.
Kim Kardashian can sense trends.
She's always ahead of fashion and beauty trends. She's always trying new things, too. She doesn't mind making mistakes when trying anything new. Her desire to experiment makes her a good business prospector.
Kim has also created a lifestyle brand that followers love. Kim is an entrepreneur, mom, and role model, not just a reality TV star or model. She's established a brand around her appearance, so people want to buy her things.
Her fragrance collection has sold over $100 million since its 2009 introduction, and her Sears apparel line did over $200 million in its first year.
SKIMS is her latest $3.2bn brand. She can establish multibillion-dollar firms with her enormous distribution platform.
Early founders would kill for Kim Kardashian's network.
Making great products is hard, but distribution is more difficult. — David Sacks, All-in-Podcast
3) She can delegate the financial choices to Jay Sammons, one of the greatest in the industry.
Jay Sammons is well-suited to develop Kim Kardashian's new private equity fund.
Sammons has 16 years of consumer investing experience at Carlyle. This will help Kardashian invest in consumer-facing enterprises.
Sammons has invested in Supreme and Beats Electronics, both of which have grown significantly. Sammons' track record and competence make him the obvious choice.
Kim Kardashian and Jay Sammons have joined forces to create a new business endeavor. The agreement will increase Kardashian's commercial empire. Sammons can leverage one of the world's most famous celebrities.
“Together we hope to leverage our complementary expertise to build the next generation consumer and media private equity firm” — Kim Kardashian
Kim Kardashian is a successful businesswoman. She developed an empire by leveraging social media to connect with fans. By developing a global lifestyle brand, she has sold things and experiences that have made her one of the world's richest celebrities.
She's a shrewd entrepreneur who knows how to maximize on herself and her image.
Imagine how much interest Kim K will bring to private equity and venture capital.
I'm curious about the company's growth.

Alex Bentley
3 years ago
Why Bill Gates thinks Bitcoin, crypto, and NFTs are foolish
Microsoft co-founder Bill Gates assesses digital assets while the bull is caged.

Bill Gates is well-respected.
Reasonably. He co-founded and led Microsoft during its 1980s and 1990s revolution.
After leaving Microsoft, Bill Gates pursued other interests. He and his wife founded one of the world's largest philanthropic organizations, Bill & Melinda Gates Foundation. He also supports immunizations, population control, and other global health programs.
When Gates criticized Bitcoin, cryptocurrencies, and NFTs, it made news.
Bill Gates said at the 58th Munich Security Conference...
“You have an asset class that’s 100% based on some sort of greater fool theory that somebody’s going to pay more for it than I do.”
Gates means digital assets. Like many bitcoin critics, he says digital coins and tokens are speculative.
And he's not alone. Financial experts have dubbed Bitcoin and other digital assets a "bubble" for a decade.
Gates also made fun of Bored Ape Yacht Club and NFTs, saying, "Obviously pricey digital photographs of monkeys will help the world."
Why does Bill Gates dislike digital assets?
According to Gates' latest comments, Bitcoin, cryptos, and NFTs aren't good ways to hold value.
Bill Gates is a better investor than Elon Musk.
“I’m used to asset classes, like a farm where they have output, or like a company where they make products,” Gates said.
The Guardian claimed in April 2021 that Bill and Melinda Gates owned the most U.S. farms. Over 242,000 acres of farmland.
The Gates couple has enough farmland to cover Hong Kong.

Bill Gates is a classic investor. He wants companies with an excellent track record, strong fundamentals, and good management. Or tangible assets like land and property.
Gates prefers the "old economy" over the "new economy"
Gates' criticism of Bitcoin and cryptocurrency ventures isn't surprising. These digital assets lack all of Gates's investing criteria.
Volatile digital assets include Bitcoin. Their costs might change dramatically in a day. Volatility scares risk-averse investors like Gates.
Gates has a stake in the old financial system. As Microsoft's co-founder, Gates helped develop a dominant tech company.
Because of his business, he's one of the world's richest men.
Bill Gates is invested in protecting the current paradigm.
He won't invest in anything that could destroy the global economy.
When Gates criticizes Bitcoin, cryptocurrencies, and NFTs, he's suggesting they're a hoax. These soapbox speeches are one way he protects his interests.
Digital assets aren't a bad investment, though. Many think they're the future.
Changpeng Zhao and Brian Armstrong are two digital asset billionaires. Two crypto exchange CEOs. Binance/Coinbase.
Digital asset revolution won't end soon.
If you disagree with Bill Gates and plan to invest in Bitcoin, cryptocurrencies, or NFTs, do your own research and understand the risks.
But don’t take Bill Gates’ word for it.
He’s just an old rich guy with a lot of farmland.
He has a lot to lose if Bitcoin and other digital assets gain global popularity.
This post is a summary. Read the full article here.

Trent Lapinski
4 years ago
What The Hell Is A Crypto Punk?
We are Crypto Punks, and we are changing your world.
A “Crypto Punk” is a new generation of entrepreneurs who value individual liberty and collective value creation and co-creation through decentralization. While many Crypto Punks were born and raised in a digital world, some of the early pioneers in the crypto space are from the Oregon Trail generation. They were born to an analog world, but grew up simultaneously alongside the birth of home computing, the Internet, and mobile computing.
A Crypto Punk’s world view is not the same as previous generations. By the time most Crypto Punks were born everything from fiat currency, the stock market, pharmaceuticals, the Internet, to advanced operating systems and microprocessing were already present or emerging. Crypto Punks were born into pre-existing conditions and systems of control, not governed by logic or reason but by greed, corporatism, subversion, bureaucracy, censorship, and inefficiency.
All Systems Are Human Made
Crypto Punks understand that all systems were created by people and that previous generations did not have access to information technologies that we have today. This is why Crypto Punks have different values than their parents, and value liberty, decentralization, equality, social justice, and freedom over wealth, money, and power. They understand that the only path forward is to work together to build new and better systems that make the old world order obsolete.
Unlike the original cypher punks and cyber punks, Crypto Punks are a new iteration or evolution of these previous cultures influenced by cryptography, blockchain technology, crypto economics, libertarianism, holographics, democratic socialism, and artificial intelligence. They are tasked with not only undoing the mistakes of previous generations, but also innovating and creating new ways of solving complex problems with advanced technology and solutions.
Where Crypto Punks truly differ is in their understanding that computer systems can exist for more than just engagement and entertainment, but actually improve the human condition by automating bureaucracy and inefficiency by creating more efficient economic incentives and systems.
Crypto Punks Value Transparency and Do Not Trust Flawed, Unequal, and Corrupt Systems
Crypto Punks have a strong distrust for inherently flawed and corrupt systems. This why Crypto Punks value transparency, free speech, privacy, and decentralization. As well as arguably computer systems over human powered systems.
Crypto Punks are the children of the Great Recession, and will never forget the economic corruption that still enslaves younger generations.
Crypto Punks were born to think different, and raised by computers to view reality through an LED looking glass. They will not surrender to the flawed systems of economic wage slavery, inequality, censorship, and subjection. They will literally engineer their own unstoppable financial systems and trade in cryptography over fiat currency merely to prove that belief systems are more powerful than corruption.
Crypto Punks are here to help achieve freedom from world governments, corporations and bankers who monetizine our data to control our lives.
Crypto Punks Decentralize
Despite all the evils of the world today, Crypto Punks know they have the power to create change. This is why Crypto Punks are optimistic about the future despite all the indicators that humanity is destined for failure.
Crypto Punks believe in systems that prioritize people and the planet above profit. Even so, Crypto Punks still believe in capitalistic systems, but only capitalistic systems that incentivize good behaviors that do not violate the common good for the sake of profit.
Cyber Punks Are Co-Creators
We are Crypto Punks, and we will build a better world for all of us. For the true price of creation is not in US dollars, but through working together as equals to replace the unequal and corrupt greedy systems of previous generations.
Where they have failed, Crypto Punks will succeed. Not because we want to, but because we have to. The world we were born into is so corrupt and its systems so flawed and unequal we were never given a choice.
We have to be the change we seek.
We are Crypto Punks.
Either help us, or get out of our way.