


What is Terra? Your guide to the hot cryptocurrency
With cryptocurrencies like Bitcoin, Ether, and Dogecoin gyrating in value over the past few months, many people are looking at so-called stablecoins like Terra to invest in because of their more predictable prices.
Terraform Labs, which oversees the Terra cryptocurrency project, has benefited from its rising popularity. The company said recently that investors like Arrington Capital, Lightspeed Venture Partners, and Pantera Capital have pledged $150 million to help it incubate various crypto projects that are connected to Terra.
Terraform Labs and its partners have built apps that operate on the company’s blockchain technology that helps keep a permanent and shared record of the firm’s crypto-related financial transactions.
Here’s what you need to know about Terra and the company behind it.
What is Terra?
Terra is a blockchain project developed by Terraform Labs that powers the startup’s cryptocurrencies and financial apps. These cryptocurrencies include the Terra U.S. Dollar, or UST, that is pegged to the U.S. dollar through an algorithm.
Terra is a stablecoin that is intended to reduce the volatility endemic to cryptocurrencies like Bitcoin. Some stablecoins, like Tether, are pegged to more conventional currencies, like the U.S. dollar, through cash and cash equivalents as opposed to an algorithm and associated reserve token.
To mint new UST tokens, a percentage of another digital token and reserve asset, Luna, is “burned.” If the demand for UST rises with more people using the currency, more Luna will be automatically burned and diverted to a community pool. That balancing act is supposed to help stabilize the price, to a degree.
“Luna directly benefits from the economic growth of the Terra economy, and it suffers from contractions of the Terra coin,” Terraform Labs CEO Do Kwon said.
Each time someone buys something—like an ice cream—using UST, that transaction generates a fee, similar to a credit card transaction. That fee is then distributed to people who own Luna tokens, similar to a stock dividend.
Who leads Terra?
The South Korean firm Terraform Labs was founded in 2018 by Daniel Shin and Kwon, who is now the company’s CEO. Kwon is a 29-year-old former Microsoft employee; Shin now heads the Chai online payment service, a Terra partner. Kwon said many Koreans have used the Chai service to buy goods like movie tickets using Terra cryptocurrency.
Terraform Labs does not make money from transactions using its crypto and instead relies on outside funding to operate, Kwon said. It has raised $57 million in funding from investors like HashKey Digital Asset Group, Divergence Digital Currency Fund, and Huobi Capital, according to deal-tracking service PitchBook. The amount raised is in addition to the latest $150 million funding commitment announced on July 16.
What are Terra’s plans?
Terraform Labs plans to use Terra’s blockchain and its associated cryptocurrencies—including one pegged to the Korean won—to create a digital financial system independent of major banks and fintech-app makers. So far, its main source of growth has been in Korea, where people have bought goods at stores, like coffee, using the Chai payment app that’s built on Terra’s blockchain. Kwon said the company’s associated Mirror trading app is experiencing growth in China and Thailand.
Meanwhile, Kwon said Terraform Labs would use its latest $150 million in funding to invest in groups that build financial apps on Terra’s blockchain. He likened the scouting and investing in other groups as akin to a “Y Combinator demo day type of situation,” a reference to the popular startup pitch event organized by early-stage investor Y Combinator.
The combination of all these Terra-specific financial apps shows that Terraform Labs is “almost creating a kind of bank,” said Ryan Watkins, a senior research analyst at cryptocurrency consultancy Messari.
In addition to cryptocurrencies, Terraform Labs has a number of other projects including the Anchor app, a high-yield savings account for holders of the group’s digital coins. Meanwhile, people can use the firm’s associated Mirror app to create synthetic financial assets that mimic more conventional ones, like “tokenized” representations of corporate stocks. These synthetic assets are supposed to be helpful to people like “a small retail trader in Thailand” who can more easily buy shares and “get some exposure to the upside” of stocks that they otherwise wouldn’t have been able to obtain, Kwon said. But some critics have said the U.S. Securities and Exchange Commission may eventually crack down on synthetic stocks, which are currently unregulated.
What do critics say?
Terra still has a long way to go to catch up to bigger cryptocurrency projects like Ethereum.
Most financial transactions involving Terra-related cryptocurrencies have originated in Korea, where its founders are based. Although Terra is becoming more popular in Korea thanks to rising interest in its partner Chai, it’s too early to say whether Terra-related currencies will gain traction in other countries.
Terra’s blockchain runs on a “limited number of nodes,” said Messari’s Watkins, referring to the computers that help keep the system running. That helps reduce latency that may otherwise slow processing of financial transactions, he said.
But the tradeoff is that Terra is less “decentralized” than other blockchain platforms like Ethereum, which is powered by thousands of interconnected computing nodes worldwide. That could make Terra less appealing to some blockchain purists.
More on Web3 & Crypto

Vitalik
4 years ago
An approximate introduction to how zk-SNARKs are possible (part 1)
You can make a proof for the statement "I know a secret number such that if you take the word ‘cow', add the number to the end, and SHA256 hash it 100 million times, the output starts with 0x57d00485aa". The verifier can verify the proof far more quickly than it would take for them to run 100 million hashes themselves, and the proof would also not reveal what the secret number is.
In the context of blockchains, this has 2 very powerful applications: Perhaps the most powerful cryptographic technology to come out of the last decade is general-purpose succinct zero knowledge proofs, usually called zk-SNARKs ("zero knowledge succinct arguments of knowledge"). A zk-SNARK allows you to generate a proof that some computation has some particular output, in such a way that the proof can be verified extremely quickly even if the underlying computation takes a very long time to run. The "ZK" part adds an additional feature: the proof can keep some of the inputs to the computation hidden.
You can make a proof for the statement "I know a secret number such that if you take the word ‘cow', add the number to the end, and SHA256 hash it 100 million times, the output starts with 0x57d00485aa". The verifier can verify the proof far more quickly than it would take for them to run 100 million hashes themselves, and the proof would also not reveal what the secret number is.
In the context of blockchains, this has two very powerful applications:
- Scalability: if a block takes a long time to verify, one person can verify it and generate a proof, and everyone else can just quickly verify the proof instead
- Privacy: you can prove that you have the right to transfer some asset (you received it, and you didn't already transfer it) without revealing the link to which asset you received. This ensures security without unduly leaking information about who is transacting with whom to the public.
But zk-SNARKs are quite complex; indeed, as recently as in 2014-17 they were still frequently called "moon math". The good news is that since then, the protocols have become simpler and our understanding of them has become much better. This post will try to explain how ZK-SNARKs work, in a way that should be understandable to someone with a medium level of understanding of mathematics.
Why ZK-SNARKs "should" be hard
Let us take the example that we started with: we have a number (we can encode "cow" followed by the secret input as an integer), we take the SHA256 hash of that number, then we do that again another 99,999,999 times, we get the output, and we check what its starting digits are. This is a huge computation.
A "succinct" proof is one where both the size of the proof and the time required to verify it grow much more slowly than the computation to be verified. If we want a "succinct" proof, we cannot require the verifier to do some work per round of hashing (because then the verification time would be proportional to the computation). Instead, the verifier must somehow check the whole computation without peeking into each individual piece of the computation.
One natural technique is random sampling: how about we just have the verifier peek into the computation in 500 different places, check that those parts are correct, and if all 500 checks pass then assume that the rest of the computation must with high probability be fine, too?
Such a procedure could even be turned into a non-interactive proof using the Fiat-Shamir heuristic: the prover computes a Merkle root of the computation, uses the Merkle root to pseudorandomly choose 500 indices, and provides the 500 corresponding Merkle branches of the data. The key idea is that the prover does not know which branches they will need to reveal until they have already "committed to" the data. If a malicious prover tries to fudge the data after learning which indices are going to be checked, that would change the Merkle root, which would result in a new set of random indices, which would require fudging the data again... trapping the malicious prover in an endless cycle.
But unfortunately there is a fatal flaw in naively applying random sampling to spot-check a computation in this way: computation is inherently fragile. If a malicious prover flips one bit somewhere in the middle of a computation, they can make it give a completely different result, and a random sampling verifier would almost never find out.
It only takes one deliberately inserted error, that a random check would almost never catch, to make a computation give a completely incorrect result.
If tasked with the problem of coming up with a zk-SNARK protocol, many people would make their way to this point and then get stuck and give up. How can a verifier possibly check every single piece of the computation, without looking at each piece of the computation individually? There is a clever solution.
see part 2
:max_bytes(150000):strip_icc():gifv():format(webp)/reiff_headshot-5bfc2a60c9e77c00519a70bd.jpg)
Nathan Reiff
3 years ago
Howey Test and Cryptocurrencies: 'Every ICO Is a Security'
What Is the Howey Test?
To determine whether a transaction qualifies as a "investment contract" and thus qualifies as a security, the Howey Test refers to the U.S. Supreme Court cass: the Securities Act of 1933 and the Securities Exchange Act of 1934. According to the Howey Test, an investment contract exists when "money is invested in a common enterprise with a reasonable expectation of profits from others' efforts."
The test applies to any contract, scheme, or transaction. The Howey Test helps investors and project backers understand blockchain and digital currency projects. ICOs and certain cryptocurrencies may be found to be "investment contracts" under the test.
Understanding the Howey Test
The Howey Test comes from the 1946 Supreme Court case SEC v. W.J. Howey Co. The Howey Company sold citrus groves to Florida buyers who leased them back to Howey. The company would maintain the groves and sell the fruit for the owners. Both parties benefited. Most buyers had no farming experience and were not required to farm the land.
The SEC intervened because Howey failed to register the transactions. The court ruled that the leaseback agreements were investment contracts.
This established four criteria for determining an investment contract. Investing contract:
- An investment of money
- n a common enterprise
- With the expectation of profit
- To be derived from the efforts of others
In the case of Howey, the buyers saw the transactions as valuable because others provided the labor and expertise. An income stream was obtained by only investing capital. As a result of the Howey Test, the transaction had to be registered with the SEC.
Howey Test and Cryptocurrencies
Bitcoin is notoriously difficult to categorize. Decentralized, they evade regulation in many ways. Regardless, the SEC is looking into digital assets and determining when their sale qualifies as an investment contract.
The SEC claims that selling digital assets meets the "investment of money" test because fiat money or other digital assets are being exchanged. Like the "common enterprise" test.
Whether a digital asset qualifies as an investment contract depends on whether there is a "expectation of profit from others' efforts."
For example, buyers of digital assets may be relying on others' efforts if they expect the project's backers to build and maintain the digital network, rather than a dispersed community of unaffiliated users. Also, if the project's backers create scarcity by burning tokens, the test is met. Another way the "efforts of others" test is met is if the project's backers continue to act in a managerial role.
These are just a few examples given by the SEC. If a project's success is dependent on ongoing support from backers, the buyer of the digital asset is likely relying on "others' efforts."
Special Considerations
If the SEC determines a cryptocurrency token is a security, many issues arise. It means the SEC can decide whether a token can be sold to US investors and forces the project to register.
In 2017, the SEC ruled that selling DAO tokens for Ether violated federal securities laws. Instead of enforcing securities laws, the SEC issued a warning to the cryptocurrency industry.
Due to the Howey Test, most ICOs today are likely inaccessible to US investors. After a year of ICOs, then-SEC Chair Jay Clayton declared them all securities.
SEC Chairman Gensler Agrees With Predecessor: 'Every ICO Is a Security'
Howey Test FAQs
How Do You Determine If Something Is a Security?
The Howey Test determines whether certain transactions are "investment contracts." Securities are transactions that qualify as "investment contracts" under the Securities Act of 1933 and the Securities Exchange Act of 1934.
The Howey Test looks for a "investment of money in a common enterprise with a reasonable expectation of profits from others' efforts." If so, the Securities Act of 1933 and the Securities Exchange Act of 1934 require disclosure and registration.
Why Is Bitcoin Not a Security?
Former SEC Chair Jay Clayton clarified in June 2018 that bitcoin is not a security: "Cryptocurrencies: Replace the dollar, euro, and yen with bitcoin. That type of currency is not a security," said Clayton.
Bitcoin, which has never sought public funding to develop its technology, fails the SEC's Howey Test. However, according to Clayton, ICO tokens are securities.
A Security Defined by the SEC
In the public and private markets, securities are fungible and tradeable financial instruments. The SEC regulates public securities sales.
The Supreme Court defined a security offering in SEC v. W.J. Howey Co. In its judgment, the court defines a security using four criteria:
- An investment contract's existence
- The formation of a common enterprise
- The issuer's profit promise
- Third-party promotion of the offering
Read original post.

Robert Kim
4 years ago
Crypto Legislation Might Progress Beyond Talk in 2022
Financial regulators have for years attempted to apply existing laws to the multitude of issues created by digital assets. In 2021, leading federal regulators and members of Congress have begun to call for legislation to address these issues. As a result, 2022 may be the year when federal legislation finally addresses digital asset issues that have been growing since the mining of the first Bitcoin block in 2009.
Digital Asset Regulation in the Absence of Legislation
So far, Congress has left the task of addressing issues created by digital assets to regulatory agencies. Although a Congressional Blockchain Caucus formed in 2016, House and Senate members introduced few bills addressing digital assets until 2018. As of October 2021, Congress has not amended federal laws on financial regulation, which were last significantly revised by the Dodd-Frank Act in 2010, to address digital asset issues.
In the absence of legislation, issues that do not fit well into existing statutes have created problems. An example is the legal status of digital assets, which can be considered to be either securities or commodities, and can even shift from one to the other over time. Years after the SEC’s 2017 report applying the definition of a security to digital tokens, the SEC and the CFTC have yet to clarify the distinction between securities and commodities for the thousands of digital assets in existence.
SEC Chair Gary Gensler has called for Congress to act, stating in August, “We need additional Congressional authorities to prevent transactions, products, and platforms from falling between regulatory cracks.” Gensler has reached out to Sen. Elizabeth Warren (D-Ma.), who has expressed her own concerns about the need for legislation.
Legislation on Digital Assets in 2021
While regulators and members of Congress talked about the need for legislation, and the debate over cryptocurrency tax reporting in the 2021 infrastructure bill generated headlines, House and Senate bills proposing specific solutions to various issues quietly started to emerge.
Digital Token Sales
Several House bills attempt to address securities law barriers to digital token sales—some of them by building on ideas proposed by regulators in past years.
Exclusion from the definition of a security. Congressional Blockchain Caucus members have been introducing bills to exclude digital tokens from the definition of a security since 2018, and they have revived those bills in 2021. They include the Token Taxonomy Act of 2021 (H.R. 1628), successor to identically named bills in 2018 and 2019, and the Securities Clarity Act (H.R. 4451), successor to a 2020 namesake.
Safe harbor. SEC Commissioner Hester Peirce proposed a regulatory safe harbor for token sales in 2020, and two 2021 bills have proposed statutory safe harbors. Rep. Patrick McHenry (R-N.C.), Republican leader of the House Financial Services Committee, introduced a Clarity for Digital Tokens Act of 2021 (H.R. 5496) that would amend the Securities Act to create a safe harbor providing a grace period of exemption from Securities Act registration requirements. The Digital Asset Market Structure and Investor Protection Act (H.R. 4741) from Rep. Don Beyer (D-Va.) would amend the Securities Exchange Act to define a new type of security—a “digital asset security”—and add issuers of digital asset securities to an existing provision for delayed registration of securities.
Stablecoins
Stablecoins—digital currencies linked to the value of the U.S. dollar or other fiat currencies—have not yet been the subject of regulatory action, although Treasury Secretary Janet Yellen and Federal Reserve Chair Jerome Powell have each underscored the need to create a regulatory framework for them. The Beyer bill proposes to create a regulatory regime for stablecoins by amending Title 31 of the U.S. Code. Treasury Department approval would be required for any “digital asset fiat-based stablecoin” to be issued or used, under an application process to be established by Treasury in consultation with the Federal Reserve, the SEC, and the CFTC.
Serious consideration for any of these proposals in the current session of Congress may be unlikely. A spate of autumn bills on crypto ransom payments (S. 2666, S. 2923, S. 2926, H.R. 5501) shows that Congress is more inclined to pay attention first to issues that are more spectacular and less arcane. Moreover, the arcaneness of digital asset regulatory issues is likely only to increase further, now that major industry players such as Coinbase and Andreessen Horowitz are starting to roll out their own regulatory proposals.
Digital Dollar vs. Digital Yuan
Impetus to pass legislation on another type of digital asset, a central bank digital currency (CBDC), may come from a different source: rivalry with China.
China established itself as a world leader in developing a CBDC with a pilot project launched in 2020, and in 2021, the People’s Bank of China announced that its CBDC will be used at the Beijing Winter Olympics in February 2022. Republican Senators responded by calling for the U.S. Olympic Committee to forbid use of China’s CBDC by U.S. athletes in Beijing and introducing a bill (S. 2543) to require a study of its national security implications.
The Beijing Olympics could motivate a legislative mandate to accelerate implementation of a U.S. digital dollar, which the Federal Reserve has been in the process of considering in 2021. Antecedents to such legislation already exist. A House bill sponsored by 46 Republicans (H.R. 4792) has a provision that would require the Treasury Department to assess China’s CBDC project and report on the status of Federal Reserve work on a CBDC, and the Beyer bill includes a provision amending the Federal Reserve Act to authorize issuing a digital dollar.
Both parties are likely to support creating a digital dollar. The Covid-19 pandemic made a digital dollar for delivery of relief payments a popular idea in 2020, and House Democrats introduced bills with provisions for creating one in 2020 and 2021. Bipartisan support for a bill on a digital dollar, based on concerns both foreign and domestic in nature, could result.
International rivalry and bipartisan support may make the digital dollar a gateway issue for digital asset legislation in 2022. Legislative work on a digital dollar may open the door for considering further digital asset issues—including the regulatory issues that have been emerging for years—in 2022 and beyond.
You might also like

Tomas Pueyo
2 years ago
Soon, a Starship Will Transform Humanity
SpaceX's Starship.
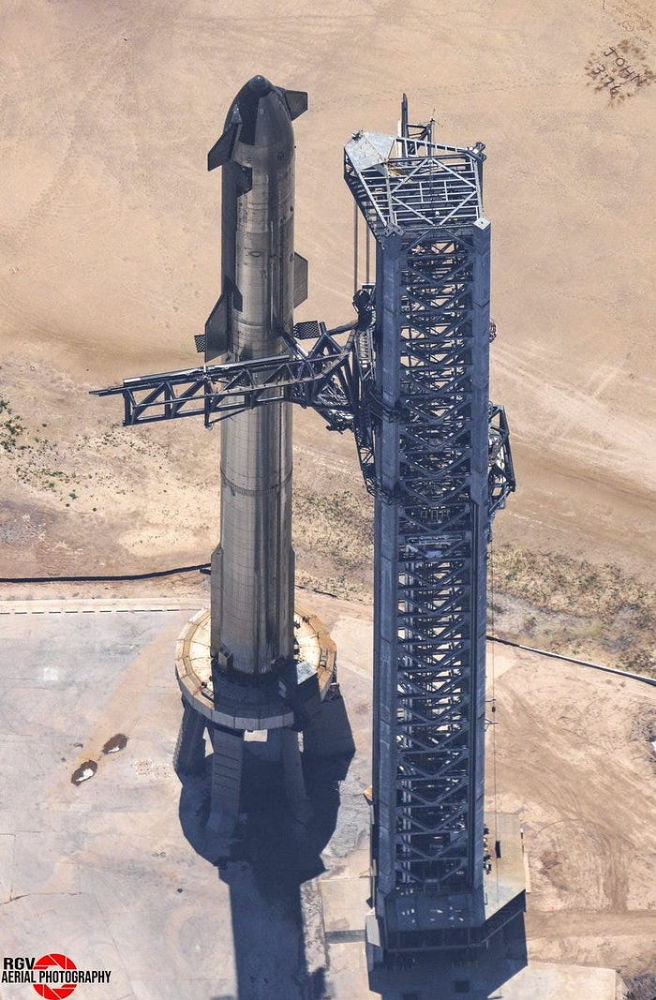
Launched last week.
Four minutes in:
SpaceX will succeed. When it does, its massiveness will matter.
Its payload will revolutionize space economics.
Civilization will shift.
We don't yet understand how this will affect space and Earth culture. Grab it.
The Cost of Space Transportation Has Decreased Exponentially
Space launches have increased dramatically in recent years.
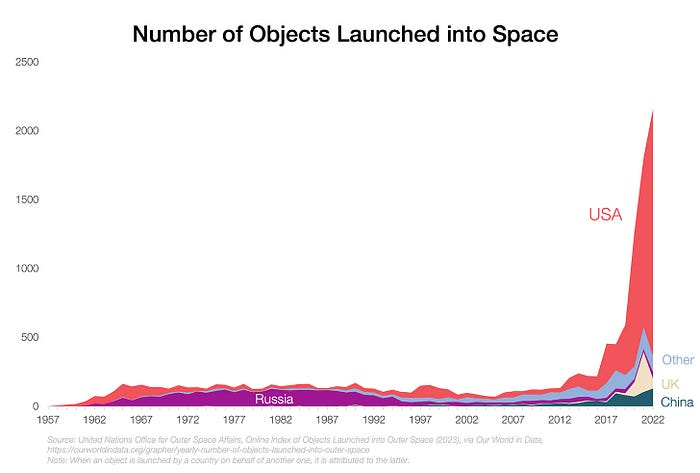
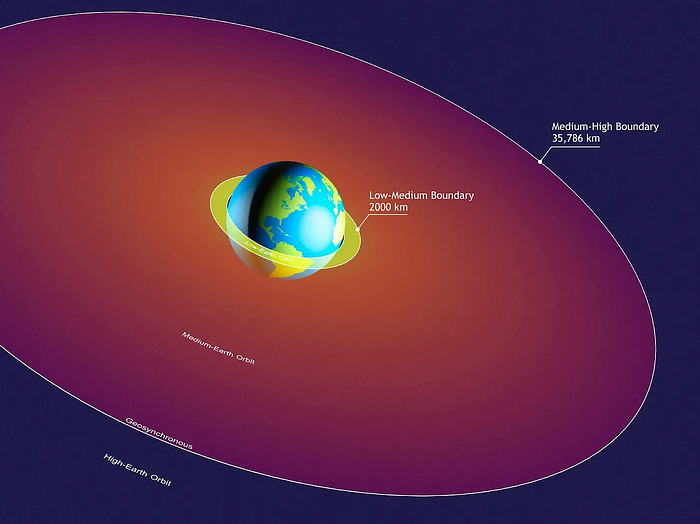
We mostly send items to LEO, the green area below:
SpaceX's reusable rockets can send these things to LEO. Each may launch dozens of payloads into space.
With all these launches, we're sending more than simply things to space. Volume and mass. Since the 1980s, launching a kilogram of payload to LEO has become cheaper:
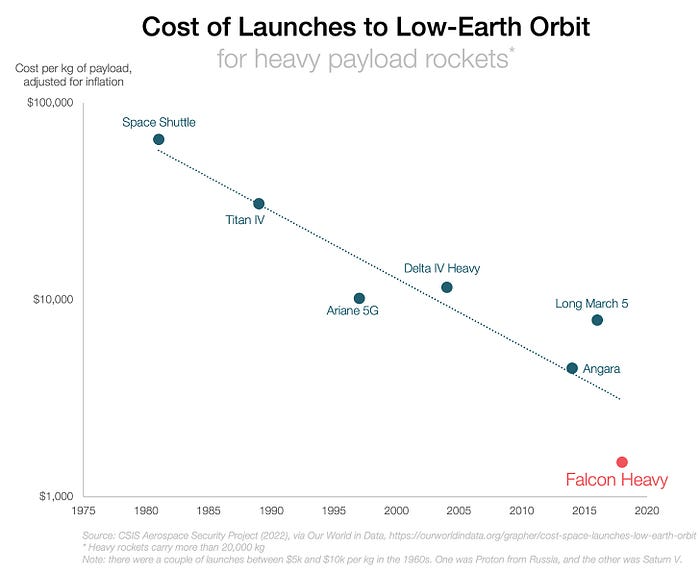
One kilogram in a large rocket cost over $75,000 in the 1980s. Carrying one astronaut cost nearly $5M! Falcon Heavy's $1,500/kg price is 50 times lower. SpaceX's larger, reusable rockets are amazing.
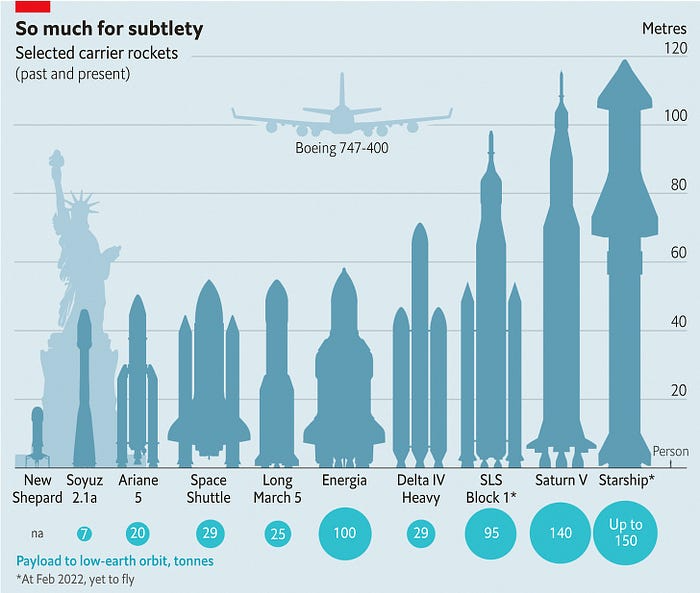
SpaceX's Starship rocket will continue. It can carry over 100 tons to LEO, 50% more than the current Falcon heavy. Thousands of launches per year. Elon Musk predicts Falcon Heavy's $1,500/kg cost will plummet to $100 in 23 years.
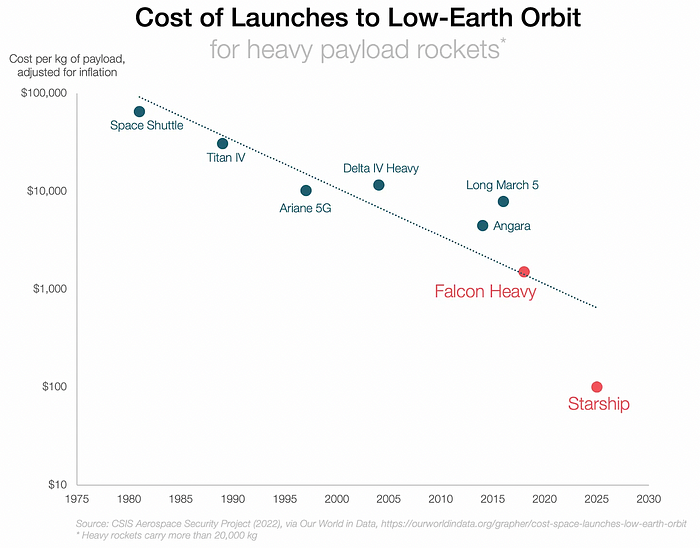
In context:
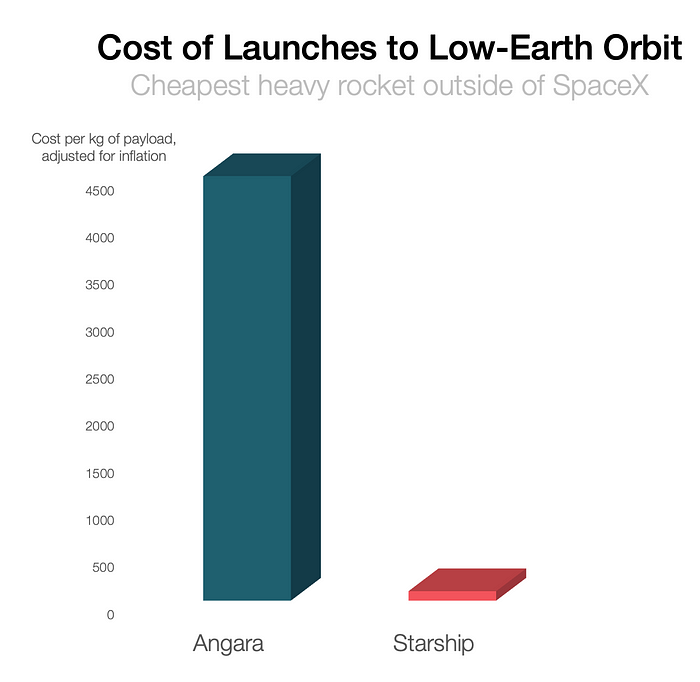
People underestimate this.
2. The Benefits of Affordable Transportation
Compare Earth's transportation costs:
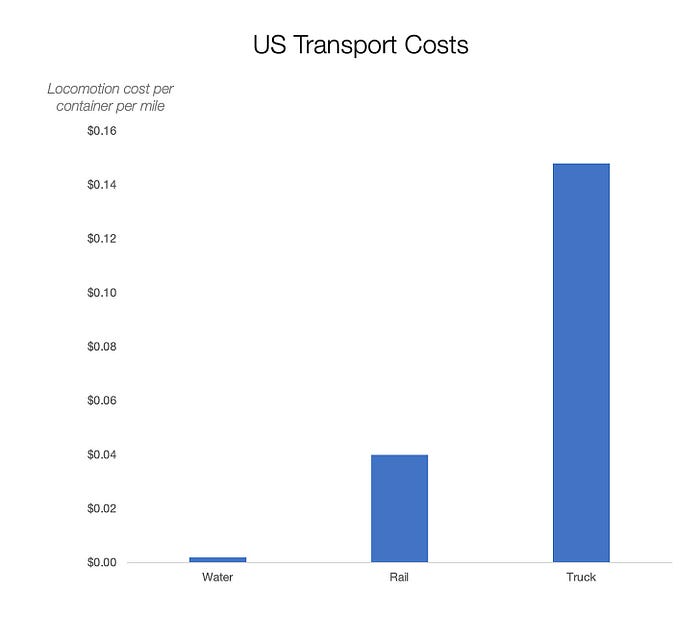
It's no surprise that the US and Northern Europe are the wealthiest and have the most navigable interior waterways.


So what? since sea transportation is cheaper than land. Inland waterways are even better than sea transportation since weather is less of an issue, currents can be controlled, and rivers serve two banks instead of one for coastal transportation.
In France, because population density follows river systems, rivers are valuable. Cheap transportation brought people and money to rivers, especially their confluences.

How come? Why were humans surrounding rivers?
Imagine selling meat for $10 per kilogram. Transporting one kg one kilometer costs $1. Your margin decreases $1 each kilometer. You can only ship 10 kilometers. For example, you can only trade with four cities:
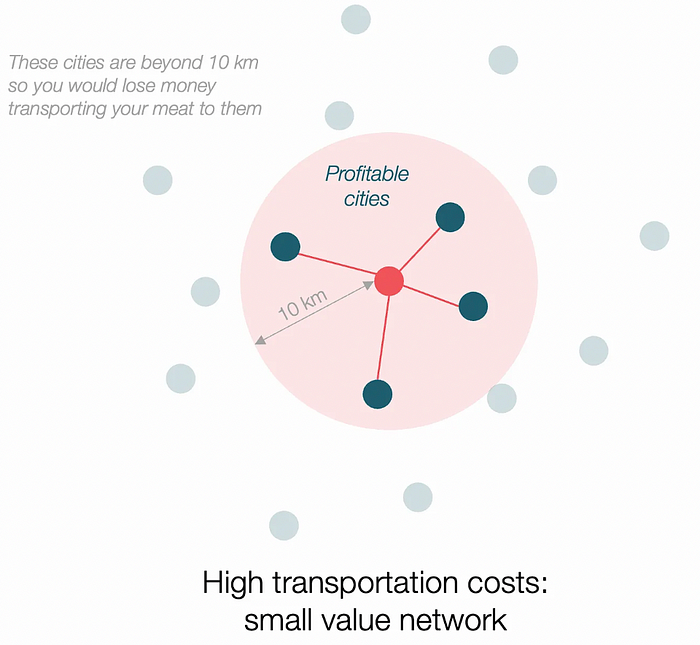
If instead, your cost of transportation is half, what happens? It costs you $0.5 per km. You now have higher margins with each city you traded with. More importantly, you can reach 20-km markets.
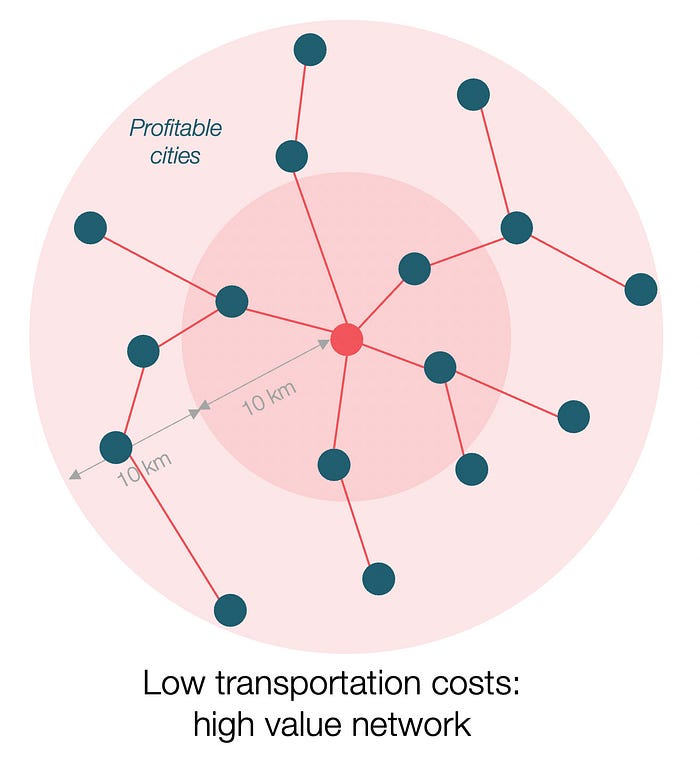
However, 2x distance 4x surface! You can now trade with sixteen cities instead of four! Metcalfe's law states that a network's value increases with its nodes squared. Since now sixteen cities can connect to yours. Each city now has sixteen connections! They get affluent and can afford more meat.
Rivers lower travel costs, connecting many cities, which can trade more, get wealthy, and buy more.
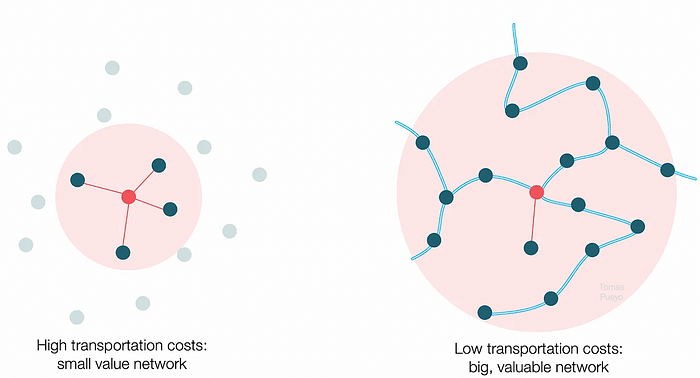
The right network is worth at least an order of magnitude more than the left! The cheaper the transport, the more trade at a lower cost, the more income generated, the more that wealth can be reinvested in better canals, bridges, and roads, and the wealth grows even more.
Throughout history. Rome was established around cheap Mediterranean transit and preoccupied with cutting overland transportation costs with their famous roadways. Communications restricted their empire.

The Egyptians lived around the Nile, the Vikings around the North Sea, early Japan around the Seto Inland Sea, and China started canals in the 5th century BC.
Transportation costs shaped empires.Starship is lowering new-world transit expenses. What's possible?
3. Change Organizations, Change Companies, Change the World
Starship is a conveyor belt to LEO. A new world of opportunity opens up as transportation prices drop 100x in a decade.
Satellite engineers have spent decades shedding milligrams. Weight influenced every decision: pricing structure, volumes to be sent, material selections, power sources, thermal protection, guiding, navigation, and control software. Weight was everything in the mission. To pack as much science into every millimeter, NASA missions had to be miniaturized. Engineers were indoctrinated against mass.
No way.
Starship is not constrained by any space mission, robotic or crewed.
Starship obliterates the mass constraint and every last vestige of cultural baggage it has gouged into the minds of spacecraft designers. A dollar spent on mass optimization no longer buys a dollar saved on launch cost. It buys nothing. It is time to raise the scope of our ambition and think much bigger. — Casey Handmer, Starship is still not understood
A Tesla Roadster in space makes more sense.
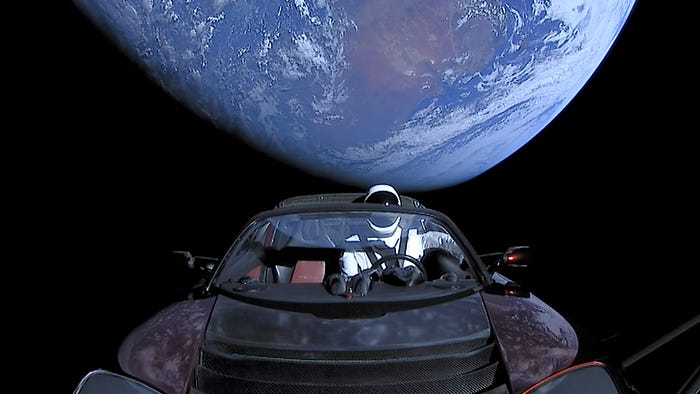
It went beyond bad PR. It told the industry: Did you care about every microgram? No more. My rockets are big enough to send a Tesla without noticing. Industry watchers should have noticed.
Most didn’t. Artemis is a global mission to send astronauts to the Moon and build a base. Artemis uses disposable Space Launch System rockets. Instead of sending two or three dinky 10-ton crew habitats over the next decade, Starship might deliver 100x as much cargo and create a base for 1,000 astronauts in a year or two. Why not? Because Artemis remains in a pre-Starship paradigm where each kilogram costs a million dollars and we must aggressively descope our objective.
Space agencies can deliver 100x more payload to space for the same budget with 100x lower costs and 100x higher transportation volumes. How can space economy saturate this new supply?
Before Starship, NASA supplied heavy equipment for Moon base construction. After Starship, Caterpillar and Deere may space-qualify their products with little alterations. Instead than waiting decades for NASA engineers to catch up, we could send people to build a space outpost with John Deere equipment in a few years.
History is littered with the wreckage of former industrial titans that underestimated the impact of new technology and overestimated their ability to adapt: Blockbuster, Motorola, Kodak, Nokia, RIM, Xerox, Yahoo, IBM, Atari, Sears, Hitachi, Polaroid, Toshiba, HP, Palm, Sony, PanAm, Sega, Netscape, Compaq, GM… — Casey Handmer, Starship is still not understood
Everyone saw it coming, but senior management failed to realize that adaption would involve moving beyond their established business practice. Others will if they don't.
4. The Starship Possibilities
It's Starlink.

SpaceX invented affordable cargo space and grasped its implications first. How can we use all this inexpensive cargo nobody knows how to use?
Satellite communications seemed like the best way to capitalize on it. They tried. Starlink, designed by SpaceX, provides fast, dependable Internet worldwide. Beaming information down is often cheaper than cable. Already profitable.
Starlink is one use for all this cheap cargo space. Many more. The longer firms ignore the opportunity, the more SpaceX will acquire.
What are these chances?
Satellite imagery is outdated and lacks detail. We can improve greatly. Synthetic aperture radar can take beautiful shots like this:

Have you ever used Google Maps and thought, "I want to see this in more detail"? What if I could view Earth live? What if we could livestream an infrared image of Earth?

We could launch hundreds of satellites with such mind-blowing visual precision of the Earth that we would dramatically improve the accuracy of our meteorological models; our agriculture; where crime is happening; where poachers are operating in the savannah; climate change; and who is moving military personnel where. Is that useful?
What if we could see Earth in real time? That affects businesses? That changes society?

Jon Brosio
3 years ago
This Landing Page is a (Legal) Money-Printing Machine
and it’s easy to build.
A landing page with good copy is a money-maker.
Let's be honest, page-builder templates are garbage.
They can help you create a nice-looking landing page, but not persuasive writing.
Over the previous 90 days, I've examined 200+ landing pages.
What's crazy?
Top digital entrepreneurs use a 7-part strategy to bring in email subscribers, generate prospects, and (passively) sell their digital courses.
Steal this 7-part landing page architecture to maximize digital product sales.
The offer
Landing pages require offers.
Newsletter, cohort, or course offer.
Your reader should see this offer first. Includind:
Headline
Imagery
Call-to-action
Clear, persuasive, and simplicity are key. Example: the Linkedin OS course home page of digital entrepreneur Justin Welsh offers:
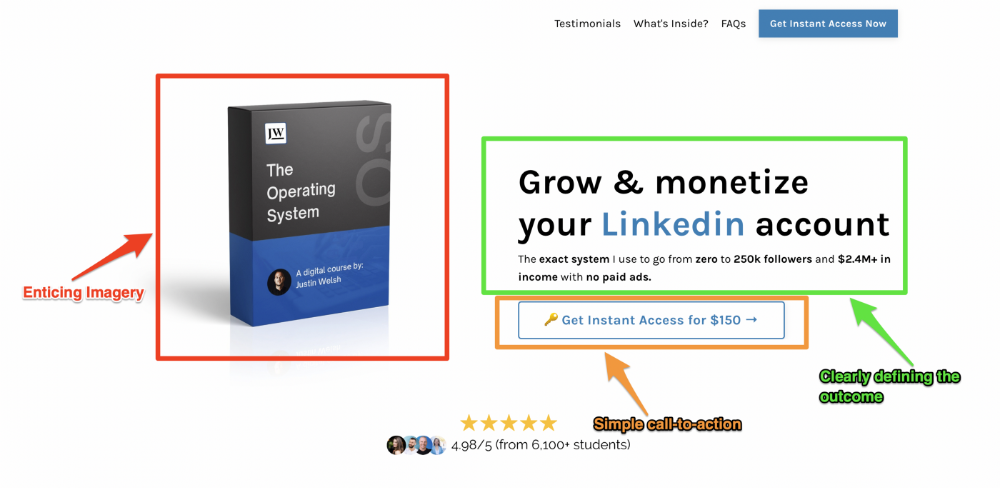
A distinctly defined problem
Everyone needs an enemy.
You need an opponent on your landing page. Problematic.
Next, employ psychology to create a struggle in your visitor's thoughts.
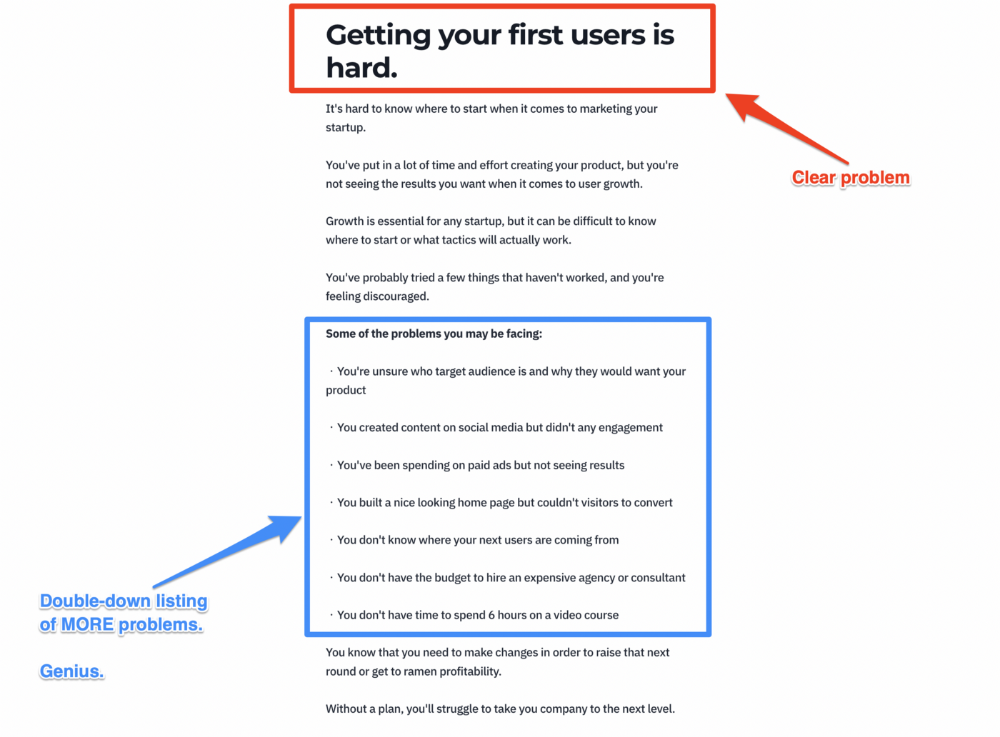
Don't be clever here; label your customer's problem. The more particular you are, the bigger the situation will seem.
When you build a clear monster, you invite defeat. I appreciate Theo Ohene's Growth Roadmaps landing page.
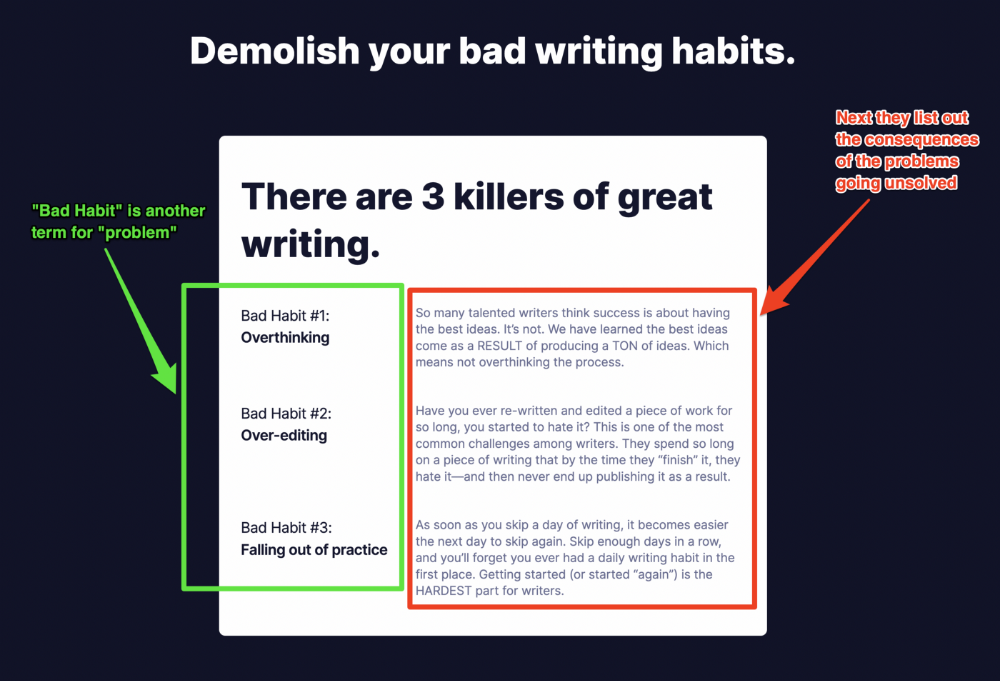
Exacerbation of the effects
Problem identification doesn't motivate action.
What would an unresolved problem mean?
This is landing page copy. When you describe the unsolved problem's repercussions, you accomplish several things:
You write a narrative (and stories are remembered better than stats)
You cause the reader to feel something.
You help the reader relate to the issue
Important!
My favorite script is:
"Sure, you can let [problem] go untreated. But what will happen if you do? Soon, you'll begin to notice [new problem 1] will start to arise. That might bring up [problem 2], etc."
Take the copywriting course, digital writer and entrepreneur Dickie Bush illustrates below when he labels the problem (see: "poor habit") and then illustrates the repercussions.
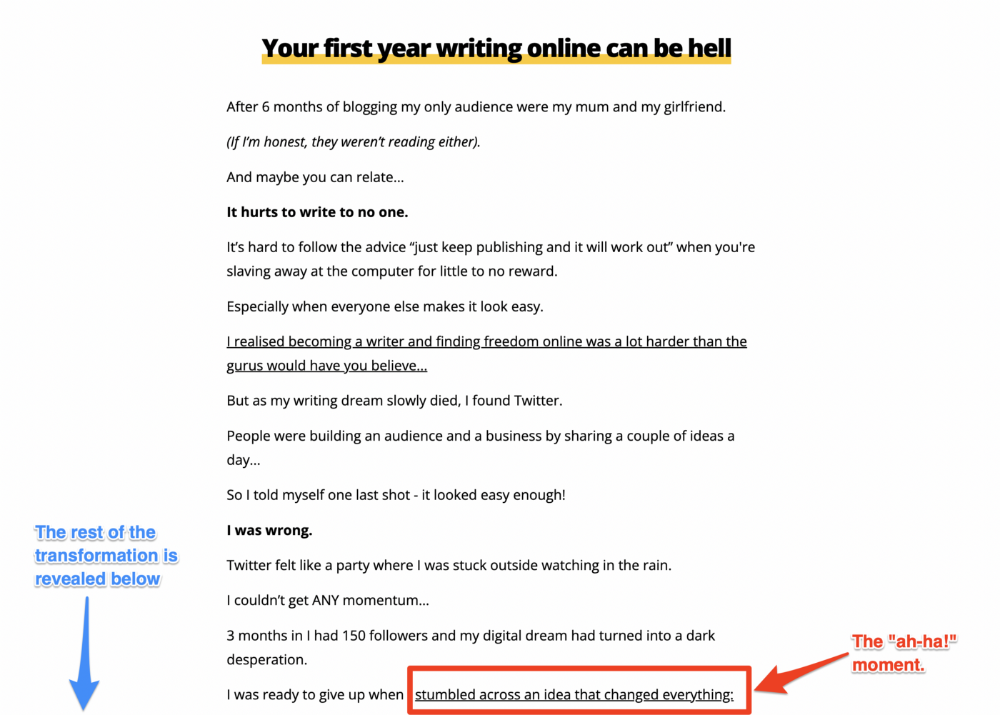
The tale of transformation
Every landing page needs that "ah-ha!" moment.
Transformation stories do this.
Did you find a solution? Someone else made the discovery? Have you tested your theory?
Next, describe your (or your subject's) metamorphosis.
Kieran Drew nails his narrative (and revelation) here. Right before the disclosure, he introduces his "ah-ha!" moment:
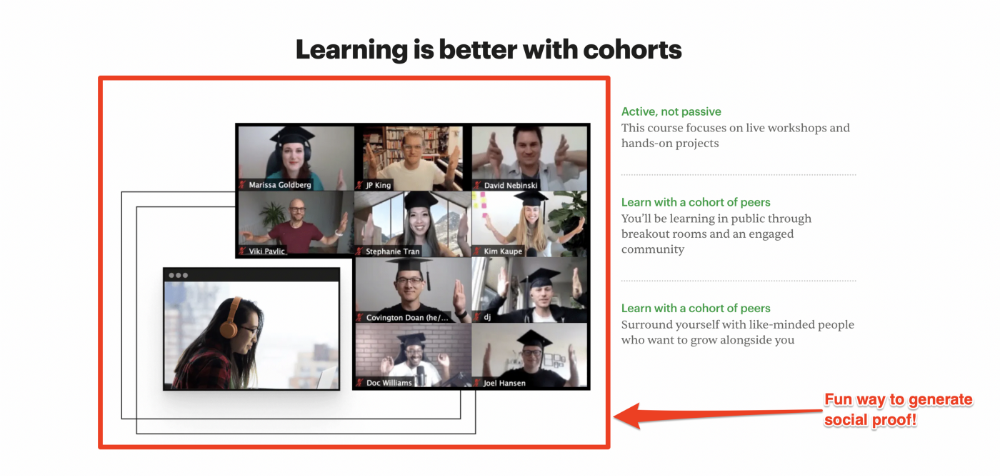
Testimonials
Social proof completes any landing page.
Social proof tells the reader, "If others do it, it must be worthwhile."
This is your argument.
Positive social proof helps (obviously).
Offer "free" training in exchange for a testimonial if you need social evidence. This builds social proof.
Most social proof is testimonies (recommended). Kurtis Hanni's creative take on social proof (using a screenshot of his colleague) is entertaining.
Bravo.
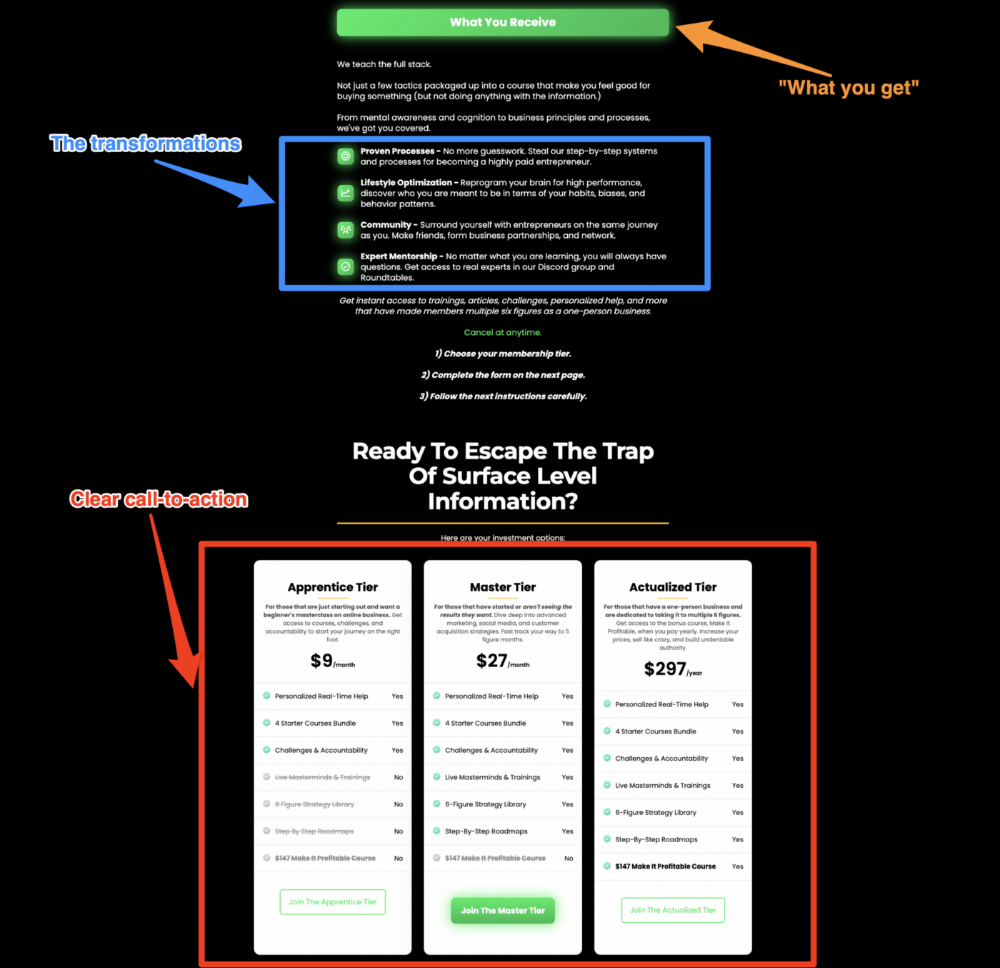
Reveal your offer
Now's the moment to act.
Describe the "bundle" that provides the transformation.
Here's:
Course
Cohort
Ebook
Whatever you're selling.
Include a product or service image, what the consumer is getting ("how it works"), the price, any "free" bonuses (preferred), and a CTA ("buy now").
Clarity is key. Don't make a cunning offer. Make sure your presentation emphasizes customer change (benefits). Dan Koe's Modern Mastery landing page makes an offer. Consider:
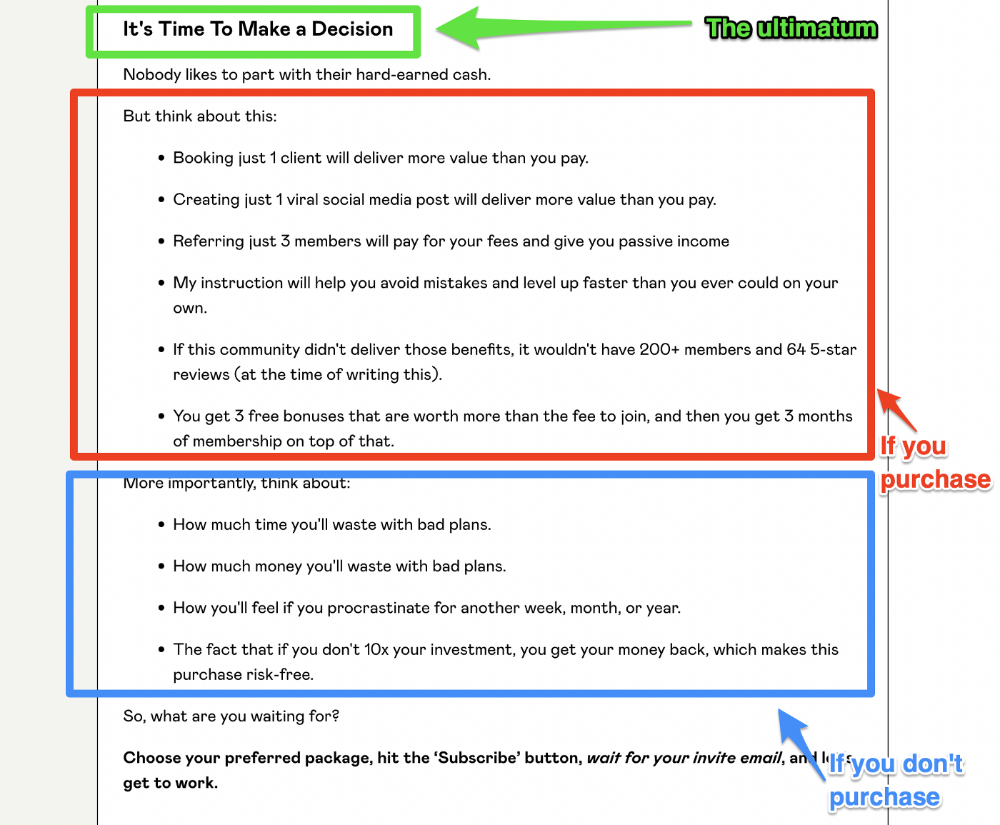
An ultimatum
Offering isn't enough.
You must give your prospect an ultimatum.
They can buy your merchandise from you.
They may exit the webpage.
That’s it.
It's crucial to show what happens if the reader does either. Stress the consequences of not buying (again, a little consequence amplification). Remind them of the benefits of buying.
I appreciate Charles Miller's product offer ending:
The top online creators use a 7-part landing page structure:
Offer the service
Describe the problem
Amplify the consequences
Tell the transformational story
Include testimonials and social proof.
Reveal the offer (with any bonuses if applicable)
Finally, give the reader a deadline to encourage them to take action.
Sequence these sections to develop a landing page that (essentially) prints money.

Nitin Sharma
3 years ago
Quietly Create a side business that will revolutionize everything in a year.
Quitting your job for a side gig isn't smart.

A few years ago, I would have laughed at the idea of starting a side business.
I never thought a side gig could earn more than my 9-to-5. My side gig pays more than my main job now.
You may then tell me to leave your job. But I don't want to gamble, and my side gig is important. Programming and web development help me write better because of my job.
Yes, I share work-related knowledge. Web development, web3, programming, money, investment, and side hustles are key.
Let me now show you how to make one.
Create a side business based on your profession or your interests.
I'd be direct.
Most people don't know where to start or which side business to pursue.
You can make money by taking online surveys, starting a YouTube channel, or playing web3 games, according to several blogs.
You won't make enough money and will waste time.
Nitin directs our efforts. My friend, you've worked and have talent. Profit from your talent.
Example:
College taught me web development. I soon created websites, freelanced, and made money. First year was hardest for me financially and personally.
As I worked, I became more skilled. Soon after, I got more work, wrote about web development on Medium, and started selling products.
I've built multiple income streams from web development. It wasn't easy. Web development skills got me a 9-to-5 job.
Focus on a specific skill and earn money in many ways. Most people start with something they hate or are bad at; the rest is predictable.
Result? They give up, frustrated.
Quietly focus for a year.
I started my side business in college and never told anyone. My parents didn't know what I did for fun.
The only motivation is time constraints. So I focused.
As I've said, I focused on my strengths (learned skills) and made money. Yes, I was among Medium's top 500 authors in a year and got a bonus.
How did I succeed? Since I know success takes time, I never imagined making enough money in a month. I spent a year concentrating.
I became wealthy. Now that I have multiple income sources, some businesses pay me based on my skill.
I recommend learning skills and working quietly for a year. You can do anything with this.
The hardest part will always be the beginning.
When someone says you can make more money working four hours a week. Leave that, it's bad advice.
If someone recommends a paid course to help you succeed, think twice.
The beginning is always the hardest.
I made many mistakes learning web development. When I started my technical content side gig, it was tough. I made mistakes and changed how I create content, which helped.
And it’s applicable everywhere.
Don't worry if you face problems at first. Time and effort heal all wounds.
Quitting your job to work a side job is not a good idea.
Some honest opinions.
Most online gurus encourage side businesses. It takes time to start and grow a side business.
Suppose you quit and started a side business.
After six months, what happens? Your side business won't provide enough money to survive.
Indeed. Later, you'll become demotivated and tense and look for work.
Instead, work 9-5, and start a side business. You decide. Stop watching Netflix and focus on your side business.
I know you're busy, but do it.
Next? It'll succeed or fail in six months. You can continue your side gig for another six months because you have a job and have tried it.
You'll probably make money, but you may need to change your side gig.
That’s it.
You've created a new revenue stream.
Remember.
Starting a side business, a company, or finding work is difficult. There's no free money in a competitive world. You'll only succeed with skill.
Read it again.
Focusing silently for a year can help you succeed.
I studied web development and wrote about it. First year was tough. I went viral, hit the top 500, and other firms asked me to write for them. So, my life changed.
Yours can too. One year of silence is required.
Enjoy!