


Terra fiasco raises TRON's stablecoin backstop
After Terra's algorithmic stablecoin collapsed in May, TRON announced a plan to increase the capital backing its own stablecoin.
USDD, a near-carbon copy of Terra's UST, arrived on the TRON blockchain on May 5. TRON founder Justin Sun says USDD will be overcollateralized after initially being pegged algorithmically to the US dollar.
A reserve of cryptocurrencies and stablecoins will be kept at 130 percent of total USDD issuance, he said. TRON described the collateral ratio as "guaranteed" and said it would begin publishing real-time updates on June 5.
Currently, the reserve contains 14,040 bitcoin (around $418 million), 140 million USDT, 1.9 billion TRX, and 8.29 billion TRX in a burning contract.
Sun: "We want to hybridize USDD." We have an algorithmic stablecoin and TRON DAO Reserve.
algorithmic failure
USDD was designed to incentivize arbitrageurs to keep its price pegged to the US dollar by trading TRX, TRON's token, and USDD. Like Terra, TRON signaled its intent to establish a bitcoin and cryptocurrency reserve to support USDD in extreme market conditions.
Still, Terra's UST failed despite these safeguards. The stablecoin veered sharply away from its dollar peg in mid-May, bringing down Terra's LUNA and wiping out $40 billion in value in days. In a frantic attempt to restore the peg, billions of dollars in bitcoin were sold and unprecedented volumes of LUNA were issued.
Sun believes USDD, which has a total circulating supply of $667 million, can be backed up.
"Our reserve backing is diversified." Bitcoin and stablecoins are included. USDC will be a small part of Circle's reserve, he said.
TRON's news release lists the reserve's assets as bitcoin, TRX, USDC, USDT, TUSD, and USDJ.
All Bitcoin addresses will be signed so everyone knows they belong to us, Sun said.
Not giving in
Sun told that the crypto industry needs "decentralized" stablecoins that regulators can't touch.
Sun said the Luna Foundation Guard, a Singapore-based non-profit that raised billions in cryptocurrency to buttress UST, mismanaged the situation by trying to sell to panicked investors.
He said, "We must be ahead of the market." We want to stabilize the market and reduce volatility.
Currently, TRON finances most of its reserve directly, but Sun says the company hopes to add external capital soon.
Before its demise, UST holders could park the stablecoin in Terra's lending platform Anchor Protocol to earn 20% interest, which many deemed unsustainable. TRON's JustLend is similar. Sun hopes to raise annual interest rates from 17.67% to "around 30%."
This post is a summary. Read full article here
More on Web3 & Crypto

Alex Bentley
3 years ago
Why Bill Gates thinks Bitcoin, crypto, and NFTs are foolish
Microsoft co-founder Bill Gates assesses digital assets while the bull is caged.

Bill Gates is well-respected.
Reasonably. He co-founded and led Microsoft during its 1980s and 1990s revolution.
After leaving Microsoft, Bill Gates pursued other interests. He and his wife founded one of the world's largest philanthropic organizations, Bill & Melinda Gates Foundation. He also supports immunizations, population control, and other global health programs.
When Gates criticized Bitcoin, cryptocurrencies, and NFTs, it made news.
Bill Gates said at the 58th Munich Security Conference...
“You have an asset class that’s 100% based on some sort of greater fool theory that somebody’s going to pay more for it than I do.”
Gates means digital assets. Like many bitcoin critics, he says digital coins and tokens are speculative.
And he's not alone. Financial experts have dubbed Bitcoin and other digital assets a "bubble" for a decade.
Gates also made fun of Bored Ape Yacht Club and NFTs, saying, "Obviously pricey digital photographs of monkeys will help the world."
Why does Bill Gates dislike digital assets?
According to Gates' latest comments, Bitcoin, cryptos, and NFTs aren't good ways to hold value.
Bill Gates is a better investor than Elon Musk.
“I’m used to asset classes, like a farm where they have output, or like a company where they make products,” Gates said.
The Guardian claimed in April 2021 that Bill and Melinda Gates owned the most U.S. farms. Over 242,000 acres of farmland.
The Gates couple has enough farmland to cover Hong Kong.

Bill Gates is a classic investor. He wants companies with an excellent track record, strong fundamentals, and good management. Or tangible assets like land and property.
Gates prefers the "old economy" over the "new economy"
Gates' criticism of Bitcoin and cryptocurrency ventures isn't surprising. These digital assets lack all of Gates's investing criteria.
Volatile digital assets include Bitcoin. Their costs might change dramatically in a day. Volatility scares risk-averse investors like Gates.
Gates has a stake in the old financial system. As Microsoft's co-founder, Gates helped develop a dominant tech company.
Because of his business, he's one of the world's richest men.
Bill Gates is invested in protecting the current paradigm.
He won't invest in anything that could destroy the global economy.
When Gates criticizes Bitcoin, cryptocurrencies, and NFTs, he's suggesting they're a hoax. These soapbox speeches are one way he protects his interests.
Digital assets aren't a bad investment, though. Many think they're the future.
Changpeng Zhao and Brian Armstrong are two digital asset billionaires. Two crypto exchange CEOs. Binance/Coinbase.
Digital asset revolution won't end soon.
If you disagree with Bill Gates and plan to invest in Bitcoin, cryptocurrencies, or NFTs, do your own research and understand the risks.
But don’t take Bill Gates’ word for it.
He’s just an old rich guy with a lot of farmland.
He has a lot to lose if Bitcoin and other digital assets gain global popularity.
This post is a summary. Read the full article here.

Ren & Heinrich
3 years ago
200 DeFi Projects were examined. Here is what I learned.
I analyze the top 200 DeFi crypto projects in this article.
This isn't a study. The findings benefit crypto investors.
Let’s go!
A set of data
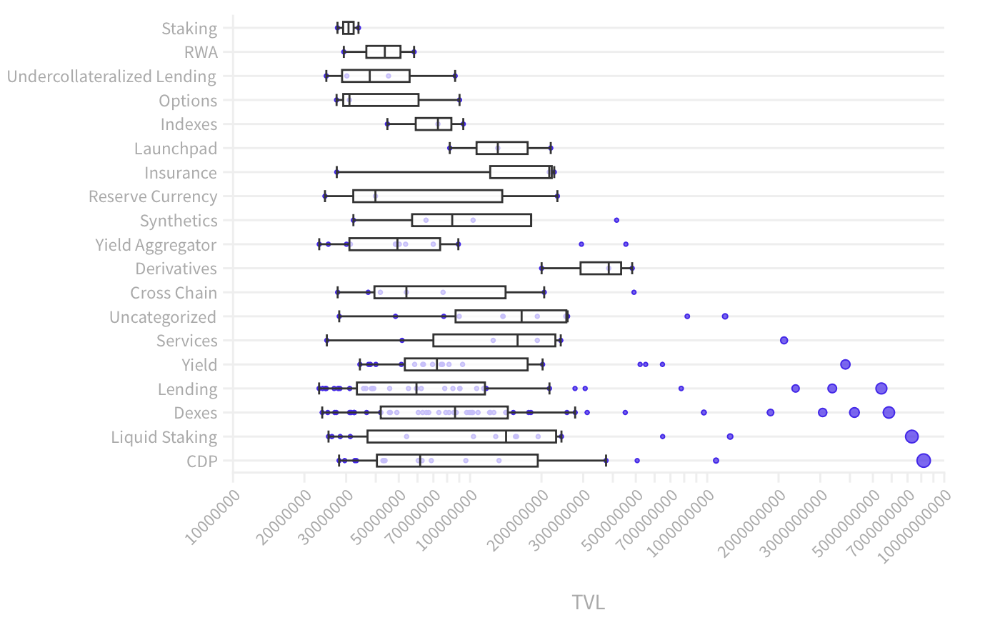
I analyzed data from defillama.com. In my analysis, I used the top 200 DeFis by TVL in October 2022.
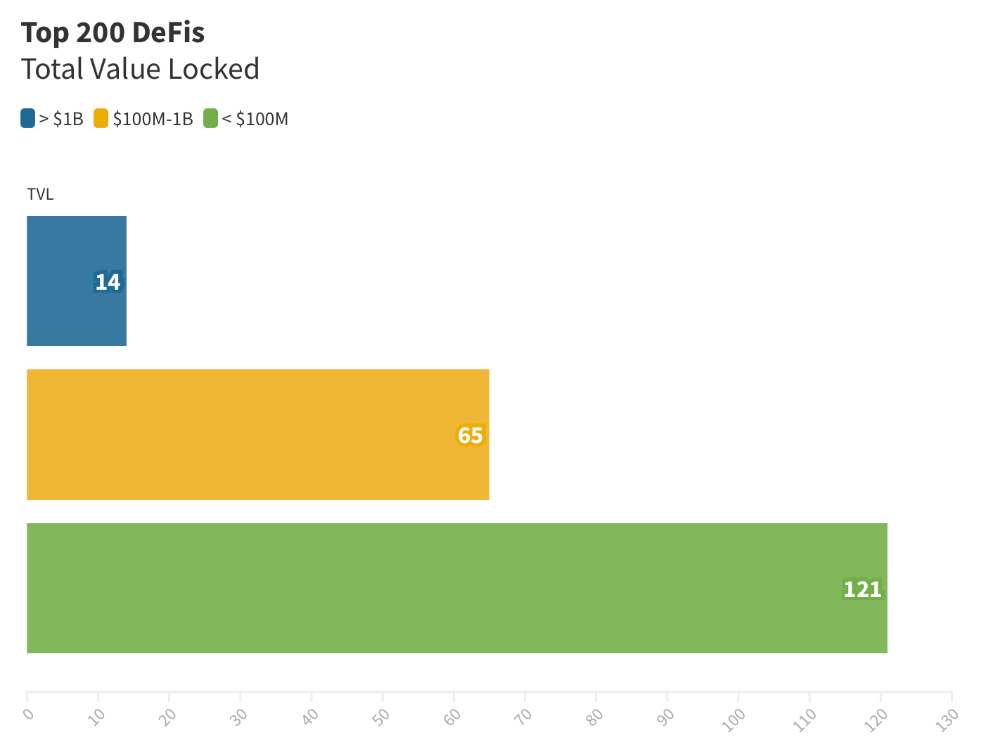
Total Locked Value
The chart below shows platform-specific locked value.
14 platforms had $1B+ TVL. 65 platforms have $100M-$1B TVL. The remaining 121 platforms had TVLs below $100 million, with the lowest being $23 million.
TVLs are distributed Pareto. Top 40% of DeFis account for 80% of TVLs.
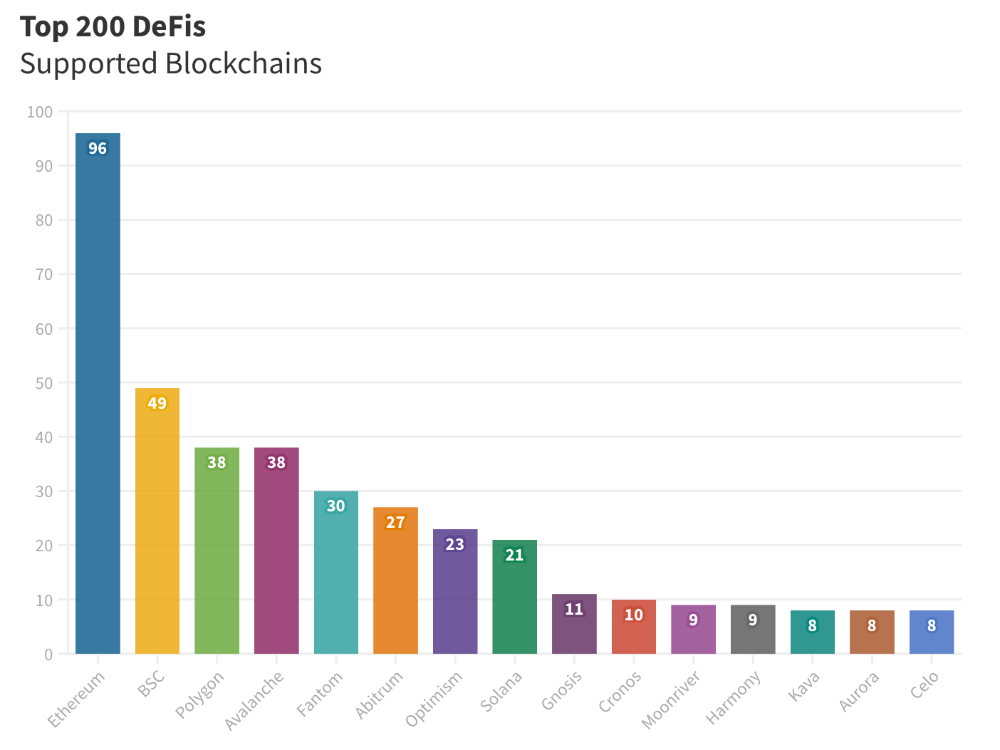
Compliant Blockchains
Ethereum's blockchain leads DeFi. 96 of the examined projects offer services on Ethereum. Behind BSC, Polygon, and Avalanche.
Five platforms used 10+ blockchains. 36 between 2-10 159 used 1 blockchain.
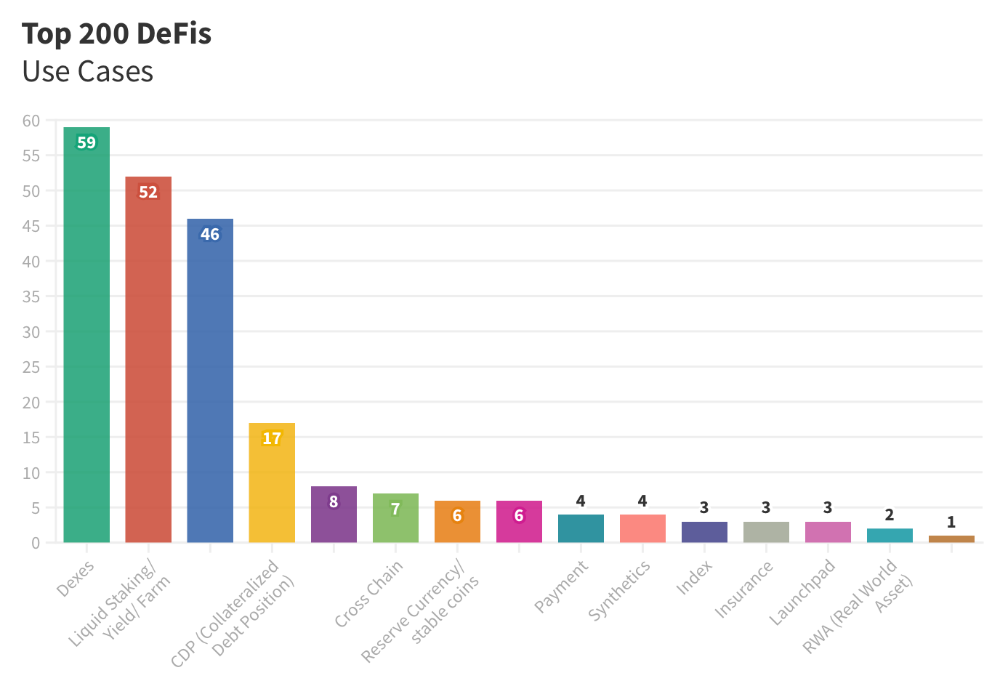
Use Cases for DeFi
The chart below shows platform use cases. Each platform has decentralized exchanges, liquid staking, yield farming, and lending.
These use cases are DefiLlama's main platform features.
Which use case costs the most? Chart explains. Collateralized debt, liquid staking, dexes, and lending have high TVLs.
The DeFi Industry
I compared three high-TVL platforms (Maker DAO, Balancer, AAVE). The columns show monthly TVL and token price changes. The graph shows monthly Bitcoin price changes.
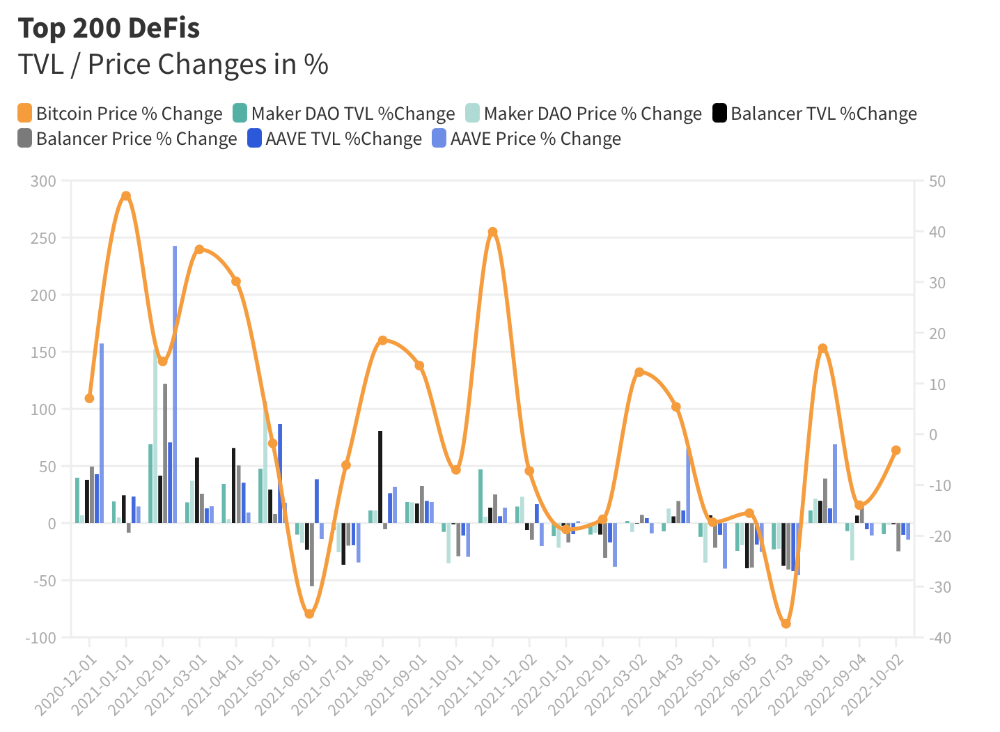
Each platform's market moves similarly.
Probably because most DeFi deposits are cryptocurrencies. Since individual currencies are highly correlated with Bitcoin, it's not surprising that they move in unison.
Takeaways
This analysis shows that the most common DeFi services (decentralized exchanges, liquid staking, yield farming, and lending) also have the highest average locked value.
Some projects run on one or two blockchains, while others use 15 or 20. Our analysis shows that a project's blockchain count has no correlation with its success.
It's hard to tell if certain use cases are rising. Bitcoin's price heavily affects the entire DeFi market.
TVL seems to be a good indicator of a DeFi platform's success and quality. Higher TVL platforms are cheaper. They're a better long-term investment because they gain or lose less value than DeFis with lower TVLs.

OnChain Wizard
3 years ago
How to make a >800 million dollars in crypto attacking the once 3rd largest stablecoin, Soros style
Everyone is talking about the $UST attack right now, including Janet Yellen. But no one is talking about how much money the attacker made (or how brilliant it was). Lets dig in.
Our story starts in late March, when the Luna Foundation Guard (or LFG) starts buying BTC to help back $UST. LFG started accumulating BTC on 3/22, and by March 26th had a $1bn+ BTC position. This is leg #1 that made this trade (or attack) brilliant.
The second leg comes in the form of the 4pool Frax announcement for $UST on April 1st. This added the second leg needed to help execute the strategy in a capital efficient way (liquidity will be lower and then the attack is on).
We don't know when the attacker borrowed 100k BTC to start the position, other than that it was sold into Kwon's buying (still speculation). LFG bought 15k BTC between March 27th and April 11th, so lets just take the average price between these dates ($42k).
So you have a ~$4.2bn short position built. Over the same time, the attacker builds a $1bn OTC position in $UST. The stage is now set to create a run on the bank and get paid on your BTC short. In anticipation of the 4pool, LFG initially removes $150mm from 3pool liquidity.
The liquidity was pulled on 5/8 and then the attacker uses $350mm of UST to drain curve liquidity (and LFG pulls another $100mm of liquidity).
But this only starts the de-pegging (down to 0.972 at the lows). LFG begins selling $BTC to defend the peg, causing downward pressure on BTC while the run on $UST was just getting started.
With the Curve liquidity drained, the attacker used the remainder of their $1b OTC $UST position ($650mm or so) to start offloading on Binance. As withdrawals from Anchor turned from concern into panic, this caused a real de-peg as people fled for the exits
So LFG is selling $BTC to restore the peg while the attacker is selling $UST on Binance. Eventually the chain gets congested and the CEXs suspend withdrawals of $UST, fueling the bank run panic. $UST de-pegs to 60c at the bottom, while $BTC bleeds out.
The crypto community panics as they wonder how much $BTC will be sold to keep the peg. There are liquidations across the board and LUNA pukes because of its redemption mechanism (the attacker very well could have shorted LUNA as well). BTC fell 25% from $42k on 4/11 to $31.3k
So how much did our attacker make? There aren't details on where they covered obviously, but if they are able to cover (or buy back) the entire position at ~$32k, that means they made $952mm on the short.
On the $350mm of $UST curve dumps I don't think they took much of a loss, lets assume 3% or just $11m. And lets assume that all the Binance dumps were done at 80c, thats another $125mm cost of doing business. For a grand total profit of $815mm (bf borrow cost).
BTC was the perfect playground for the trade, as the liquidity was there to pull it off. While having LFG involved in BTC, and foreseeing they would sell to keep the peg (and prevent LUNA from dying) was the kicker.
Lastly, the liquidity being low on 3pool in advance of 4pool allowed the attacker to drain it with only $350mm, causing the broader panic in both BTC and $UST. Any shorts on LUNA would've added a lot of P&L here as well, with it falling -65% since 5/7.
And for the reply guys, yes I know a lot of this involves some speculation & assumptions. But a lot of money was made here either way, and I thought it would be cool to dive into how they did it.
You might also like

Hudson Rennie
3 years ago
Meet the $5 million monthly controversy-selling King of Toxic Masculinity.
Trigger warning — Andrew Tate is running a genius marketing campaign
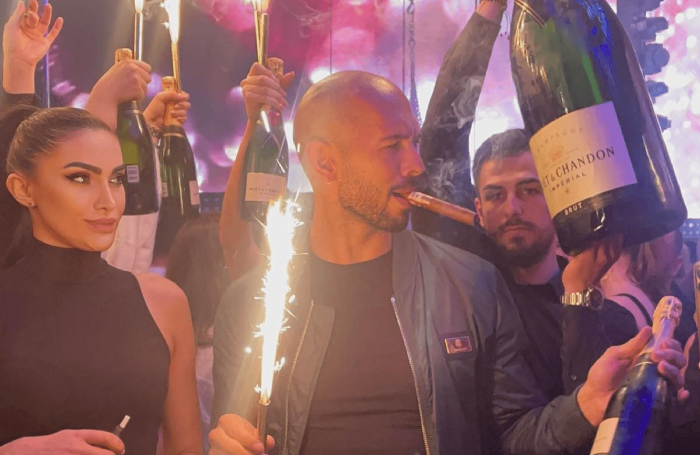
Andrew Tate is a 2022 internet celebrity.
Kickboxing world champion became rich playboy with controversial views on gender roles.
Andrew's get-rich-quick scheme isn't new. His social media popularity is impressive.
He’s currently running one of the most genius marketing campaigns in history.
He pulls society's pendulum away from diversity and inclusion and toward diversion and exclusion. He's unstoppable.
Here’s everything you need to know about Andrew Tate. And how he’s playing chess while the world plays checkers.
Cobra Tate is the name he goes by.
American-born, English-raised entrepreneur Andrew Tate lives in Romania.
Romania? Says Andrew,
“I prefer a country in which corruption is available to everyone.”
Andrew was a professional kickboxer with the ring moniker Cobra before starting Hustlers University.
Before that, he liked chess and worshipped his father.
Emory Andrew Tate III is named after his grandmaster chess player father.
Emory was the first black-American chess champion. He was military, martial arts-trained, and multilingual. A superhuman.
He lived in his car to make ends meet.
Andrew and Tristan relocated to England with their mother when their parents split.
It was there that Andrew began his climb toward becoming one of the internet’s greatest villains.
Andrew fell in love with kickboxing.
Andrew spent his 20s as a professional kickboxer and reality TV star, featuring on Big Brother UK and The Ultimate Traveller.
These 3 incidents, along with a chip on his shoulder, foreshadowed Andrews' social media breakthrough.
Chess
Combat sports
Reality television
A dangerous trio.
Andrew started making money online after quitting kickboxing in 2017 due to an eye issue.
Andrew didn't suddenly become popular.
Andrew's web work started going viral in 2022.
Due to his contentious views on patriarchy and gender norms, he's labeled the King of Toxic Masculinity. His most contentious views (trigger warning):
“Women are intrinsically lazy.”
“Female promiscuity is disgusting.”
“Women shouldn’t drive cars or fly planes.”
“A lot of the world’s problems would be solved if women had their body count tattooed on their foreheads.”
Andrew's two main beliefs are:
“These are my personal opinions based on my experiences.”
2. “I believe men are better at some things and women are better at some things. We are not equal.”
Andrew intentionally offends.
Andrew's thoughts began circulating online in 2022.
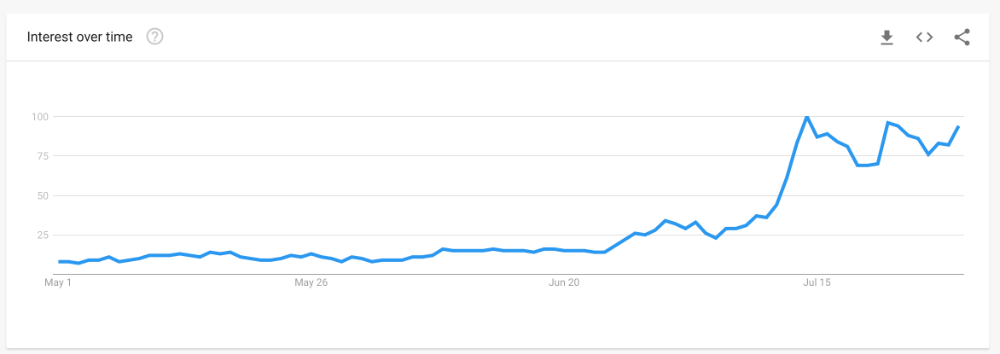
In July 2022, he was one of the most Googled humans, surpassing:
Joe Biden
Donald Trump
Kim Kardashian
Andrews' rise is a mystery since no one can censure or suppress him. This is largely because Andrew nor his team post his clips.
But more on that later.
Andrew's path to wealth.
Andrew Tate is a self-made millionaire. His morality is uncertain.
Andrew and Tristan needed money soon after retiring from kickboxing.
“I owed some money to some dangerous people. I had $70K and needed $100K to stay alive.”
Andrews lost $20K on roulette at a local casino.
Andrew had one week to make $50,000, so he started planning. Andrew locked himself in a chamber like Thomas Edison to solve an energy dilemma.
He listed his assets.
Physical strength (but couldn’t fight)
a BMW (worth around $20K)
Intelligence (but no outlet)
A lightbulb.
He had an epiphany after viewing a webcam ad. He sought aid from women, ironically. His 5 international girlfriends are assets.
Then, a lightbulb.
Andrew and Tristan messaged and flew 7 women to a posh restaurant. Selling desperation masked as opportunity, Andrew pitched his master plan:
A webcam business — with a 50/50 revenue split.
5 women left.
2 stayed.
Andrew Tate, a broke kickboxer, became Top G, Cobra Tate.
The business model was simple — yet sad.
Andrew's girlfriends moved in with him and spoke online for 15+ hours a day. Andrew handled ads and equipment as the women posed.
Andrew eventually took over their keyboards, believing he knew what men wanted more than women.
Andrew detailed on the Full Send Podcast how he emotionally manipulated men for millions. They sold houses, automobiles, and life savings to fuel their companionship addiction.
When asked if he felt bad, Andrew said,
“F*ck no.“
Andrew and Tristan wiped off debts, hired workers, and diversified.
Tristan supervised OnlyFans models.
Andrew bought Romanian casinos and MMA league RXF (Real Xtreme Fighting).
Pandemic struck suddenly.
Andrew couldn't run his 2 businesses without a plan. Another easy moneymaker.
He banked on Hustlers University.
The actual cause of Andrew's ubiquity.
On a Your Mom’s House episode Andrew's 4 main revenue sources:
Hustler’s University
2. Owning casinos in Romania
3. Owning 10% of the Romanian MMA league “RXF”
4. “The War Room” — a society of rich and powerful men
When the pandemic hit, 3/4 became inoperable.
So he expanded Hustlers University.
But what is Hustler’s University?
Andrew says Hustlers University teaches 18 wealth-building tactics online. Examples:
Real estate
Copywriting
Amazon FBA
Dropshipping
Flipping Cryptos
How to swiftly become wealthy.
Lessons are imprecise, rudimentary, and macro-focused, say reviews. Invest wisely, etc. Everything is free online.
You pay for community. One unique income stream.
The only money-making mechanism that keeps the course from being a scam.
The truth is, many of Andrew’s students are actually making money. Maybe not from the free YouTube knowledge Andrew and his professors teach in the course, but through Hustler’s University’s affiliate program.
Affiliates earn 10% commission for each new student = $5.
Students can earn $10 for each new referral in the first two months.
Andrew earns $50 per membership per month.
This affiliate program isn’t anything special — in fact, it’s on the lower end of affiliate payouts. Normally, it wouldn’t be very lucrative.
But it has one secret weapon— Andrew and his viral opinions.
Andrew is viral. Andrew went on a media tour in January 2022 after appearing on Your Mom's House.
And many, many more…
He chatted with Twitch streamers. Hustlers University wanted more controversy (and clips).
Here’s the strategy behind Hustler’s University that has (allegedly) earned students upwards of $10K per month:
Make a social media profile with Andrew Tates' name and photo.
Post any of the online videos of Andrews that have gone viral.
Include a referral link in your bio.
Effectively simple.
Andrew's controversy attracts additional students. More student clips circulate as more join. Andrew's students earn more and promote the product as he goes viral.
A brilliant plan that's functioning.
At the beginning of his media tour, Hustler’s University had 5,000 students. 6 months in, and he now has over 100,000.
One income stream generates $5 million every month.
Andrew's approach is not new.
But it is different.
In the early 2010s, Tai Lopez dominated the internet.
His viral video showed his house.
“Here in my garage. Just bought this new Lamborghini.”
Tais' marketing focused on intellect, not strength, power, and wealth to attract women.
How reading quicker leads to financial freedom in 67 steps.
Years later, it was revealed that Tai Lopez rented the mansion and Lamborghini as a marketing ploy to build social proof. Meanwhile, he was living in his friend’s trailer.
Faked success is an old tactic.
Andrew is doing something similar. But with one major distinction.
Andrew outsources his virality — making him nearly impossible to cancel.
In 2022, authorities searched Andrews' estate over human trafficking suspicions. Investigation continues despite withdrawn charges.
Andrew's divisive nature would normally get him fired. Andrew's enterprises and celebrity don't rely on social media.
He doesn't promote or pay for ads. Instead, he encourages his students and anyone wishing to get rich quick to advertise his work.
Because everything goes through his affiliate program. Old saying:
“All publicity is good publicity.”
Final thoughts: it’s ok to feel triggered.
Tate is divisive.
His emotionally charged words are human nature. Andrews created the controversy.
It's non-personal.
His opinions are those of one person. Not world nor generational opinion.
Briefly:
It's easy to understand why Andrews' face is ubiquitous. Money.
The world wide web is a chessboard. Misdirection is part of it.
It’s not personal, it’s business.
Controversy sells
Sometimes understanding the ‘why’, can help you deal with the ‘what.’
Isaiah McCall
3 years ago
There is a new global currency emerging, but it is not bitcoin.
America should avoid BRICS

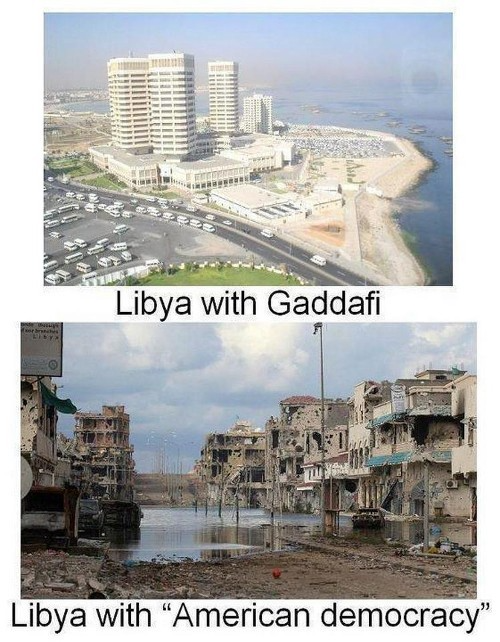
Vladimir Putin has watched videos of Muammar Gaddafi's CIA-backed demise.
Gaddafi...
Thief.
Did you know Gaddafi wanted a gold-backed dinar for Africa? Because he considered our global financial system was a Ponzi scheme, he wanted to discontinue trading oil in US dollars.
Or, Gaddafi's Libya enjoyed Africa's highest quality of living before becoming freed. Pictured:
Vladimir Putin is a nasty guy, but he had his reasons for not mentioning NATO assisting Ukraine in resisting US imperialism. Nobody tells you. Sure.
The US dollar's corruption post-2008, debasement by quantitative easing, and lack of value are key factors. BRICS will replace the dollar.
BRICS aren't bricks.
Economy-related.
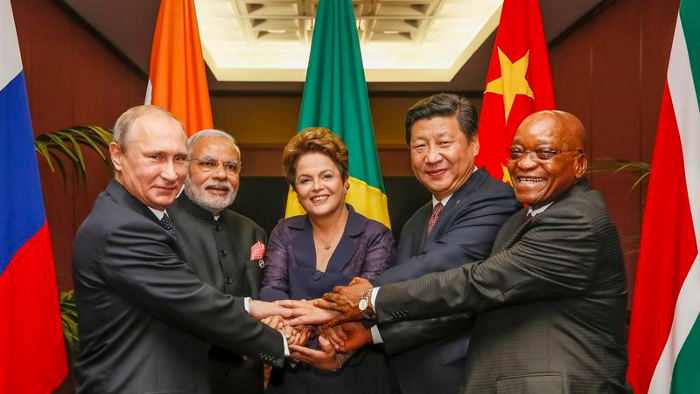
Brazil, Russia, India, China, and South Africa have cooperated for 14 years to fight U.S. hegemony with a new international currency: BRICS.
BRICS is mostly comical. Now. Saudi Arabia, the second-largest oil hegemon, wants to join.
So what?
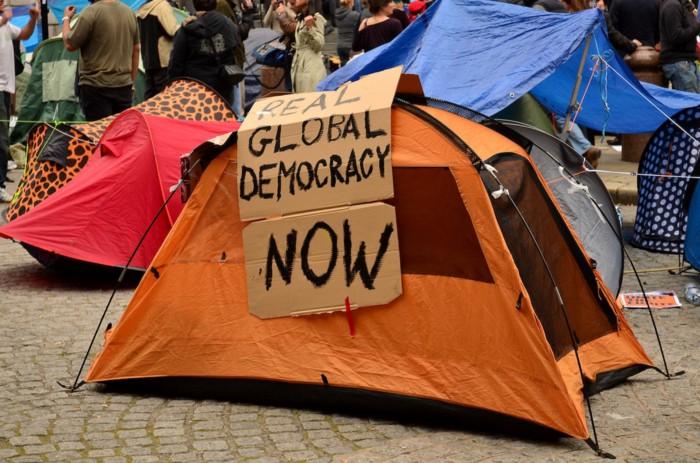
The New World Currency is BRICS
Russia was kicked out of G8 for its aggressiveness in Crimea in 2014.
It's now G7.
No biggie, said Putin, he said, and I quote, “Bon appetite.”
He was prepared. China, India, and Brazil lead the New World Order.
Together, they constitute 40% of the world's population and, according to the IMF, 50% of the world's GDP by 2030.
Here’s what the BRICS president Marcos Prado Troyjo had to say earlier this year about no longer needing the US dollar: “We have implemented the mechanism of mutual settlements in rubles and rupees, and there is no need for our countries to use the dollar in mutual settlements. And today a similar mechanism of mutual settlements in rubles and yuan is being developed by China.”
Ick. That's D.C. and NYC warmongers licking their chops for WW3 nasty.
Here's a lovely picture of BRICS to relax you:
If Saudi Arabia joins BRICS, as President Mohammed Bin Salman has expressed interest, a majority of the Middle East will have joined forces to construct a new world order not based on the US currency.
I'm not sure of the new acronym.
SBRICSS? CIRBSS? CRIBSS?
The Reason America Is Harvesting What It Sowed
BRICS began 14 years ago.
14 years ago, what occurred? Concentrate. It involved CDOs, bad subprime mortgages, and Wall Street quants crunching numbers.
2008 recession
When two nations trade, they do so in US dollars, not Euros or gold.
What happened when 2008, an avoidable crisis caused by US banks' cupidity and ignorance, what happened?
Everyone WORLDWIDE felt the pain.
Mostly due to corporate America's avarice.
This should have been a warning that China and Russia had enough of our bs. Like when France sent a battleship to America after Nixon scrapped the gold standard. The US was warned to shape up or be dethroned (or at least try).
Nixon improved in 1971. Kinda. Invented PetroDollar.
Another BS system that unfairly favors America and possibly pushed Russia, China, and Saudi Arabia into BRICS.
The PetroDollar forces oil-exporting nations to trade in US dollars and invest in US Treasury bonds. Brilliant. Genius evil.
Our misdeeds are:
In conflicts that are not its concern, the USA uses the global reserve currency as a weapon.
Targeted nations abandon the dollar, and rightfully so, as do nations that depend on them for trade in vital resources.
The dollar's position as the world's reserve currency is in jeopardy, which could have disastrous economic effects.
Although we have actually sown our own doom, we appear astonished. According to the Bible, whomever sows to appease his sinful nature will reap destruction from that nature whereas whoever sows to appease the Spirit will reap eternal life from the Spirit.
Americans, even our leaders, lack caution and delayed pleasure. When our unsustainable systems fail, we double down. Bailouts of the banks in 2008 were myopic, puerile, and another nail in America's hegemony.
America has screwed everyone.
We're unpopular.
The BRICS's future
It's happened before.
Saddam Hussein sold oil in Euros in 2000, and the US invaded Iraq a month later. The media has devalued the word conspiracy. The Iraq conspiracy.
There were no WMDs, but NYT journalists like Judy Miller drove Americans into a warmongering frenzy because Saddam would ruin the PetroDollar. Does anyone recall that this war spawned ISIS?
I think America has done good for the world. You can make a convincing case that we're many people's villain.
Learn more in Confessions of an Economic Hitman, The Devil's Chessboard, or Tyranny of the Federal Reserve. Or ignore it. That's easier.
We, America, should extend an olive branch, ask for forgiveness, and learn from our faults, as the Tao Te Ching advises. Unlikely. Our population is apathetic and stupid, and our government is corrupt.
Argentina, Iran, Egypt, and Turkey have also indicated interest in joining BRICS. They're also considering making it gold-backed, making it a new world reserve currency.
You should pay attention.
Thanks for reading!

Teronie Donalson
3 years ago
The best financial advice I've ever received and how you can use it.
Taking great financial advice is key to financial success.
A wealthy man told me to INVEST MY MONEY when I was young.
As I entered Starbucks, an older man was leaving. I noticed his watch and expensive-looking shirt, not like the guy in the photo, but one made of fine fabric like vicuna wool, which can only be shorn every two to three years. His Bentley confirmed my suspicions about his wealth.
This guy looked like James Bond, so I asked him how to get rich like him.
"Drug dealer?" he laughed.
Whether he was telling the truth, I'll never know, and I didn't want to be an accessory, but he quickly added, "Kid, invest your money; it will do wonders." He left.
When he told me to invest, he didn't say what. Later, I realized the investment game has so many levels that even if he drew me a blueprint, I wouldn't understand it.
The best advice I received was to invest my earnings. I must decide where to invest.
I'll preface by saying I'm not a financial advisor or Your financial advisor, but I'll share what I've learned from books, links, and sources. The rest is up to you.
Basically:
Invest your Money
Money is money, whether you call it cake, dough, moolah, benjamins, paper, bread, etc.
If you're lucky, you can buy one of the gold shirts in the photo.
Investing your money today means putting it towards anything that could be profitable.
According to the website Investopedia:
“Investing is allocating money to generate income or profit.”
You can invest in a business, real estate, or a skill that will pay off later.
Everyone has different goals and wants at different stages of life, so investing varies.
He was probably a sugar daddy with his Bentley, nice shirt, and Rolex.
In my twenties, I started making "good" money; now, in my forties, with a family and three kids, I'm building a legacy for my grandkids.
“It’s not how much money you make, but how much money you keep, how hard it works for you, and how many generations you keep it for.” — Robert Kiyosaki.
Money isn't evil, but lack of it is.
Financial stress is a major source of problems, according to studies.
Being broke hurts, especially if you want to provide for your family or do things.
“An investment in knowledge pays the best interest.” — Benjamin Franklin.
Investing in knowledge is invaluable. Before investing, do your homework.
You probably didn't learn about investing when you were young, like I didn't. My parents were in survival mode, making investing difficult.
In my 20s, I worked in banking to better understand money.
So, why invest?
Growth requires investment.
Investing puts money to work and can build wealth. Your money may outpace inflation with smart investing. Compounding and the risk-return tradeoff boost investment growth.
Investing your money means you won't have to work forever — unless you want to.
Two common ways to make money are;
-working hard,
and
-interest or capital gains from investments.
Capital gains can help you invest.
“How many millionaires do you know who have become wealthy by investing in savings accounts? I rest my case.” — Robert G. Allen
If you keep your money in a savings account, you'll earn less than 2% interest at best; the bank makes money by loaning it out.
Savings accounts are a safe bet, but the low-interest rates limit your gains.
Don't skip it. An emergency fund should be in a savings account, not the market.
Other reasons to invest:
Investing can generate regular income.
If you own rental properties, the tenant's rent will add to your cash flow.
Daily, weekly, or monthly rentals (think Airbnb) generate higher returns year-round.
Capital gains are taxed less than earned income if you own dividend-paying or appreciating stock.
Time is on your side
“Compound interest is the eighth wonder of the world. He who understands it, earns it; he who doesn’t — pays it.” — Albert Einstein
Historical data shows that young investors outperform older investors. So you can use compound interest over decades instead of investing at 45 and having less time to earn.
If I had taken that man's advice and invested in my twenties, I would have made a decent return by my thirties. (Depending on my investments)
So for those who live a YOLO (you only live once) life, investing can't hurt.
Investing increases your knowledge.
Lessons are clearer when you're invested. Each win boosts confidence and draws attention to losses. Losing money prompts you to investigate.
Before investing, I read many financial books, but I didn't understand them until I invested.
Now what?
What do you invest in? Equities, mutual funds, ETFs, retirement accounts, savings, business, real estate, cryptocurrencies, marijuana, insurance, etc.
The key is to start somewhere. Know you don't know everything. You must care.
“A journey of a thousand miles must begin with a single step.” — Lao Tzu.
Start simple because there's so much information. My first investment book was:
Robert Kiyosaki's "Rich Dad, Poor Dad"
This easy-to-read book made me hungry for more. This book is about the money lessons rich parents teach their children, which poor and middle-class parents neglect. The poor and middle-class work for money, while the rich let their assets work for them, says Kiyosaki.
There is so much to learn, but you gotta start somewhere.
More books:
***Wisdom
I hope I'm not suggesting that investing makes everything rosy. Remember three rules:
1. Losing money is possible.
2. Losing money is possible.
3. Losing money is possible.
You can lose money, so be careful.
Read, research, invest.
Golden rules for Investing your money
Never invest money you can't lose.
Financial freedom is possible regardless of income.
"Courage taught me that any sound investment will pay off, no matter how bad a crisis gets." Helu Carlos
"I'll tell you Wall Street's secret to wealth. When others are afraid, you're greedy. You're afraid when others are greedy. Buffett
Buy low, sell high, and have an exit strategy.
Ask experts or wealthy people for advice.
"With a good understanding of history, we can have a clear vision of the future." Helu Carlos
"It's not whether you're right or wrong, but how much money you make when you're right." Soros
"The individual investor should act as an investor, not a speculator." Graham
"It's different this time" is the most dangerous investment phrase. Templeton
Lastly,
Avoid quick-money schemes. Building wealth takes years, not months.
Start small and work your way up.
Thanks for reading!
This post is a summary. Read the full article here