


Clean API Call With React Hooks
| Photo by Juanjo Jaramillo on Unsplash |
Calling APIs is the most common thing to do in any modern web application. When it comes to talking with an API then most of the time we need to do a lot of repetitive things like getting data from an API call, handling the success or error case, and so on.
When calling tens of hundreds of API calls we always have to do those tedious tasks. We can handle those things efficiently by putting a higher level of abstraction over those barebone API calls, whereas in some small applications, sometimes we don’t even care.
The problem comes when we start adding new features on top of the existing features without handling the API calls in an efficient and reusable manner. In that case for all of those API calls related repetitions, we end up with a lot of repetitive code across the whole application.
In React, we have different approaches for calling an API. Nowadays mostly we use React hooks. With React hooks, it’s possible to handle API calls in a very clean and consistent way throughout the application in spite of whatever the application size is. So let’s see how we can make a clean and reusable API calling layer using React hooks for a simple web application.
I’m using a code sandbox for this blog which you can get here.
import "./styles.css";
import React, { useEffect, useState } from "react";
import axios from "axios";
export default function App() {
const [posts, setPosts] = useState(null);
const [error, setError] = useState("");
const [loading, setLoading] = useState(false);
useEffect(() => {
handlePosts();
}, []);
const handlePosts = async () => {
setLoading(true);
try {
const result = await axios.get(
"https://jsonplaceholder.typicode.com/posts"
);
setPosts(result.data);
} catch (err) {
setError(err.message || "Unexpected Error!");
} finally {
setLoading(false);
}
};
return (
<div className="App">
<div>
<h1>Posts</h1>
{loading && <p>Posts are loading!</p>}
{error && <p>{error}</p>}
<ul>
{posts?.map((post) => (
<li key={post.id}>{post.title}</li>
))}
</ul>
</div>
</div>
);
}
I know the example above isn’t the best code but at least it’s working and it’s valid code. I will try to improve that later. For now, we can just focus on the bare minimum things for calling an API.
Here, you can try to get posts data from JsonPlaceholer. Those are the most common steps we follow for calling an API like requesting data, handling loading, success, and error cases.
If we try to call another API from the same component then how that would gonna look? Let’s see.
500: Internal Server Error
Now it’s going insane! For calling two simple APIs we’ve done a lot of duplication. On a top-level view, the component is doing nothing but just making two GET requests and handling the success and error cases. For each request, it’s maintaining three states which will periodically increase later if we’ve more calls.
Let’s refactor to make the code more reusable with fewer repetitions.
Step 1: Create a Hook for the Redundant API Request Codes
Most of the repetitions we have done so far are about requesting data, handing the async things, handling errors, success, and loading states. How about encapsulating those things inside a hook?
The only unique things we are doing inside handleComments and handlePosts are calling different endpoints. The rest of the things are pretty much the same. So we can create a hook that will handle the redundant works for us and from outside we’ll let it know which API to call.
500: Internal Server Error
Here, this request function is identical to what we were doing on the handlePosts and handleComments. The only difference is, it’s calling an async function apiFunc which we will provide as a parameter with this hook. This apiFunc is the only independent thing among any of the API calls we need.
With hooks in action, let’s change our old codes in App component, like this:
500: Internal Server Error
How about the current code? Isn’t it beautiful without any repetitions and duplicate API call handling things?
Let’s continue our journey from the current code. We can make App component more elegant. Now it knows a lot of details about the underlying library for the API call. It shouldn’t know that. So, here’s the next step…
Step 2: One Component Should Take Just One Responsibility
Our App component knows too much about the API calling mechanism. Its responsibility should just request the data. How the data will be requested under the hood, it shouldn’t care about that.
We will extract the API client-related codes from the App component. Also, we will group all the API request-related codes based on the API resource. Now, this is our API client:
import axios from "axios";

const apiClient = axios.create({
  // Later read this URL from an environment variable
  baseURL: "https://jsonplaceholder.typicode.com"
});

export default apiClient;
All API calls for comments resource will be in the following file:
import client from "./client";

const getComments = () => client.get("/comments");

export default {
  getComments
};
All API calls for posts resource are placed in the following file:
import client from "./client";

const getPosts = () => client.get("/posts");

export default {
  getPosts
};
Finally, the App component looks like the following:
import "./styles.css";
import React, { useEffect } from "react";
import commentsApi from "./api/comments";
import postsApi from "./api/posts";
import useApi from "./hooks/useApi";

export default function App() {
  const getPostsApi = useApi(postsApi.getPosts);
  const getCommentsApi = useApi(commentsApi.getComments);

  useEffect(() => {
    getPostsApi.request();
    getCommentsApi.request();
  }, []);

  return (
    <div className="App">
      {/* Post List */}
      <div>
        <h1>Posts</h1>
        {getPostsApi.loading && <p>Posts are loading!</p>}
        {getPostsApi.error && <p>{getPostsApi.error}</p>}
        <ul>
          {getPostsApi.data?.map((post) => (
            <li key={post.id}>{post.title}</li>
          ))}
        </ul>
      </div>
      {/* Comment List */}
      <div>
        <h1>Comments</h1>
        {getCommentsApi.loading && <p>Comments are loading!</p>}
        {getCommentsApi.error && <p>{getCommentsApi.error}</p>}
        <ul>
          {getCommentsApi.data?.map((comment) => (
            <li key={comment.id}>{comment.name}</li>
          ))}
        </ul>
      </div>
    </div>
  );
}
Now it doesn’t know anything about how the APIs get called. Tomorrow if we want to change the API calling library from axios to fetch or anything else, our App component code will not get affected. We can just change the codes form client.js This is the beauty of abstraction.
Apart from the abstraction of API calls, Appcomponent isn’t right the place to show the list of the posts and comments. It’s a high-level component. It shouldn’t handle such low-level data interpolation things.
So we should move this data display-related things to another low-level component. Here I placed those directly in the App component just for the demonstration purpose and not to distract with component composition-related things.
Final Thoughts
The React library gives the flexibility for using any kind of third-party library based on the application’s needs. As it doesn’t have any predefined architecture so different teams/developers adopted different approaches to developing applications with React. There’s nothing good or bad. We choose the development practice based on our needs/choices. One thing that is there beyond any choices is writing clean and maintainable codes.
More on Web3 & Crypto

CoinTelegraph
4 years ago
2 NFT-based blockchain games that could soar in 2022
NFTs look ready to rule 2022, and the recent pivot toward NFT utility in P2E gaming could make blockchain gaming this year’s sector darling.
After the popularity of decentralized finance (DeFi) came the rise of nonfungible tokens (NFTs), and to the surprise of many, NFTs took the spotlight and now remain front and center with the highest volume in sales occurring at the start of January 2022.
While 2021 became the year of NFTs, GameFi applications did surpass DeFi in terms of user popularity. According to data from DappRadar, Bloomberg gathered:
Nearly 50% of active cryptocurrency wallets connected to decentralized applications in November were for playing games. The percentage of wallets linked to decentralized finance, or DeFi, dapps fell to 45% during the same period, after months of being the leading dapp use case.
Blockchain play-to-earn (P2E) game Axie infinity skyrocketed and kicked off a gaming craze that is expected to continue all throughout 2022. Crypto pundits and gaming advocates have high expectations for P2E blockchain-based games and there’s bound to be a few sleeping giants that will dominate the sector.
Let’s take a look at five blockchain games that could make waves in 2022.
DeFi Kingdoms
The inspiration for DeFi Kingdoms came from simple beginnings — a passion for investing that lured the developers to blockchain technology. DeFi Kingdoms was born as a visualization of liquidity pool investing where in-game ‘gardens’ represent literal and figurative token pairings and liquidity pool mining.
As shown in the game, investors have a portion of their LP share within a plot filled with blooming plants. By attaching the concept of growth to DeFi protocols within a play-and-earn model, DeFi Kingdoms puts a twist on “playing” a game.
Built on the Harmony Network, DeFi Kingdoms became the first project on the network to ever top the DappRadar charts. This could be attributed to an influx of individuals interested in both DeFi and blockchain games or it could be attributed to its recent in-game utility token JEWEL surging.
JEWEL is a utility token that allows users to purchase NFTs in-game buffs to increase a base-level stat. It is also used for liquidity mining to grant users the opportunity to make more JEWEL through staking.
JEWEL is also a governance token that gives holders a vote in the growth and evolution of the project. In the past four months, the token price surged from $1.23 to an all-time high of $22.52. At the time of writing, JEWEL is down by nearly 16%, trading at $19.51.
Surging approximately 1,487% from its humble start of $1.23 four months ago in September, JEWEL token price has increased roughly 165% this last month alone, according to data from CoinGecko.
Guild of Guardians
Guild of Guardians is one of the more anticipated blockchain games in 2022 and it is built on ImmutableX, the first layer-two solution built on Ethereum that focuses on NFTs. Aiming to provide more access, it will operate as a free-to-play mobile role-playing game, modeling the P2E mechanics.
Similar to blockchain games like Axie Infinity, Guild of Guardians in-game assets can be exchanged. The project seems to be of interest to many gamers and investors with its NFT founder sale and token launch generating nearly $10 million in volume.
Launching its in-game token in October of 2021, the Guild of Guardians (GOG) tokens are ERC-20 tokens known as ‘gems’ inside the game. Gems are what power key features in the game such as minting in-game NFTs and interacting with the marketplace, and are available to earn while playing.
For the last month, the Guild of Guardians token has performed rather steadily after spiking to its all-time high of $2.81 after its launch. Despite the token being down over 50% from its all-time high, at the time of writing, some members of the community are looking forward to the possibility of staking and liquidity pools, which are features that tend to help stabilize token prices.

Jeff John Roberts
3 years ago
Jack Dorsey and Jay-Z Launch 'Bitcoin Academy' in Brooklyn rapper's home
The new Bitcoin Academy will teach Jay-Marcy Z's Houses neighbors "What is Cryptocurrency."
Jay-Z grew up in Brooklyn's Marcy Houses. The rapper and Block CEO Jack Dorsey are giving back to his hometown by creating the Bitcoin Academy.
The Bitcoin Academy will offer online and in-person classes, including "What is Money?" and "What is Blockchain?"
The program will provide participants with a mobile hotspot and a small amount of Bitcoin for hands-on learning.
Students will receive dinner and two evenings of instruction until early September. The Shawn Carter Foundation will help with on-the-ground instruction.
Jay-Z and Dorsey announced the program Thursday morning. It will begin at Marcy Houses but may be expanded.
Crypto Blockchain Plug and Black Bitcoin Billionaire, which has received a grant from Block, will teach the classes.
Jay-Z, Dorsey reunite
Jay-Z and Dorsey have previously worked together to promote a Bitcoin and crypto-based future.
In 2021, Dorsey's Block (then Square) acquired the rapper's streaming music service Tidal, which they propose using for NFT distribution.
Dorsey and Jay-Z launched an endowment in 2021 to fund Bitcoin development in Africa and India.
Dorsey is funding the new Bitcoin Academy out of his own pocket (as is Jay-Z), but he's also pushed crypto-related charitable endeavors at Block, including a $5 million fund backed by corporate Bitcoin interest.
This post is a summary. Read full article here
Isobel Asher Hamilton
3 years ago
$181 million in bitcoin buried in a dump. $11 million to get them back

James Howells lost 8,000 bitcoins. He has $11 million to get them back.
His life altered when he threw out an iPhone-sized hard drive.
Howells, from the city of Newport in southern Wales, had two identical laptop hard drives squirreled away in a drawer in 2013. One was blank; the other had 8,000 bitcoins, currently worth around $181 million.
He wanted to toss out the blank one, but the drive containing the Bitcoin went to the dump.
He's determined to reclaim his 2009 stash.
Howells, 36, wants to arrange a high-tech treasure hunt for bitcoins. He can't enter the landfill.

Newport's city council has rebuffed Howells' requests to dig for his hard drive for almost a decade, stating it would be expensive and environmentally destructive.
I got an early look at his $11 million idea to search 110,000 tons of trash. He expects submitting it to the council would convince it to let him recover the hard disk.
110,000 tons of trash, 1 hard drive
Finding a hard disk among heaps of trash may seem Herculean.
Former IT worker Howells claims it's possible with human sorters, robot dogs, and an AI-powered computer taught to find hard drives on a conveyor belt.
His idea has two versions, depending on how much of the landfill he can search.
His most elaborate solution would take three years and cost $11 million to sort 100,000 metric tons of waste. Scaled-down version costs $6 million and takes 18 months.
He's created a team of eight professionals in AI-powered sorting, landfill excavation, garbage management, and data extraction, including one who recovered Columbia's black box data.
The specialists and their companies would be paid a bonus if they successfully recovered the bitcoin stash.
Howells: "We're trying to commercialize this project."
Howells claimed rubbish would be dug up by machines and sorted near the landfill.
Human pickers and a Max-AI machine would sort it. The machine resembles a scanner on a conveyor belt.
Remi Le Grand of Max-AI told us it will train AI to recognize Howells-like hard drives. A robot arm would select candidates.
Howells has added security charges to his scheme because he fears people would steal the hard drive.
He's budgeted for 24-hour CCTV cameras and two robotic "Spot" canines from Boston Dynamics that would patrol at night and look for his hard drive by day.
Howells said his crew met in May at the Celtic Manor Resort outside Newport for a pitch rehearsal.
Richard Hammond's narrative swings from banal to epic.
Richard Hammond filmed the meeting and created a YouTube documentary on Howells.
Hammond said of Howells' squad, "They're committed and believe in him and the idea."
Hammond: "It goes from banal to gigantic." "If I were in his position, I wouldn't have the strength to answer the door."
Howells said trash would be cleaned and repurposed after excavation. Reburying the rest.
"We won't pollute," he declared. "We aim to make everything better."

After the project is finished, he hopes to develop a solar or wind farm on the dump site. The council is unlikely to accept his vision soon.
A council representative told us, "Mr. Howells can't convince us of anything." "His suggestions constitute a significant ecological danger, which we can't tolerate and are forbidden by our permit."
Will the recovered hard drive work?
The "platter" is a glass or metal disc that holds the hard drive's data. Howells estimates 80% to 90% of the data will be recoverable if the platter isn't damaged.
Phil Bridge, a data-recovery expert who consulted Howells, confirmed these numbers.

If the platter is broken, Bridge adds, data recovery is unlikely.
Bridge says he was intrigued by the proposal. "It's an intriguing case," he added. Helping him get it back and proving everyone incorrect would be a great success story.
Who'd pay?
Swiss and German venture investors Hanspeter Jaberg and Karl Wendeborn told us they would fund the project if Howells received council permission.
Jaberg: "It's a needle in a haystack and a high-risk investment."
Howells said he had no contract with potential backers but had discussed the proposal in Zoom meetings. "Until Newport City Council gives me something in writing, I can't commit," he added.
Suppose he finds the bitcoins.
Howells said he would keep 30% of the data, worth $54 million, if he could retrieve it.
A third would go to the recovery team, 30% to investors, and the remainder to local purposes, including gifting £50 ($61) in bitcoin to each of Newport's 150,000 citizens.
Howells said he opted to spend extra money on "professional firms" to help convince the council.
What if the council doesn't approve?
If Howells can't win the council's support, he'll sue, claiming its actions constitute a "illegal embargo" on the hard drive. "I've avoided that path because I didn't want to cause complications," he stated. I wanted to cooperate with Newport's council.
Howells never met with the council face-to-face. He mentioned he had a 20-minute Zoom meeting in May 2021 but thought his new business strategy would help.
He met with Jessica Morden on June 24. Morden's office confirmed meeting.
After telling the council about his proposal, he can only wait. "I've never been happier," he said. This is our most professional operation, with the best employees.
The "crypto proponent" buys bitcoin every month and sells it for cash.
Howells tries not to think about what he'd do with his part of the money if the hard disk is found functional. "Otherwise, you'll go mad," he added.
This post is a summary. Read the full article here.
You might also like

Jari Roomer
3 years ago
10 Alternatives to Smartphone Scrolling
"Don't let technology control you; manage your phone."
"Don't become a slave to technology," said Richard Branson. "Manage your phone, don't let it manage you."
Unfortunately, most people are addicted to smartphones.
Worrying smartphone statistics:
46% of smartphone users spend 5–6 hours daily on their device.
The average adult spends 3 hours 54 minutes per day on mobile devices.
We check our phones 150–344 times per day (every 4 minutes).
During the pandemic, children's daily smartphone use doubled.
Having a list of productive, healthy, and fulfilling replacement activities is an effective way to reduce smartphone use.
The more you practice these smartphone replacements, the less time you'll waste.
Skills Development
Most people say they 'don't have time' to learn new skills or read more. Lazy justification. The issue isn't time, but time management. Distractions and low-quality entertainment waste hours every day.
The majority of time is spent in low-quality ways, according to Richard Koch, author of The 80/20 Principle.
What if you swapped daily phone scrolling for skill-building?
There are dozens of skills to learn, from high-value skills to make more money to new languages and party tricks.
Learning a new skill will last for years, if not a lifetime, compared to scrolling through your phone.
Watch Docs
Love documentaries. It's educational and relaxing. A good documentary helps you understand the world, broadens your mind, and inspires you to change.
Recent documentaries I liked include:
14 Peaks: Nothing Is Impossible
The Social Dilemma
Jim & Andy: The Great Beyond
Fantastic Fungi
Make money online
If you've ever complained about not earning enough money, put away your phone and get to work.
Instead of passively consuming mobile content, start creating it. Create something worthwhile. Freelance.
Internet makes starting a business or earning extra money easier than ever.
(Grand)parents didn't have this. Someone made them work 40+ hours. Few alternatives existed.
Today, all you need is internet and a monetizable skill. Use the internet instead of letting it distract you. Profit from it.
Bookworm
Jack Canfield, author of Chicken Soup For The Soul, said, "Everyone spends 2–3 hours a day watching TV." If you read that much, you'll be in the top 1% of your field."
Few people have more than two hours per day to read.
If you read 15 pages daily, you'd finish 27 books a year (as the average non-fiction book is about 200 pages).
Jack Canfield's quote remains relevant even though 15 pages can be read in 20–30 minutes per day. Most spend this time watching TV or on their phones.
What if you swapped 20 minutes of mindless scrolling for reading? You'd gain knowledge and skills.
Favorite books include:
The 7 Habits of Highly Effective People — Stephen R. Covey
The War of Art — Steven Pressfield
The Psychology of Money — Morgan Housel
A New Earth — Eckart Tolle
Get Organized
All that screen time could've been spent organizing. It could have been used to clean, cook, or plan your week.
If you're always 'behind,' spend 15 minutes less on your phone to get organized.
"Give me six hours to chop down a tree, and I'll spend the first four sharpening the ax," said Abraham Lincoln. Getting organized is like sharpening an ax, making each day more efficient.
Creativity
Why not be creative instead of consuming others'? Do something creative, like:
Painting
Musically
Photography\sWriting
Do-it-yourself
Construction/repair
Creative projects boost happiness, cognitive functioning, and reduce stress and anxiety. Creative pursuits induce a flow state, a powerful mental state.
This contrasts with smartphones' effects. Heavy smartphone use correlates with stress, depression, and anxiety.
Hike
People spend 90% of their time indoors, according to research. This generation is the 'Indoor Generation'
We lack an active lifestyle, fresh air, and vitamin D3 due to our indoor lifestyle (generated through direct sunlight exposure). Mental and physical health issues result.
Put away your phone and get outside. Go on nature walks. Explore your city on foot (or by bike, as we do in Amsterdam) if you live in a city. Move around! Outdoors!
You can't spend your whole life staring at screens.
Podcasting
Okay, a smartphone is needed to listen to podcasts. When you use your phone to get smarter, you're more productive than 95% of people.
Favorite podcasts:
The Pomp Podcast (about cryptocurrencies)
The Joe Rogan Experience
Kwik Brain (by Jim Kwik)
Podcasts can be enjoyed while walking, cleaning, or doing laundry. Win-win.
Journalize
I find journaling helpful for mental clarity. Writing helps organize thoughts.
Instead of reading internet opinions, comments, and discussions, look inward. Instead of Twitter or TikTok, look inward.
“It never ceases to amaze me: we all love ourselves more than other people, but care more about their opinion than our own.” — Marcus Aurelius
Give your mind free reign with pen and paper. It will highlight important thoughts, emotions, or ideas.
Never write for another person. You want unfiltered writing. So you get the best ideas.
Find your best hobbies
List your best hobbies. I guarantee 95% of people won't list smartphone scrolling.
It's often low-quality entertainment. The dopamine spike is short-lived, and it leaves us feeling emotionally 'empty'
High-quality leisure sparks happiness. They make us happy and alive. Everyone has different interests, so these activities vary.
My favorite quality hobbies are:
Nature walks (especially the mountains)
Video game party
Watching a film with my girlfriend
Gym weightlifting
Complexity learning (such as the blockchain and the universe)
This brings me joy. They make me feel more fulfilled and 'rich' than social media scrolling.
Make a list of your best hobbies to refer to when you're spending too much time on your phone.
Matthew Royse
3 years ago
These 10 phrases are unprofessional at work.
Successful workers don't talk this way.

"I know it's unprofessional, but I can't stop." — Author Sandy Hall
Do you realize your unprofessionalism? Do you care? Self-awareness?
Everyone can improve their unprofessionalism. Some workplace phrases and words shouldn't be said.
People often say out loud what they're thinking. They show insecurity, incompetence, and disrespect.
"Think before you speak," goes the saying.
Some of these phrases are "okay" in certain situations, but you'll lose colleagues' respect if you use them often.
Your word choice. Your tone. Your intentions. They matter.
Choose your words carefully to build work relationships and earn peer respect. You should build positive relationships with coworkers and clients.
These 10 phrases are unprofessional.
1. That Meeting Really Sucked
Wow! Were you there? You should be responsible if you attended. You can influence every conversation.
Alternatives
Improve the meeting instead of complaining afterward. Make it more meaningful and productive.
2. Not Sure if You Saw My Last Email
Referencing a previous email irritates people. Email follow-up can be difficult. Most people get tons of emails a day, so it may have been buried, forgotten, or low priority.
Alternatives
It's okay to follow up, but be direct, short, and let the recipient "save face"
3. Any Phrase About Sex, Politics, and Religion
Discussing sex, politics, and religion at work is foolish. If you discuss these topics, you could face harassment lawsuits.
Alternatives
Keep quiet about these contentious issues. Don't touch them.
4. I Know What I’m Talking About
Adding this won't persuade others. Research, facts, and topic mastery are key to persuasion. If you're knowledgeable, you don't need to say this.
Alternatives
Please don’t say it at all. Justify your knowledge.
5. Per Our Conversation
This phrase sounds like legal language. You seem to be documenting something legally. Cold, stern, and distant. "As discussed" sounds inauthentic.
Alternatives
It was great talking with you earlier; here's what I said.
6. Curse-Word Phrases
Swearing at work is unprofessional. You never know who's listening, so be careful. A child may be at work or on a Zoom or Teams call. Workplace cursing is unacceptable.
Alternatives
Avoid adult-only words.
7. I Hope This Email Finds You Well
This is a unique way to wish someone well. This phrase isn't as sincere as the traditional one. When you talk about the email, you're impersonal.
Alternatives
Genuinely care for others.
8. I Am Really Stressed
Happy, strong, stress-managing coworkers are valued. Manage your own stress. Exercise, sleep, and eat better.
Alternatives
Everyone has stress, so manage it. Don't talk about your stress.
9. I Have Too Much to Do
You seem incompetent. People think you can't say "no" or have poor time management. If you use this phrase, you're telling others you may need to change careers.
Alternatives
Don't complain about your workload; just manage it.
10. Bad Closing Salutations
"Warmly," "best," "regards," and "warm wishes" are common email closings. This conclusion sounds impersonal. Why use "warmly" for finance's payment status?
Alternatives
Personalize the closing greeting to the message and recipient. Use "see you tomorrow" or "talk soon" as closings.
Bringing It All Together
These 10 phrases are unprofessional at work. That meeting sucked, not sure if you saw my last email, and sex, politics, and religion phrases.
Also, "I know what I'm talking about" and any curse words. Also, avoid phrases like I hope this email finds you well, I'm stressed, and I have too much to do.
Successful workers communicate positively and foster professionalism. Don't waste chances to build strong work relationships by being unprofessional.
“Unprofessionalism damages the business reputation and tarnishes the trust of society.” — Pearl Zhu, an American author
This post is a summary. Read full article here

Tim Soulo
3 years ago
Here is why 90.63% of Pages Get No Traffic From Google.
The web adds millions or billions of pages per day.
How much Google traffic does this content get?
In 2017, we studied 2 million randomly-published pages to answer this question. Only 5.7% of them ranked in Google's top 10 search results within a year of being published.
94.3 percent of roughly two million pages got no Google traffic.
Two million pages is a small sample compared to the entire web. We did another study.
We analyzed over a billion pages to see how many get organic search traffic and why.
How many pages get search traffic?
90% of pages in our index get no Google traffic, and 5.2% get ten visits or less.
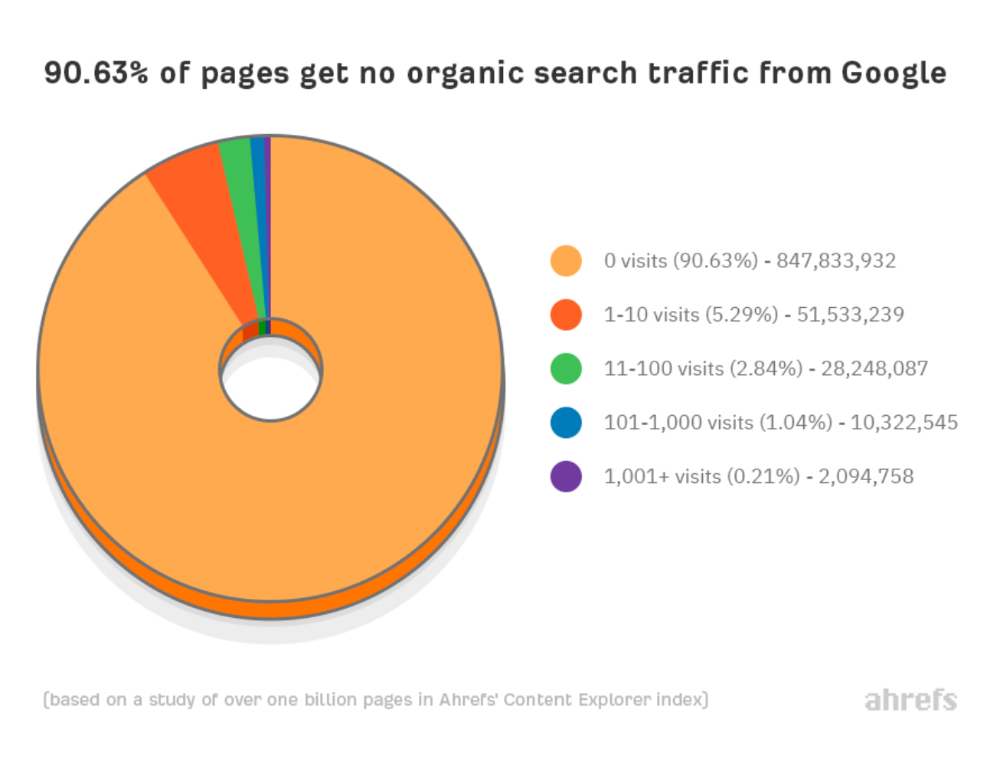
90% of google pages get no organic traffic
How can you join the minority that gets Google organic search traffic?
There are hundreds of SEO problems that can hurt your Google rankings. If we only consider common scenarios, there are only four.
Reason #1: No backlinks
I hate to repeat what most SEO articles say, but it's true:
Backlinks boost Google rankings.
Google's "top 3 ranking factors" include them.
Why don't we divide our studied pages by the number of referring domains?
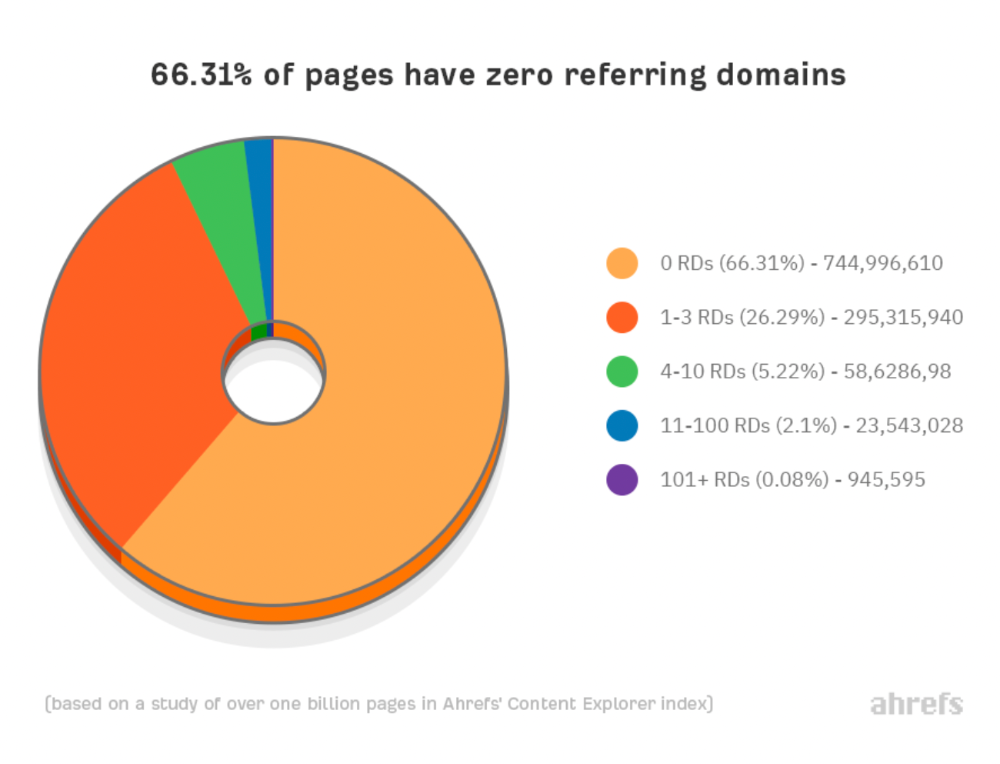
66.31 percent of pages have no backlinks, and 26.29 percent have three or fewer.
Did you notice the trend already?
Most pages lack search traffic and backlinks.
But are these the same pages?
Let's compare monthly organic search traffic to backlinks from unique websites (referring domains):
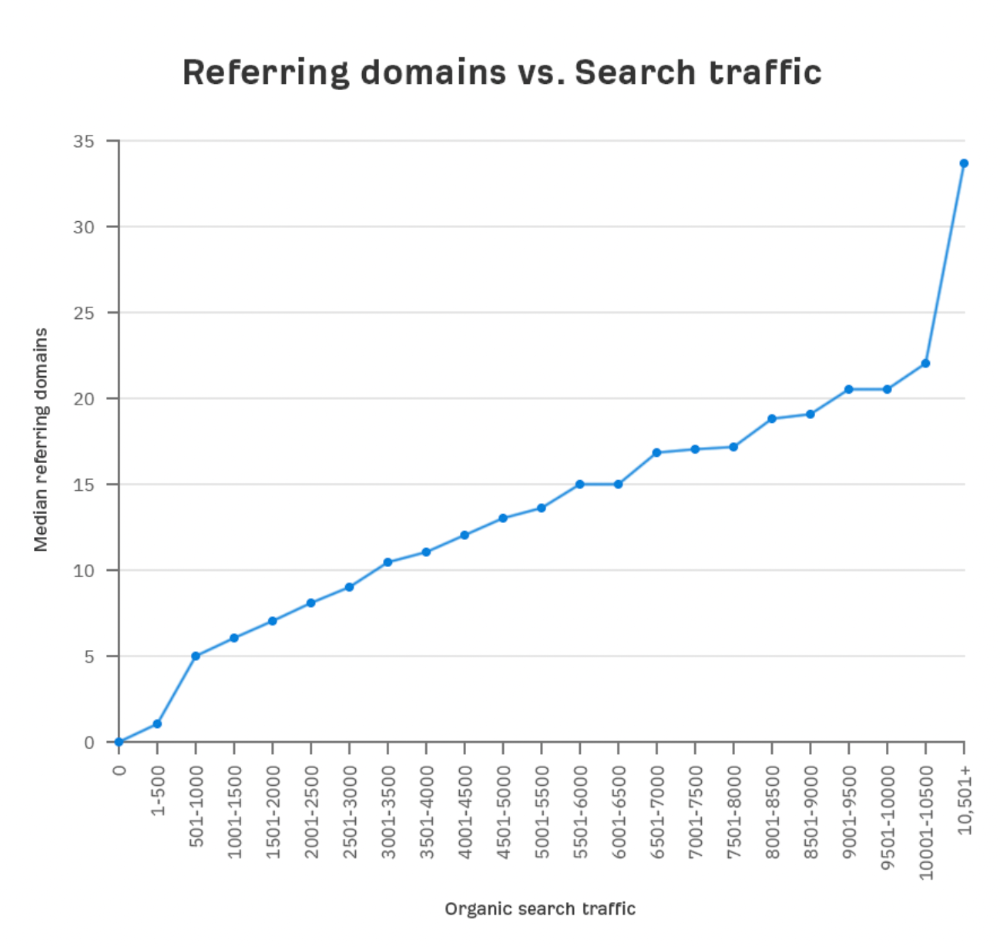
More backlinks equals more Google organic traffic.
Referring domains and keyword rankings are correlated.
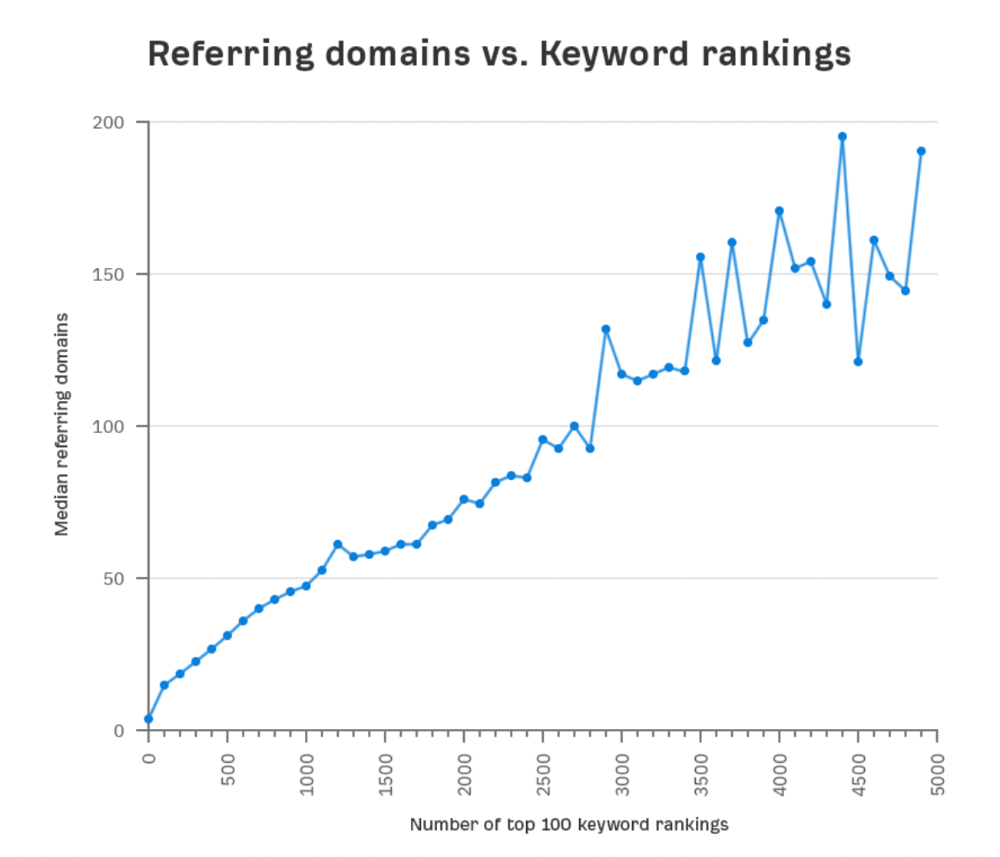
It's important to note that correlation does not imply causation, and none of these graphs prove backlinks boost Google rankings. Most SEO professionals agree that it's nearly impossible to rank on the first page without backlinks.
You'll need high-quality backlinks to rank in Google and get search traffic.
Is organic traffic possible without links?
Here are the numbers:
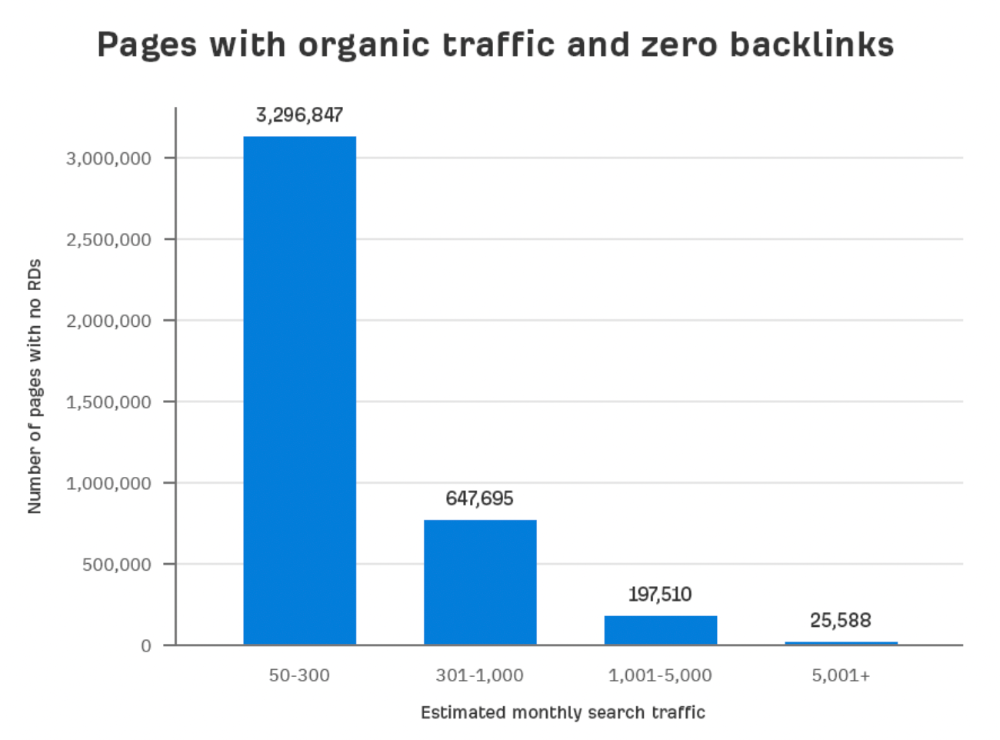
Four million pages get organic search traffic without backlinks. Only one in 20 pages without backlinks has traffic, which is 5% of our sample.
Most get 300 or fewer organic visits per month.
What happens if we exclude high-Domain-Rating pages?
The numbers worsen. Less than 4% of our sample (1.4 million pages) receive organic traffic. Only 320,000 get over 300 monthly organic visits, or 0.1% of our sample.
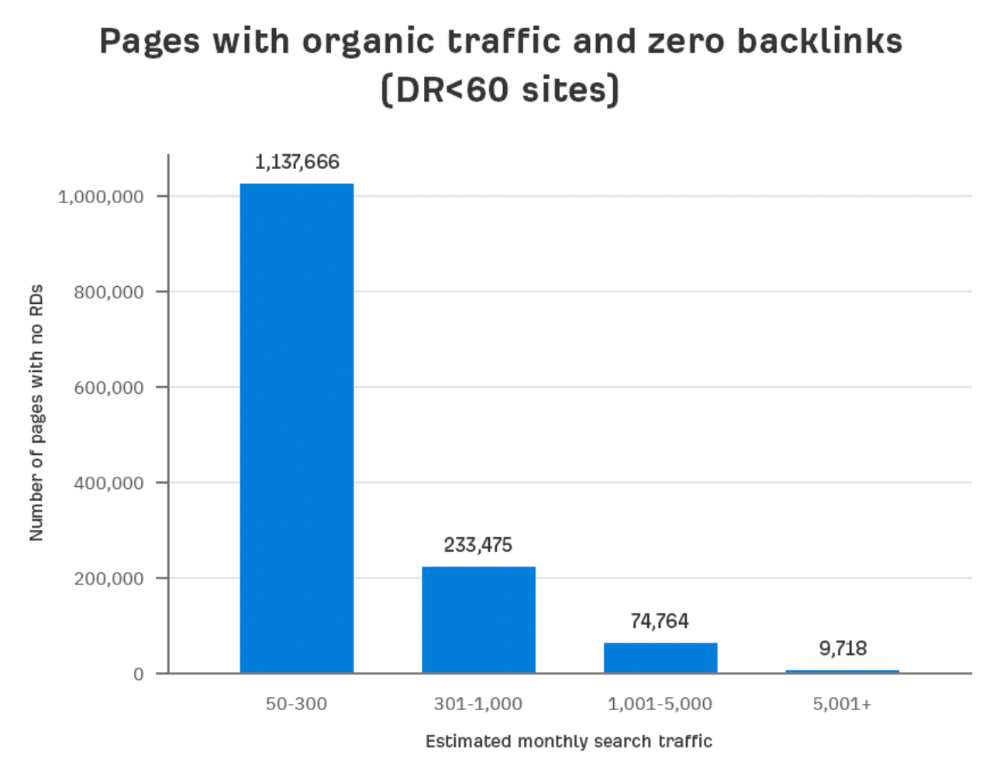
This suggests high-authority pages without backlinks are more likely to get organic traffic than low-authority pages.
Internal links likely pass PageRank to new pages.
Two other reasons:
Our crawler's blocked. Most shady SEOs block backlinks from us. This prevents competitors from seeing (and reporting) PBNs.
They choose low-competition subjects. Low-volume queries are less competitive, requiring fewer backlinks to rank.
If the idea of getting search traffic without building backlinks excites you, learn about Keyword Difficulty and how to find keywords/topics with decent traffic potential and low competition.
Reason #2: The page has no long-term traffic potential.
Some pages with many backlinks get no Google traffic.
Why? I filtered Content Explorer for pages with no organic search traffic and divided them into four buckets by linking domains.
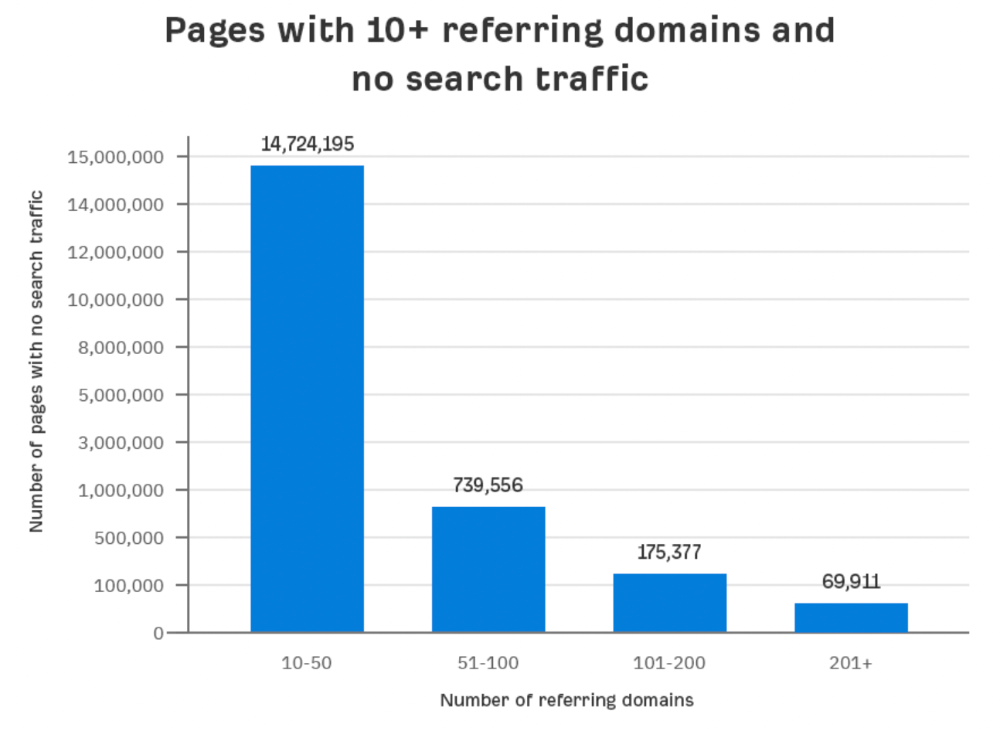
Almost 70k pages have backlinks from over 200 domains, but no search traffic.
By manually reviewing these (and other) pages, I noticed two general trends that explain why they get no traffic:
They overdid "shady link building" and got penalized by Google;
They're not targeting a Google-searched topic.
I won't elaborate on point one because I hope you don't engage in "shady link building"
#2 is self-explanatory:
If nobody searches for what you write, you won't get search traffic.
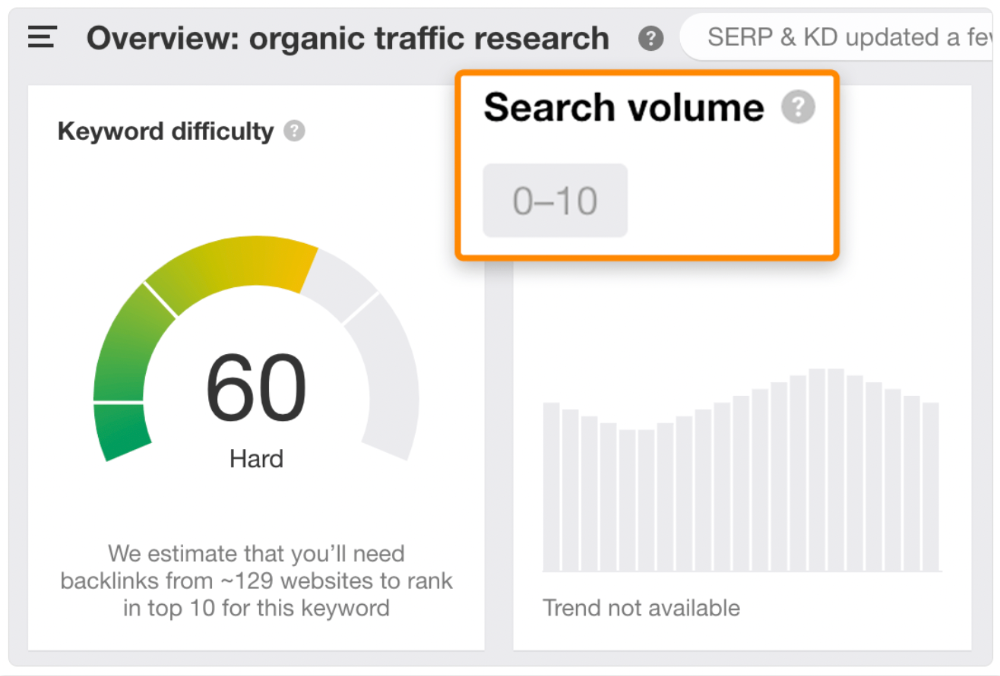
Consider one of our blog posts' metrics:
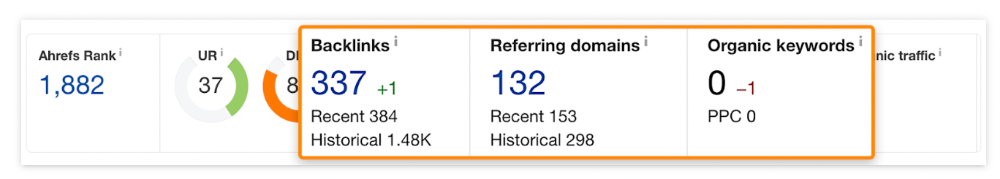
No organic traffic despite 337 backlinks from 132 sites.
The page is about "organic traffic research," which nobody searches for.
News articles often have this. They get many links from around the web but little Google traffic.
People can't search for things they don't know about, and most don't care about old events and don't search for them.
Note:
Some news articles rank in the "Top stories" block for relevant, high-volume search queries, generating short-term organic search traffic.
The Guardian's top "Donald Trump" story:
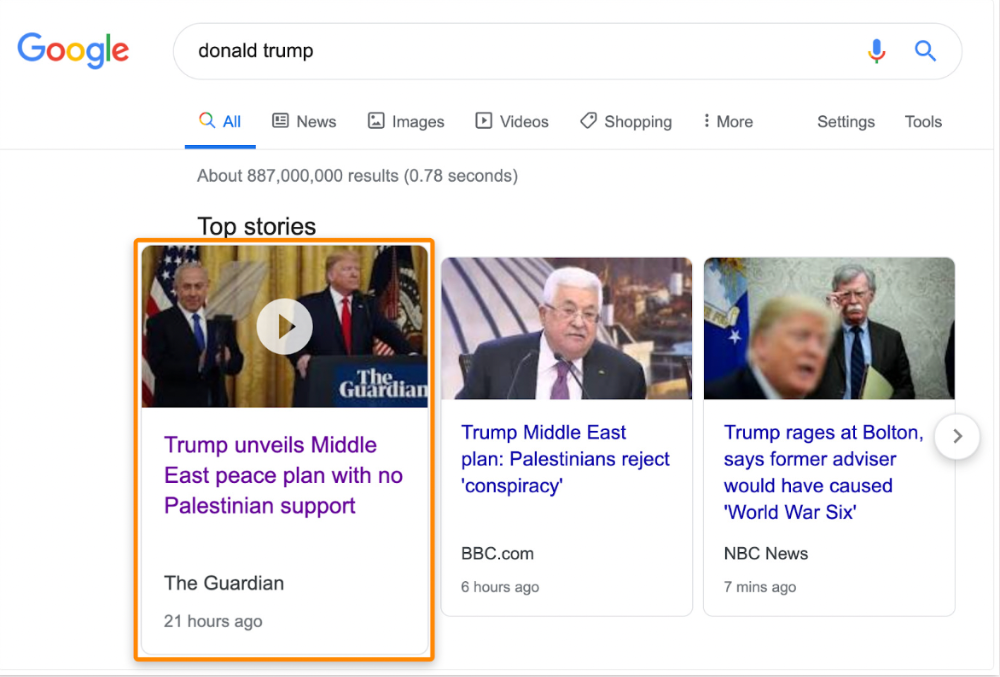
Ahrefs caught on quickly:
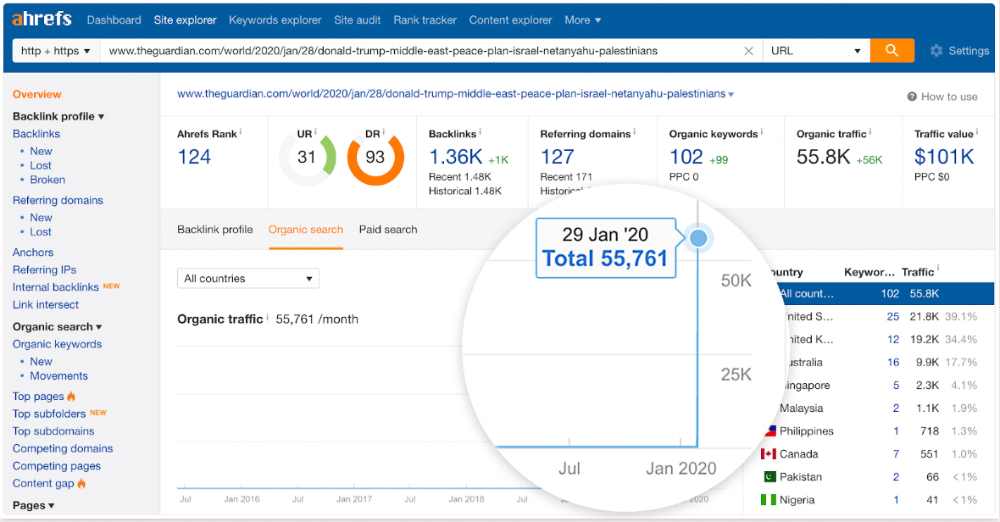
"Donald Trump" gets 5.6M monthly searches, so this page got a lot of "Top stories" traffic.
I bet traffic has dropped if you check now.
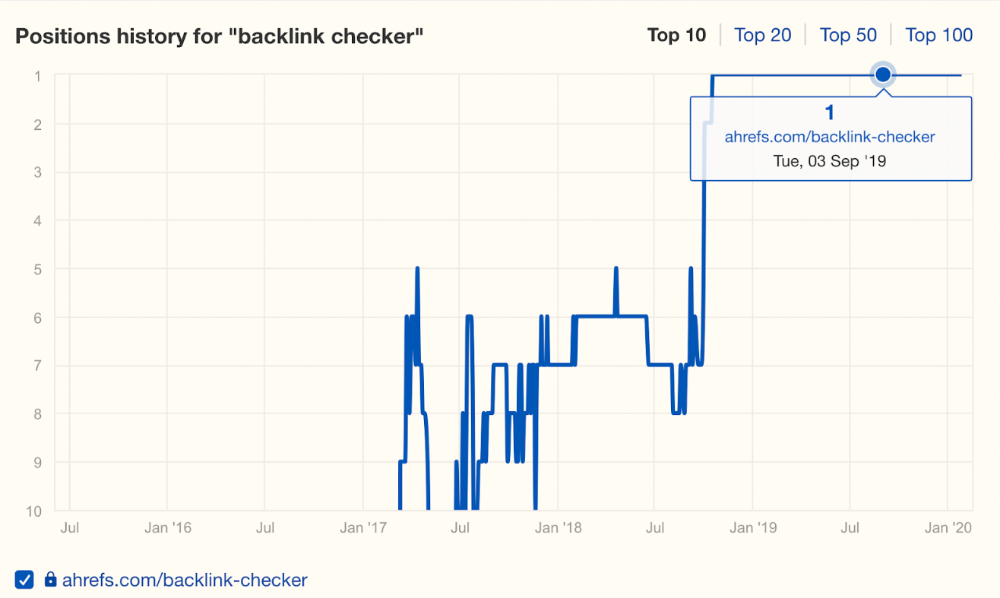
One of the quickest and most effective SEO wins is:
Find your website's pages with the most referring domains;
Do keyword research to re-optimize them for relevant topics with good search traffic potential.
Bryan Harris shared this "quick SEO win" during a course interview:
He suggested using Ahrefs' Site Explorer's "Best by links" report to find your site's most-linked pages and analyzing their search traffic. This finds pages with lots of links but little organic search traffic.
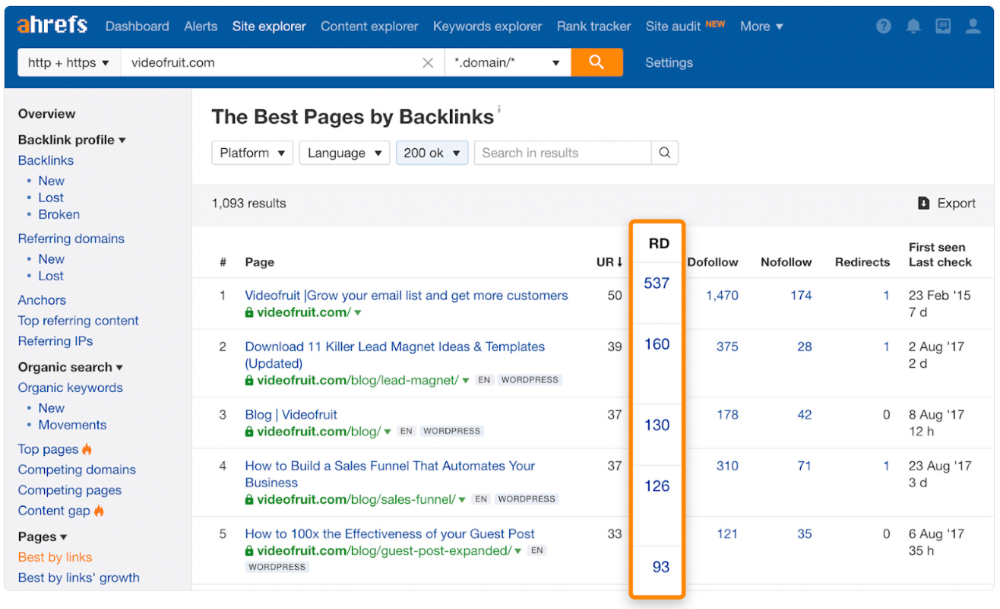
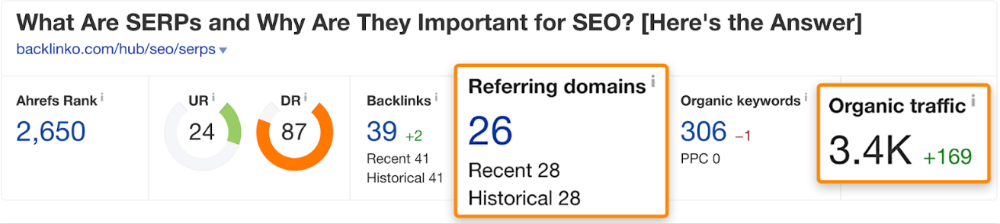
We see:
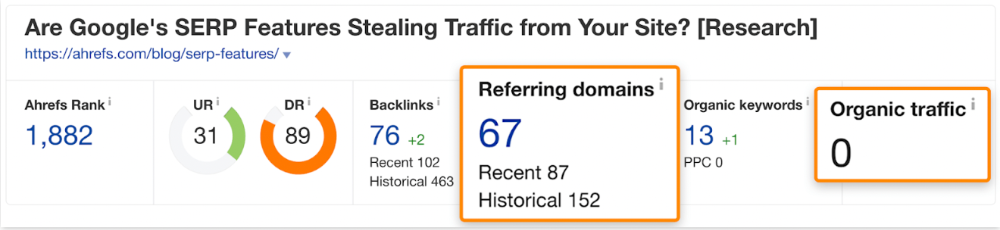
The guide has 67 backlinks but no organic traffic.
We could fix this by re-optimizing the page for "SERP"
A similar guide with 26 backlinks gets 3,400 monthly organic visits, so we should easily increase our traffic.
Don't do this with all low-traffic pages with backlinks. Choose your battles wisely; some pages shouldn't be ranked.
Reason #3: Search intent isn't met
Google returns the most relevant search results.
That's why blog posts with recommendations rank highest for "best yoga mat."
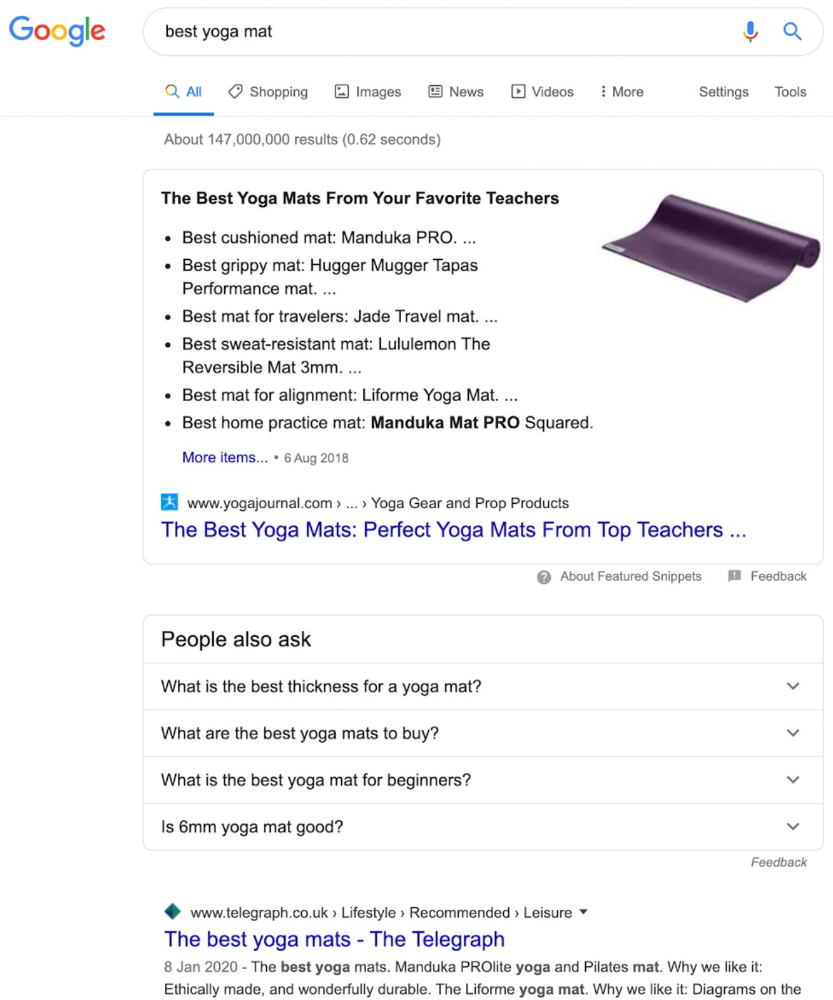
Google knows that most searchers aren't buying.
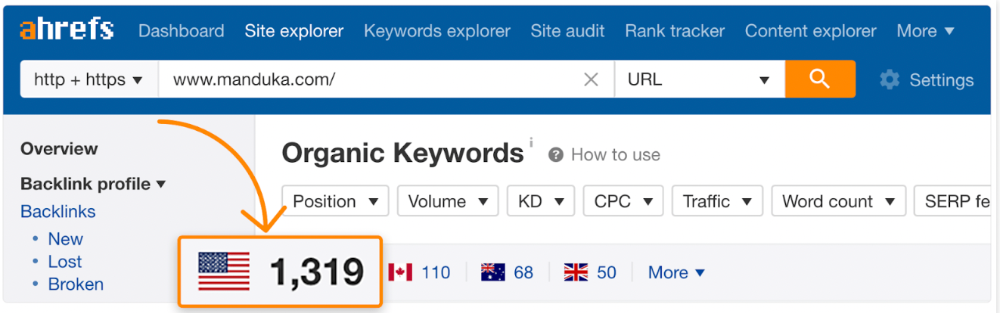
It's also why this yoga mats page doesn't rank, despite having seven times more backlinks than the top 10 pages:
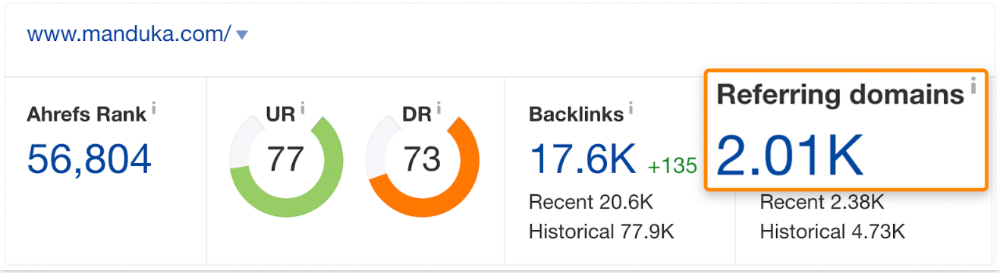
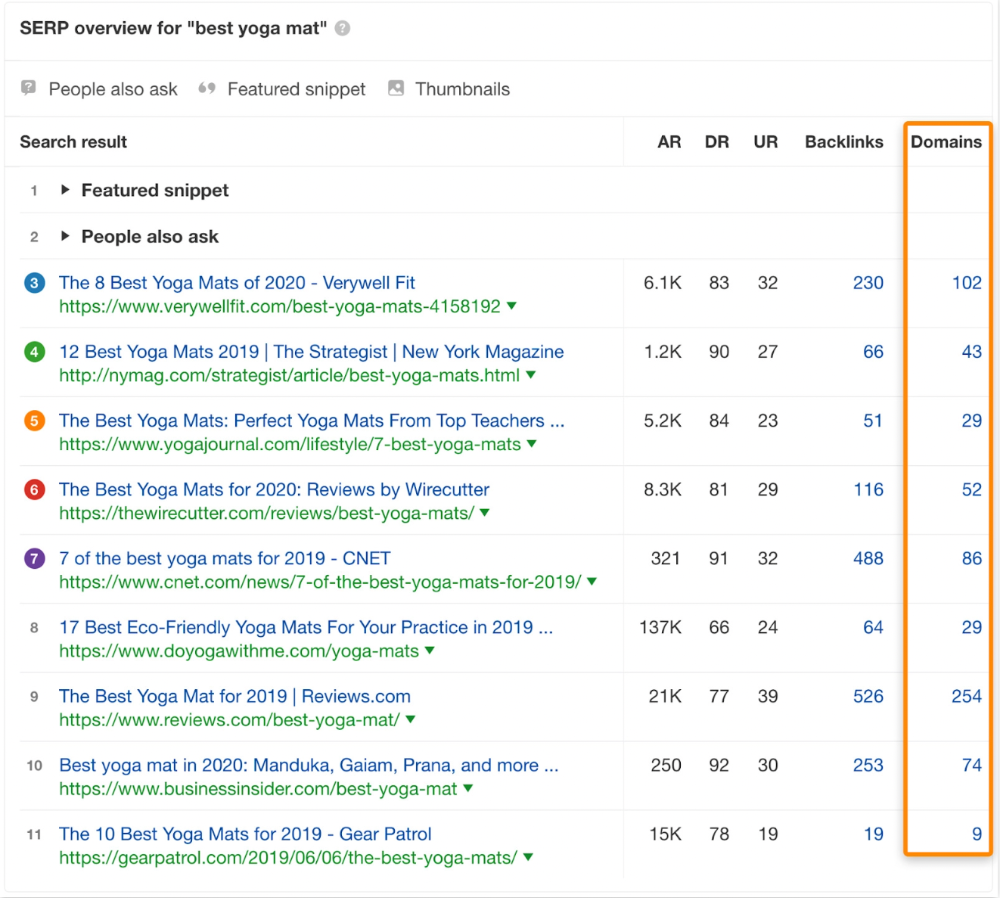
The page ranks for thousands of other keywords and gets tens of thousands of monthly organic visits. Not being the "best yoga mat" isn't a big deal.
If you have pages with lots of backlinks but no organic traffic, re-optimizing them for search intent can be a quick SEO win.
It was originally a boring landing page describing our product's benefits and offering a 7-day trial.
We realized the problem after analyzing search intent.
People wanted a free tool, not a landing page.
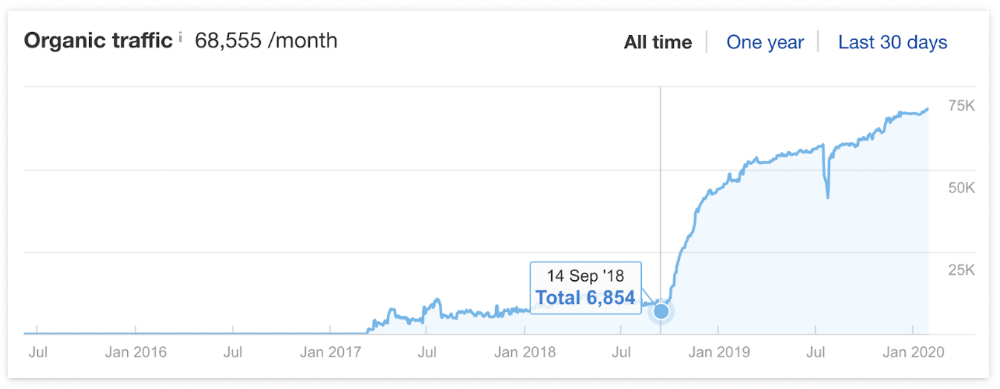
In September 2018, we published a free tool at the same URL. Organic traffic and rankings skyrocketed.
Reason #4: Unindexed page
Google can’t rank pages that aren’t indexed.
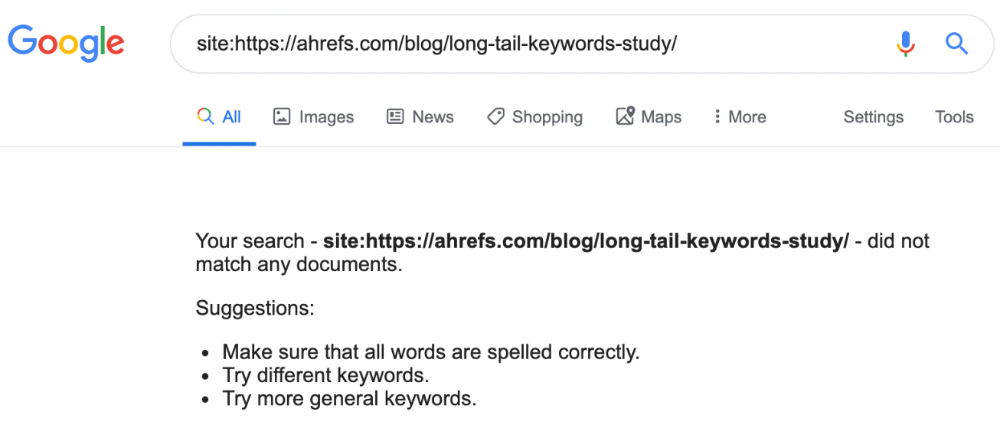
If you think this is the case, search Google for site:[url]. You should see at least one result; otherwise, it’s not indexed.
A rogue noindex meta tag is usually to blame. This tells search engines not to index a URL.
Rogue canonicals, redirects, and robots.txt blocks prevent indexing.
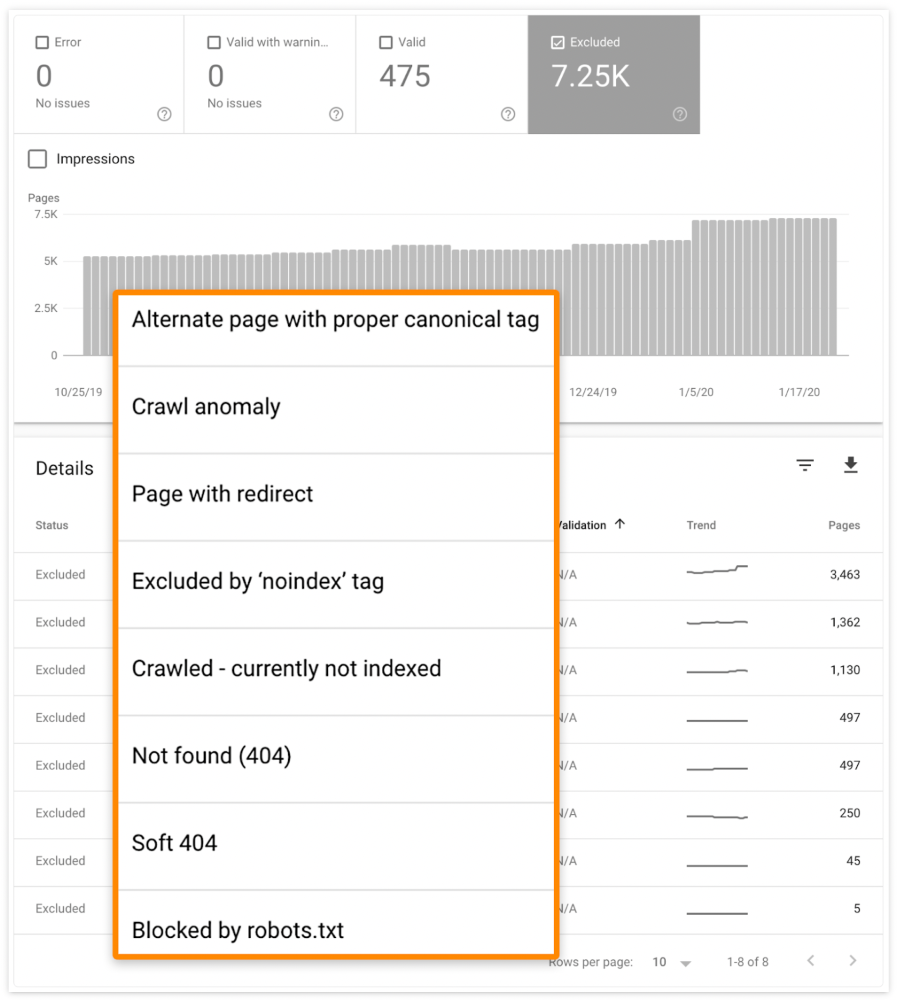
Check the "Excluded" tab in Google Search Console's "Coverage" report to see excluded pages.
Google doesn't index broken pages, even with backlinks.
Surprisingly common.
In Ahrefs' Site Explorer, the Best by Links report for a popular content marketing blog shows many broken pages.
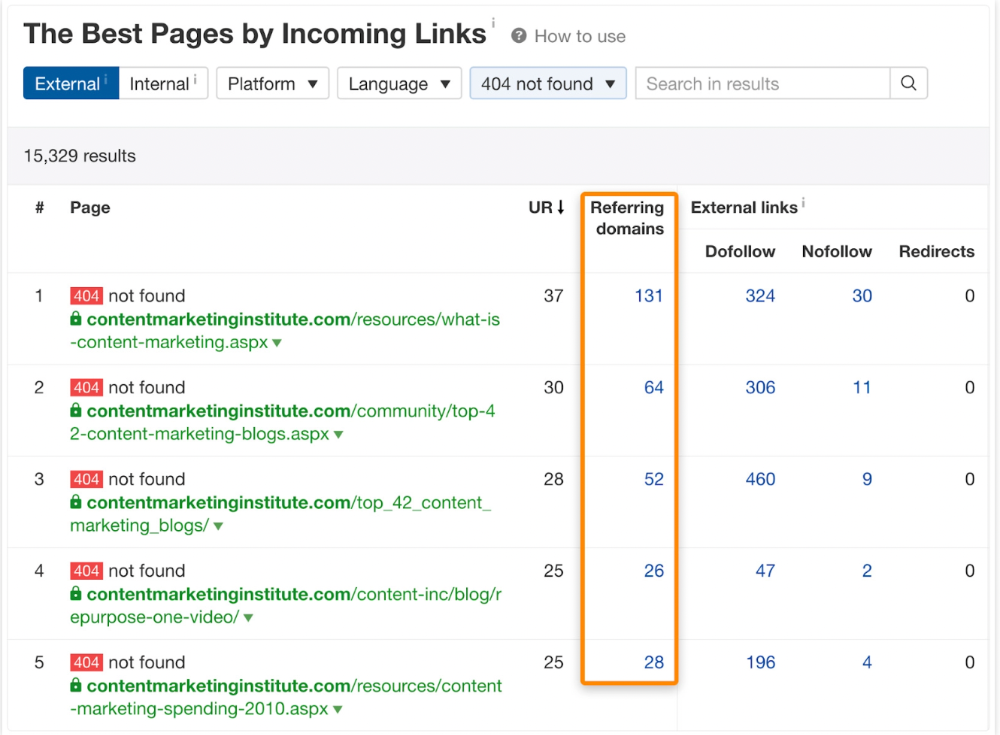
One dead page has 131 backlinks:
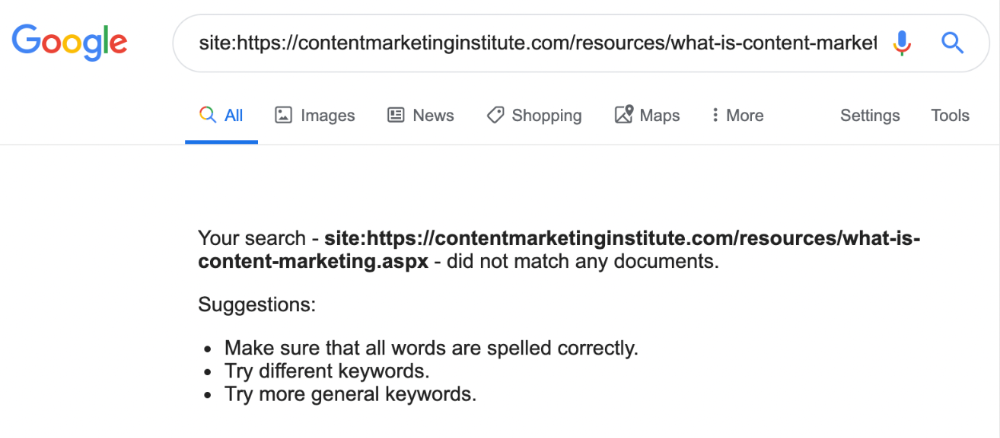
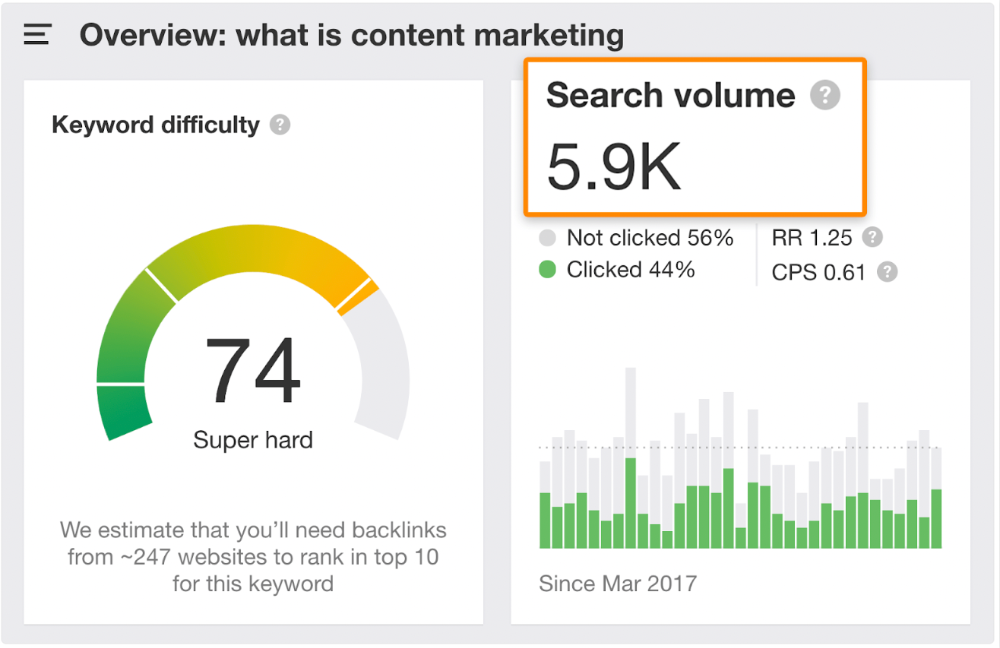
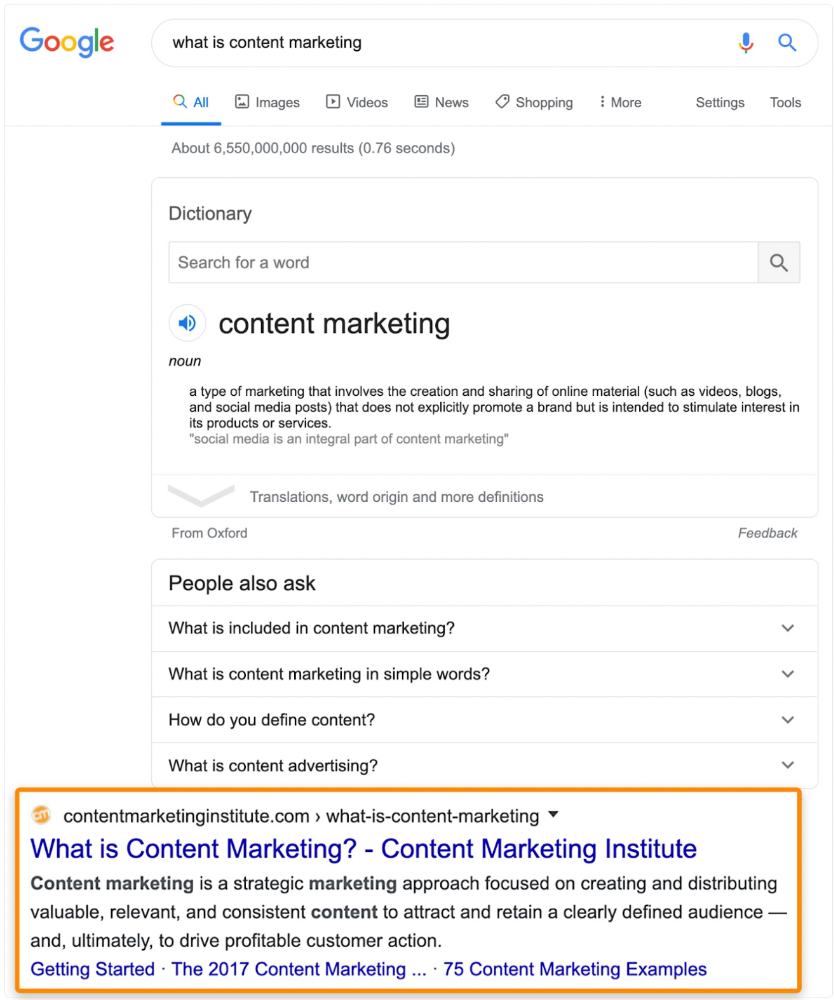
According to the URL, the page defined content marketing. —a keyword with a monthly search volume of 5,900 in the US.
Luckily, another page ranks for this keyword. Not a huge loss.
At least redirect the dead page's backlinks to a working page on the same topic. This may increase long-tail keyword traffic.
This post is a summary. See the original post here