


A Guide to VeeFriends and Series 2
VeeFriends is one of the most popular and unique NFT collections. VeeFriends launched around the same time as other PFP NFTs like Bored Ape Yacht Club.
Vaynerchuk (GaryVee) took a unique approach to his large-scale project, which has influenced the NFT ecosystem. GaryVee's VeeFriends is one of the most successful NFT membership use-cases, allowing him to build a community around his creative and business passions.
What is VeeFriends?
GaryVee's NFT collection, VeeFriends, was released on May 11, 2021. VeeFriends [Mini Drops], Book Games, and a forthcoming large-scale "Series 2" collection all stem from the initial drop of 10,255 tokens.
In "Series 1," there are G.O.O. tokens (Gary Originally Owned). GaryVee reserved 1,242 NFTs (over 12% of the supply) for his own collection, so only 9,013 were available at the Series 1 launch.
Each Series 1 token represents one of 268 human traits hand-drawn by Vaynerchuk. Gary Vee's NFTs offer owners incentives.
Who made VeeFriends?
Gary Vaynerchuk, AKA GaryVee, is influential in NFT. Vaynerchuk is the chairman of New York-based communications company VaynerX. Gary Vee, CEO of VaynerMedia, VaynerSports, and bestselling author, is worth $200 million.
GaryVee went from NFT collector to creator, launching VaynerNFT to help celebrities and brands.
Vaynerchuk's influence spans the NFT ecosystem as one of its most prolific voices. He's one of the most influential NFT figures, and his VeeFriends ecosystem keeps growing.
Vaynerchuk, a trend expert, thinks NFTs will be around for the rest of his life and VeeFriends will be a landmark project.
Why use VeeFriends NFTs?
The first VeeFriends collection has sold nearly $160 million via OpenSea. GaryVee insisted that the first 10,255 VeeFriends were just the beginning.
Book Games were announced to the VeeFriends community in August 2021. Mini Drops joined VeeFriends two months later.
Book Games
GaryVee's book "Twelve and a Half: Leveraging the Emotional Ingredients for Business Success" inspired Book Games. Even prior to the announcement Vaynerchuk had mapped out the utility of the book on an NFT scale. Book Games tied his book to the VeeFriends ecosystem and solidified its place in the collection.
GaryVee says Book Games is a layer 2 NFT project with 125,000 burnable tokens. Vaynerchuk's NFT fans were incentivized to buy as many copies of his new book as possible to receive NFT rewards later.
First, a bit about “layer 2.”
Layer 2 blockchain solutions help scale applications by routing transactions away from Ethereum Mainnet (layer 1). These solutions benefit from Mainnet's decentralized security model but increase transaction speed and reduce gas fees.
Polygon (integrated into OpenSea) and Immutable X are popular Ethereum layer 2 solutions. GaryVee chose Immutable X to reduce gas costs (transaction fees). Given the large supply of Book Games tokens, this decision will likely benefit the VeeFriends community, especially if the games run forever.
What's the strategy?
The VeeFriends patriarch announced on Aug. 27, 2021, that for every 12 books ordered during the Book Games promotion, customers would receive one NFT via airdrop. After nearly 100 days, GV sold over a million copies and announced that Book Games would go gamified on Jan. 10, 2022.
Immutable X's trading options make Book Games a "game." Book Games players can trade NFTs for other NFTs, sports cards, VeeCon tickets, and other prizes. Book Games can also whitelist other VeeFirends projects, which we'll cover in Series 2.
VeeFriends Mini Drops
GaryVee launched VeeFriends Mini Drops two months after Book Games, focusing on collaboration, scarcity, and the characters' "cultural longevity."
Spooky Vees, a collection of 31 1/1 Halloween-themed VeeFriends, was released on Halloween. First-come, first-served VeeFriend owners could claim these NFTs.
Mini Drops includes Gift Goat NFTs. By holding the Gift Goat VeeFriends character, collectors will receive 18 exclusive gifts curated by GaryVee and the team. Each gifting experience includes one physical gift and one NFT out of 555, to match the 555 Gift Goat tokens.
Gift Goat holders have gotten NFTs from Danny Cole (Creature World), Isaac "Drift" Wright (Where My Vans Go), Pop Wonder, and more.
GaryVee is poised to release the largest expansion of the VeeFriends and VaynerNFT ecosystem to date with VeeFriends Series 2.
VeeCon 101
By owning VeeFriends NFTs, collectors can join the VeeFriends community and attend VeeCon in 2022. The conference is only open to VeeCon NFT ticket holders (VeeFreinds + possibly more TBA) and will feature Beeple, Steve Aoki, and even Snoop Dogg.
The VeeFreinds floor in 2022 Q1 has remained at 16 ETH ($52,000), making VeeCon unattainable for most NFT enthusiasts. Why would someone spend that much crypto on a Minneapolis "superconference" ticket? Because of Gary Vaynerchuk.
Everything to know about VeeFriends Series 2
Vaynerchuk revealed in April 2022 that the VeeFriends ecosystem will grow by 55,555 NFTs after months of teasing.
With VeeFriends Series 2, each token will cost $995 USD in ETH, allowing NFT enthusiasts to join at a lower cost. The new series will be released on multiple dates in April.
Book Games NFT holders on the Friends List (whitelist) can mint Series 2 NFTs on April 12. Book Games holders have 32,000 NFTs.
VeeFriends Series 1 NFT holders can claim Series 2 NFTs on April 12. This allotment's supply is 10,255, like Series 1's.
On April 25, the public can buy 10,000 Series 2 NFTs. Unminted Friends List NFTs will be sold on this date, so this number may change.
The VeeFriends ecosystem will add 15 new characters (220 tokens each) on April 27. One character will be released per day for 15 days, and the only way to get one is to enter a daily raffle with Book Games tokens.
Series 2 NFTs won't give owners VeeCon access, but they will offer other benefits within the VaynerNFT ecosystem. Book Games and Series 2 will get new token burn mechanics in the upcoming drop.
Visit the VeeFriends blog for the latest collection info.
Where can you buy Gary Vee’s NFTs?
Need a VeeFriend NFT? Gary Vee recommends doing "50 hours of homework" before buying. OpenSea sells VeeFriends NFTs.
More on NFTs & Art

CyberPunkMetalHead
2 years ago
Why Bitcoin NFTs Are Incomprehensible yet Likely Here to Stay
I'm trying to understand why Bitcoin NFTs aren't ready.
Ordinals, a new Bitcoin protocol, has been controversial. NFTs can be added to Bitcoin transactions using the protocol. They are not tokens or fungible. Bitcoin NFTs are transaction metadata. Yes. They're not owned.
In January, the Ordinals protocol allowed data like photos to be directly encoded onto sats, the smallest units of Bitcoin worth 0.00000001 BTC, on the Bitcoin blockchain. Ordinals does not need a sidechain or token like other techniques. The Ordinals protocol has encoded JPEG photos, digital art, new profile picture (PFP) projects, and even 1993 DOOM onto the Bitcoin network.
Ordinals inscriptions are permanent digital artifacts preserved on the Bitcoin blockchain. It differs from Ethereum, Solana, and Stacks NFT technologies that allow smart contract creators to change information. Ordinals store the whole image or content on the blockchain, not just a link to an external server, unlike centralized databases, which can change the linked image, description, category, or contract identifier.
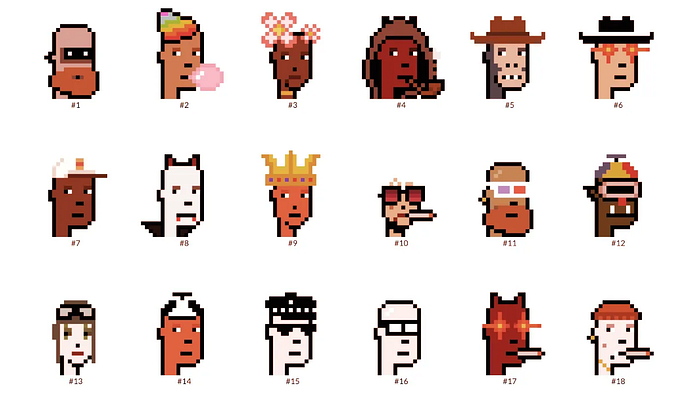
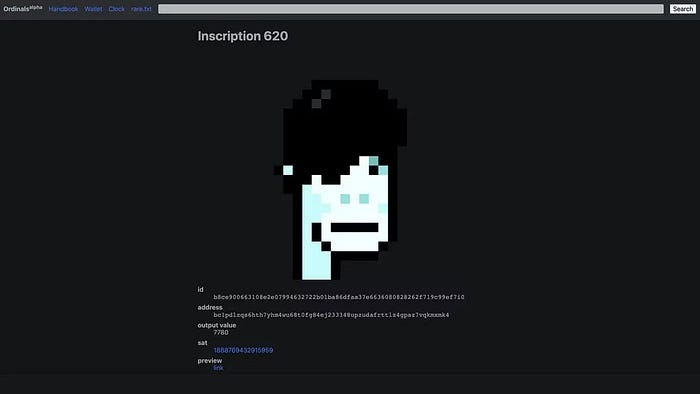
So far, more than 50,000 ordinals have been produced on the Bitcoin blockchain, and some of them have already been sold for astronomical amounts. The Ethereum-based CryptoPunks NFT collection spawned Ordinal Punk. Inscription 620 sold for 9.5 BTC, or $218,000, the most.
Segwit and Taproot, two important Bitcoin blockchain updates, enabled this. These protocols store transaction metadata, unlike Ethereum, where the NFT is the token. Bitcoin's NFT is a sat's transaction details.
What effects do ordinary values and NFTs have on the Bitcoin blockchain?
Ordinals will likely have long-term effects on the Bitcoin Ecosystem since they store, transact, and compute more data.
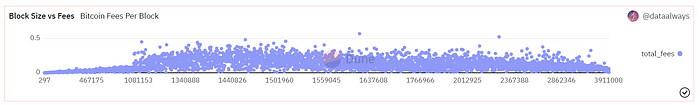
Charges Ordinals introduce scalability challenges. The Bitcoin network has limited transaction throughput and increased fees during peak demand. NFTs could make network transactions harder and more expensive. Ordinals currently occupy over 50% of block space, according to Glassnode.
One of the protocols that supported Ordinals Taproot has also seen a huge uptick:
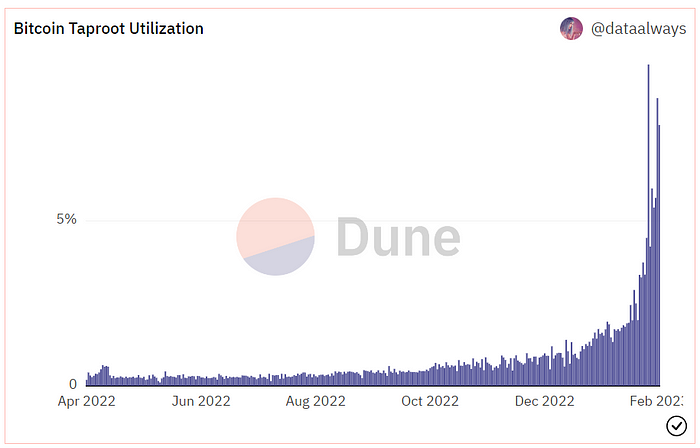
Taproot use increases block size and transaction costs.
This could cause network congestion but also support more L2s with Ordinals-specific use cases. Dune info here.
Storage Needs The Bitcoin blockchain would need to store more data to store NFT data directly. Since ordinals were introduced, blocksize has tripled from 0.7mb to over 2.2mb, which could increase storage costs and make it harder for nodes to join the network.
Use Case Diversity On the other hand, NFTs on the Bitcoin blockchain could broaden Bitcoin's use cases beyond storage and payment. This could expand Bitcoin's user base. This is two-sided. Bitcoin was designed to be trustless, decentralized, peer-to-peer money.
Chain to permanently store NFTs as ordinals will change everything.
Popularity rise This new use case will boost Bitcoin appeal, according to some. This argument fails since Bitcoin is the most popular cryptocurrency. Popularity doesn't require a new use case. Cryptocurrency adoption boosts Bitcoin. It need not compete with Ethereum or provide extra benefits to crypto investors. If there was a need for another chain that supports NFTs (there isn't), why would anyone choose the slowest and most expensive network? It appears contradictory and unproductive.
Nonetheless, holding an NFT on the Bitcoin blockchain is more secure than any other blockchain, but this has little utility.
Bitcoin NFTs are undoubtedly controversial. NFTs are strange and perhaps harmful to Bitcoin's mission. If Bitcoin NFTs are here to stay, I hope a sidechain or rollup solution will take over and leave the base chain alone.

Ezra Reguerra
3 years ago
Yuga Labs’ Otherdeeds NFT mint triggers backlash from community
Unhappy community members accuse Yuga Labs of fraud, manipulation, and favoritism over Otherdeeds NFT mint.
Following the Otherdeeds NFT mint, disgruntled community members took to Twitter to criticize Yuga Labs' handling of the event.
Otherdeeds NFTs were a huge hit with the community, selling out almost instantly. Due to high demand, the launch increased Ethereum gas fees from 2.6 ETH to 5 ETH.
But the event displeased many people. Several users speculated that the mint was “planned to fail” so the group could advertise launching its own blockchain, as the team mentioned a chain migration in one tweet.
Others like Mark Beylin tweeted that he had "sold out" on all Ape-related NFT investments after Yuga Labs "revealed their true colors." Beylin also advised others to assume Yuga Labs' owners are “bad actors.”
Some users who failed to complete transactions claim they lost ETH. However, Yuga Labs promised to refund lost gas fees.
CryptoFinally, a Twitter user, claimed Yuga Labs gave BAYC members better land than non-members. Others who wanted to participate paid for shittier land, while BAYCS got the only worthwhile land.
The Otherdeed NFT drop also increased Ethereum's burn rate. Glassnode and Data Always reported nearly 70,000 ETH burned on mint day.

xuanling11
3 years ago
Reddit NFT Achievement

Reddit's NFT market is alive and well.
NFT owners outnumber OpenSea on Reddit.
Reddit NFTs flip in OpenSea in days:
Fast-selling.
NFT sales will make Reddit's current communities more engaged.
I don't think NFTs will affect existing groups, but they will build hype for people to acquire them.
The first season of Collectibles is unique, but many missed the first season.
Second-season NFTs are less likely to be sold for a higher price than first-season ones.
If you use Reddit, it's fun to own NFTs.
You might also like

Glorin Santhosh
3 years ago
Start organizing your ideas by using The Second Brain.
Building A Second Brain helps us remember connections, ideas, inspirations, and insights. Using contemporary technologies and networks increases our intelligence.
This approach makes and preserves concepts. It's a straightforward, practical way to construct a second brain—a remote, centralized digital store for your knowledge and its sources.
How to build ‘The Second Brain’
Have you forgotten any brilliant ideas? What insights have you ignored?
We're pressured to read, listen, and watch informative content. Where did the data go? What happened?
Our brains can store few thoughts at once. Our brains aren't idea banks.
Building a Second Brain helps us remember thoughts, connections, and insights. Using digital technologies and networks expands our minds.
Ten Rules for Creating a Second Brain
1. Creative Stealing
Instead of starting from scratch, integrate other people's ideas with your own.
This way, you won't waste hours starting from scratch and can focus on achieving your goals.
Users of Notion can utilize and customize each other's templates.
2. The Habit of Capture
We must record every idea, concept, or piece of information that catches our attention since our minds are fragile.
When reading a book, listening to a podcast, or engaging in any other topic-related activity, save and use anything that resonates with you.
3. Recycle Your Ideas
Reusing our own ideas across projects might be advantageous since it helps us tie new information to what we already know and avoids us from starting a project with no ideas.
4. Projects Outside of Category
Instead of saving an idea in a folder, group it with documents for a project or activity.
If you want to be more productive, gather suggestions.
5. Burns Slowly
Even if you could finish a job, work, or activity if you focused on it, you shouldn't.
You'll get tired and can't advance many projects. It's easier to divide your routine into daily tasks.
Few hours of daily study is more productive and healthier than entire nights.
6. Begin with a surplus
Instead of starting with a blank sheet when tackling a new subject, utilise previous articles and research.
You may have read or saved related material.
7. Intermediate Packets
A bunch of essay facts.
You can utilize it as a document's section or paragraph for different tasks.
Memorize useful information so you can use it later.
8. You only know what you make
We can see, hear, and read about anything.
What matters is what we do with the information, whether that's summarizing it or writing about it.
9. Make it simpler for yourself in the future.
Create documents or files that your future self can easily understand. Use your own words, mind maps, or explanations.
10. Keep your thoughts flowing.
If you don't employ the knowledge in your second brain, it's useless.
Few people exercise despite knowing its benefits.
Conclusion:
You may continually move your activities and goals closer to completion by organizing and applying your information in a way that is results-focused.
Profit from the information economy's explosive growth by turning your specialized knowledge into cash.
Make up original patterns and linkages between topics.
You may reduce stress and information overload by appropriately curating and managing your personal information stream.
Learn how to apply your significant experience and specific knowledge to a new job, business, or profession.
Without having to adhere to tight, time-consuming constraints, accumulate a body of relevant knowledge and concepts over time.
Take advantage of all the learning materials that are at your disposal, including podcasts, online courses, webinars, books, and articles.

James White
3 years ago
Ray Dalio suggests reading these three books in 2022.
An inspiring reading list
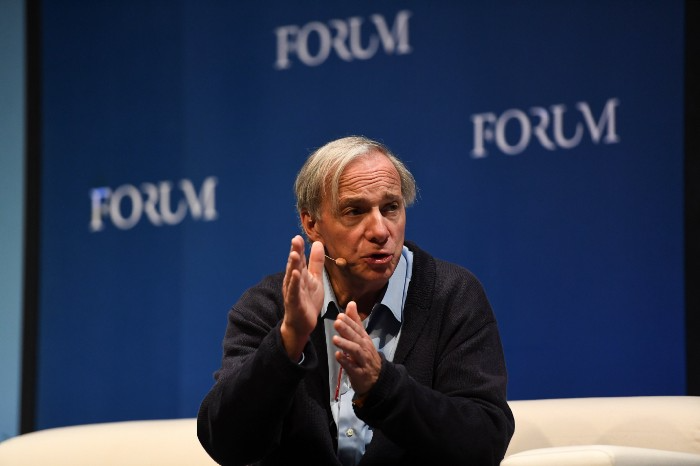
I'm no billionaire or hedge-fund manager. My bank account doesn't have millions. Ray Dalio's love of reading motivates me to think differently.
Here are some books recommended by Ray Dalio. Each influenced me. Hope they'll help you.
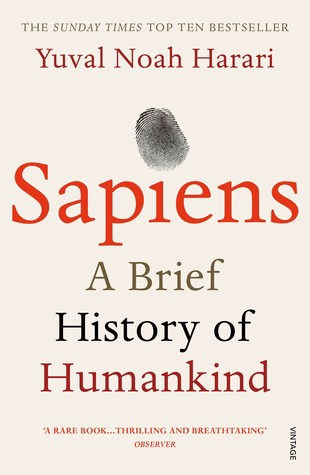
Sapiens by Yuval Noah Harari
Page Count: 512
Rating on Goodreads: 4.39
My favorite nonfiction book.
Sapiens explores human evolution. It explains how Homo Sapiens developed from hunter-gatherers to a dominant species. Amazing!
Sapiens will teach you about human history. Yuval Noah Harari has a follow-up book on human evolution.
My favorite book quotes are:
The tendency for luxuries to turn into necessities and give rise to new obligations is one of history's few unbreakable laws.
Happiness is not dependent on material wealth, physical health, or even community. Instead, it depends on how closely subjective expectations and objective circumstances align.
The romantic comparison between today's industry, which obliterates the environment, and our forefathers, who coexisted well with nature, is unfounded. Homo sapiens held the record among all organisms for eradicating the most plant and animal species even before the Industrial Revolution. The unfortunate distinction of being the most lethal species in the history of life belongs to us.
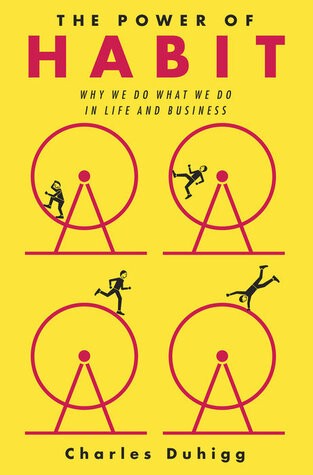
The Power Of Habit by Charles Duhigg
Page Count: 375
Rating on Goodreads: 4.13
Great book: The Power Of Habit. It illustrates why habits are everything. The book explains how healthier habits can improve your life, career, and society.
The Power of Habit rocks. It's a great book on productivity. Its suggestions helped me build healthier behaviors (and drop bad ones).
Read ASAP!
My favorite book quotes are:
Change may not occur quickly or without difficulty. However, almost any behavior may be changed with enough time and effort.
People who exercise begin to eat better and produce more at work. They are less smokers and are more patient with friends and family. They claim to feel less anxious and use their credit cards less frequently. A fundamental habit that sparks broad change is exercise.
Habits are strong but also delicate. They may develop independently of our awareness or may be purposefully created. They frequently happen without our consent, but they can be altered by changing their constituent pieces. They have a much greater influence on how we live than we realize; in fact, they are so powerful that they cause our brains to adhere to them above all else, including common sense.
Tribe Of Mentors by Tim Ferriss
Page Count: 561
Rating on Goodreads: 4.06
Unusual book structure. It's worth reading if you want to learn from successful people.
The book is Q&A-style. Tim questions everyone. Each chapter features a different person's life-changing advice. In the book, Pressfield, Willink, Grylls, and Ravikant are interviewed.
Amazing!
My favorite book quotes are:
According to one's courage, life can either get smaller or bigger.
Don't engage in actions that you are aware are immoral. The reputation you have with yourself is all that constitutes self-esteem. Always be aware.
People mistakenly believe that focusing means accepting the task at hand. However, that is in no way what it represents. It entails rejecting the numerous other worthwhile suggestions that exist. You must choose wisely. Actually, I'm just as proud of the things we haven't accomplished as I am of what I have. Saying no to 1,000 things is what innovation is.

Farhad Malik
3 years ago
How This Python Script Makes Me Money Every Day
Starting a passive income stream with data science and programming
My website is fresh. But how do I monetize it?
Creating a passive-income website is difficult. Advertise first. But what useful are ads without traffic?
Let’s Generate Traffic And Put Our Programming Skills To Use
SEO boosts traffic (Search Engine Optimisation). Traffic generation is complex. Keywords matter more than text, URL, photos, etc.
My Python skills helped here. I wanted to find relevant, Google-trending keywords (tags) for my topic.
First The Code
I wrote the script below here.
import re
from string import punctuation

import nltk
from nltk import TreebankWordTokenizer, sent_tokenize
from nltk.corpus import stopwords


class KeywordsGenerator:
    def __init__(self, pytrends):
        self._pytrends = pytrends

    def generate_tags(self, file_path, top_words=30):
        file_text = self._get_file_contents(file_path)
        clean_text = self._remove_noise(file_text)
        top_words = self._get_top_words(clean_text, top_words)
        suggestions = []
        for top_word in top_words:
            suggestions.extend(self.get_suggestions(top_word))
        suggestions.extend(top_words)
        tags = self._clean_tokens(suggestions)
        return ",".join(list(set(tags)))

    def _remove_noise(self, text):
        #1. Convert Text To Lowercase and remove numbers
        lower_case_text = str.lower(text)
        just_text = re.sub(r'\d+', '', lower_case_text)
        #2. Tokenise Paragraphs To words
        list = sent_tokenize(just_text)
        tokenizer = TreebankWordTokenizer()
        tokens = tokenizer.tokenize(just_text)
        #3. Clean text
        clean = self._clean_tokens(tokens)
        return clean

    def _clean_tokens(self, tokens):
        clean_words = [w for w in tokens if w not in punctuation]
        stopwords_to_remove = stopwords.words('english')
        clean = [w for w in clean_words if w not in stopwords_to_remove and not w.isnumeric()]
        return clean

    def get_suggestions(self, keyword):
        print(f'Searching pytrends for {keyword}')
        result = []
        self._pytrends.build_payload([keyword], cat=0, timeframe='today 12-m')
        data = self._pytrends.related_queries()[keyword]['top']
        if data is None or data.values is None:
            return result
        result.extend([x[0] for x in data.values.tolist()][:2])
        return result

    def _get_file_contents(self, file_path):
        return open(file_path, "r", encoding='utf-8',errors='ignore').read()

    def _get_top_words(self, words, top):
        counts = dict()

        for word in words:
            if word in counts:
                counts[word] += 1
            else:
                counts[word] = 1

        return list({k: v for k, v in sorted(counts.items(), key=lambda item: item[1])}.keys())[:top]


if __name__ == "1__main__":
    from pytrends.request import TrendReq

    nltk.download('punkt')
    nltk.download('stopwords')
    pytrends = TrendReq(hl='en-GB', tz=360)
    tags = KeywordsGenerator(pytrends)\
              .generate_tags('text_file.txt')
    print(tags)
Then The Dependencies
This script requires:
nltk==3.7
pytrends==4.8.0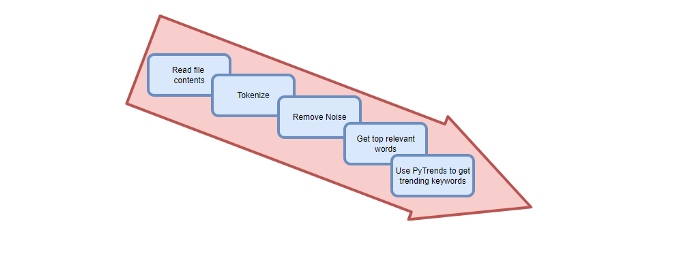
Analysis of the Script
I copy and paste my article into text file.txt, and the code returns the keywords as a comma-separated string.
To achieve this:
A class I made is called KeywordsGenerator.
This class has a function:
generate_tagsThe function
generate_tagsperforms the following tasks:
retrieves text file contents
uses NLP to clean the text by tokenizing sentences into words, removing punctuation, and other elements.
identifies the most frequent words that are relevant.
The
pytrendsAPI is then used to retrieve related phrases that are trending for each word from Google.finally adds a comma to the end of the word list.
4. I then use the keywords and paste them into the SEO area of my website.
These terms are trending on Google and relevant to my topic. My site's rankings and traffic have improved since I added new keywords. This little script puts our knowledge to work. I shared the script in case anyone faces similar issues.
I hope it helps readers sell their work.