


More on Technology

Enrique Dans
3 years ago
You may not know about The Merge, yet it could change society
Ethereum is the second-largest cryptocurrency. The Merge, a mid-September event that will convert Ethereum's consensus process from proof-of-work to proof-of-stake if all goes according to plan, will be a game changer.
Why is Ethereum ditching proof-of-work? Because it can. We're talking about a fully functioning, open-source ecosystem with a capacity for evolution that other cryptocurrencies lack, a change that would allow it to scale up its performance from 15 transactions per second to 100,000 as its blockchain is used for more and more things. It would reduce its energy consumption by 99.95%. Vitalik Buterin, the system's founder, would play a less active role due to decentralization, and miners, who validated transactions through proof of work, would be far less important.
Why has this conversion taken so long and been so cautious? Because it involves modifying a core process while it's running to boost its performance. It requires running the new mechanism in test chains on an ever-increasing scale, assessing participant reactions, and checking for issues or restrictions. The last big test was in early June and was successful. All that's left is to converge the mechanism with the Ethereum blockchain to conclude the switch.
What's stopping Bitcoin, the leader in market capitalization and the cryptocurrency that began blockchain's appeal, from doing the same? Satoshi Nakamoto, whoever he or she is, departed from public life long ago, therefore there's no community leadership. Changing it takes a level of consensus that is impossible to achieve without strong leadership, which is why Bitcoin's evolution has been sluggish and conservative, with few modifications.
Secondly, The Merge will balance the consensus mechanism (proof-of-work or proof-of-stake) and the system decentralization or centralization. Proof-of-work prevents double-spending, thus validators must buy hardware. The system works, but it requires a lot of electricity and, as it scales up, tends to re-centralize as validators acquire more hardware and the entire network activity gets focused in a few nodes. Larger operations save more money, which increases profitability and market share. This evolution runs opposed to the concept of decentralization, and some anticipate that any system that uses proof of work as a consensus mechanism will evolve towards centralization, with fewer large firms able to invest in efficient network nodes.
Yet radical bitcoin enthusiasts share an opposite argument. In proof-of-stake, transaction validators put their funds at stake to attest that transactions are valid. The algorithm chooses who validates each transaction, giving more possibilities to nodes that put more coins at stake, which could open the door to centralization and government control.
In both cases, we're talking about long-term changes, but Bitcoin's proof-of-work has been evolving longer and seems to confirm those fears, while proof-of-stake is only employed in coins with a minuscule volume compared to Ethereum and has no predictive value.
As of mid-September, we will have two significant cryptocurrencies, each with a different consensus mechanisms and equally different characteristics: one is intrinsically conservative and used only for economic transactions, while the other has been evolving in open source mode, and can be used for other types of assets, smart contracts, or decentralized finance systems. Some even see it as the foundation of Web3.
Many things could change before September 15, but The Merge is likely to be a turning point. We'll have to follow this closely.

Liz Martin
3 years ago
A Search Engine From Apple?
Apple's search engine has long been rumored. Recent Google developments may confirm the rumor. Is Apple about to become Google's biggest rival?
Here's a video:
People noted Apple's changes in 2020. AppleBot, a web crawler that downloads and caches Internet content, was more active than in the last five years.
Apple hired search engine developers, including ex-Googlers, such as John Giannandrea, Google's former search chief.
Apple also changed the way iPhones search. With iOS 14, Apple's search results arrived before Google's.
These facts fueled rumors that Apple was developing a search engine.
Apple and Google Have a Contract
Many skeptics said Apple couldn't compete with Google. This didn't affect the company's competitiveness.
Apple is the only business with the resources and scale to be a Google rival, with 1.8 billion active devices and a $2 trillion market cap.
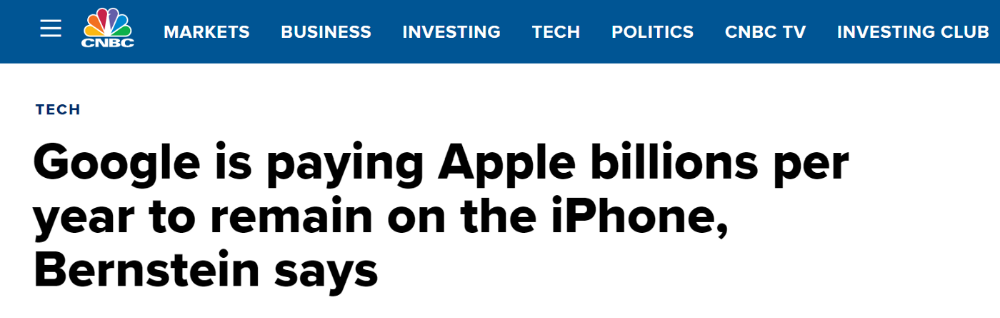
Still, people doubted that due to a license deal. Google pays Apple $8 to $12 billion annually to be the default iPhone and iPad search engine.
Apple can't build an independent search product under this arrangement.
Why would Apple enter search if it's being paid to stay out?
Ironically, this partnership has many people believing Apple is getting into search.
A New Default Search Engine May Be Needed
Google was sued for antitrust in 2020. It is accused of anticompetitive and exclusionary behavior. Justice wants to end Google's monopoly.
Authorities could restrict Apple and Google's licensing deal due to its likely effect on market competitiveness. Hence Apple needs a new default search engine.
Apple Already Has a Search Engine
The company already has a search engine, Spotlight.
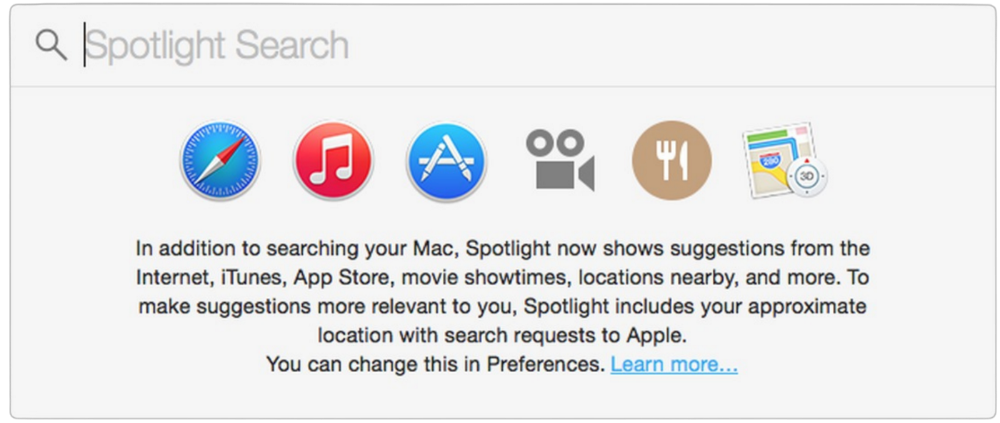
Since 2004, Spotlight has aired. It was developed to help users find photos, documents, apps, music, and system preferences.
Apple's search engine could do more than organize files, texts, and apps.
Spotlight Search was updated in 2014 with iOS 8. Web, App Store, and iTunes searches became available. You could find nearby places, movie showtimes, and news.
This search engine has subsequently been updated and improved. Spotlight added rich search results last year.
If you search for a TV show, movie, or song, photos and carousels will appear at the top of the page.
This resembles Google's rich search results.
When Will the Apple Search Engine Be Available?
When will Apple's search launch? Robert Scoble says it's near.
Scoble tweeted a number of hints before this year's Worldwide Developer Conference.
Scoble bases his prediction on insider information and deductive reasoning. January 2023 is expected.
Will you use Apple's search engine?

Paul DelSignore
2 years ago
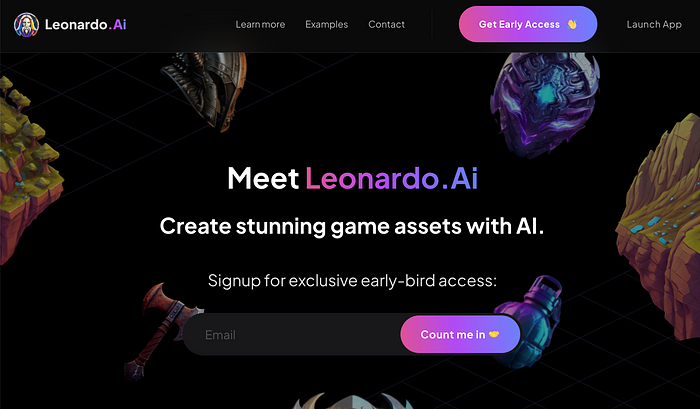
The stunning new free AI image tool is called Leonardo AI.
Leonardo—The New Midjourney?
Users are comparing the new cowboy to Midjourney.
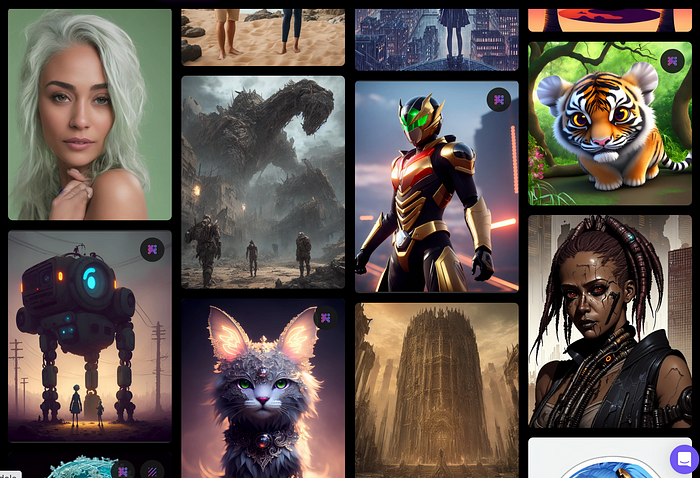
Leonardo.AI creates great photographs and has several unique capabilities I haven't seen in other AI image systems.
Midjourney's quality photographs are evident in the community feed.
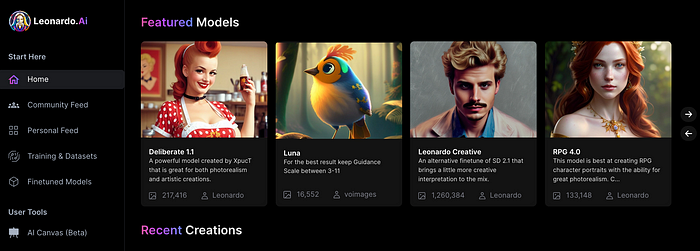
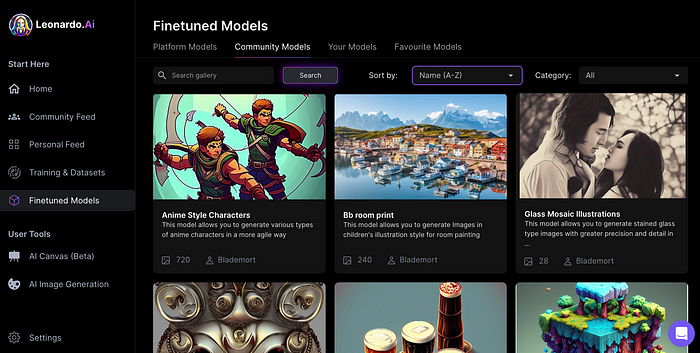
Create Pictures Using Models
You can make graphics using platform models when you first enter the app (website):
Luma, Leonardo creative, Deliberate 1.1.
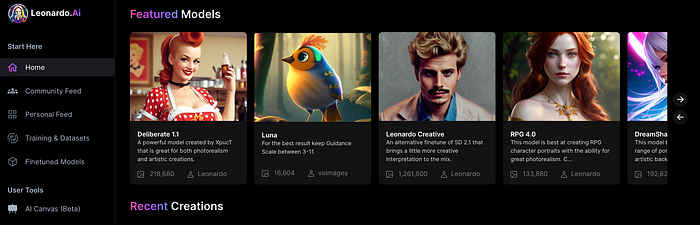
Clicking a model displays its description and samples:
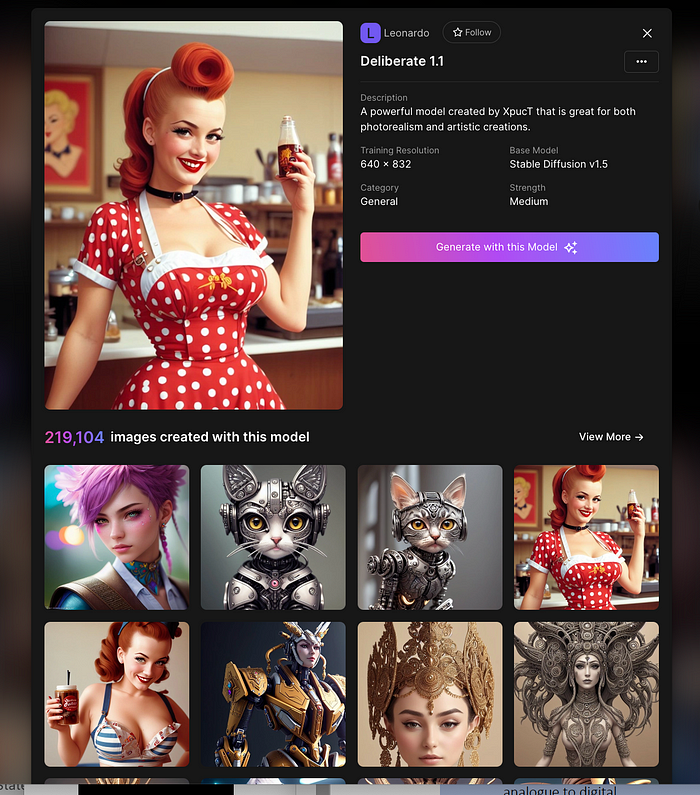
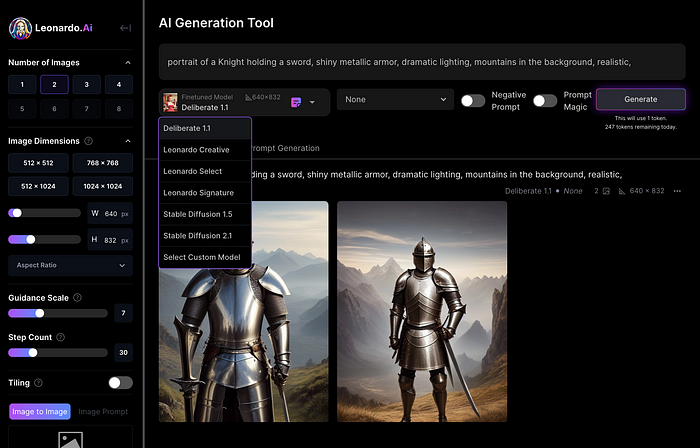
Click Generate With This Model.
Then you can add your prompt, alter models, photos, sizes, and guide scale in a sleek UI.
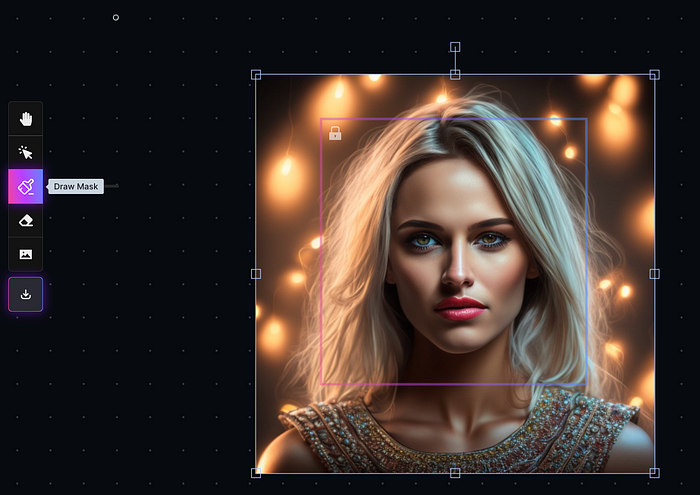
Changing Pictures
Leonardo's Canvas editor lets you change created images by hovering over them:

The editor opens with masking, erasing, and picture download.
Develop Your Own Models
I've never seen anything like Leonardo's model training feature.
Upload a handful of similar photographs and save them as a model for future images. Share your model with the community.
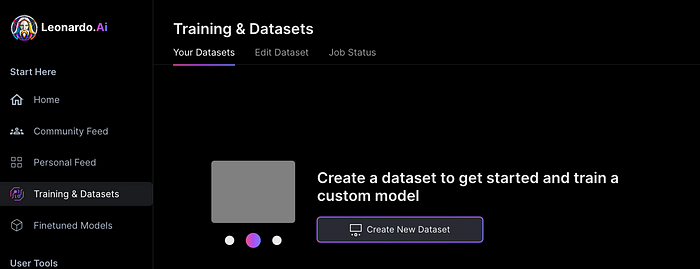
You can make photos using your own model and a community-shared set of fine-tuned models:
Obtain Leonardo access
Leonardo is currently free.
Visit Leonardo.ai and click "Get Early Access" to receive access.
Add your email to receive a link to join the discord channel. Simply describe yourself and fill out a form to join the discord channel.
Please go to 👑│introductions to make an introduction and ✨│priority-early-access will be unlocked, you must fill out a form and in 24 hours or a little more (due to demand), the invitation will be sent to you by email.
I got access in two hours, so hopefully you can too.
Last Words
I know there are many AI generative platforms, some free and some expensive, but Midjourney produces the most artistically stunning images and art.
Leonardo is the closest I've seen to Midjourney, but Midjourney is still the leader.
It's free now.
Leonardo's fine-tuned model selections, model creation, image manipulation, and output speed and quality make it a great AI image toolbox addition.
You might also like

Amelia Winger-Bearskin
3 years ago
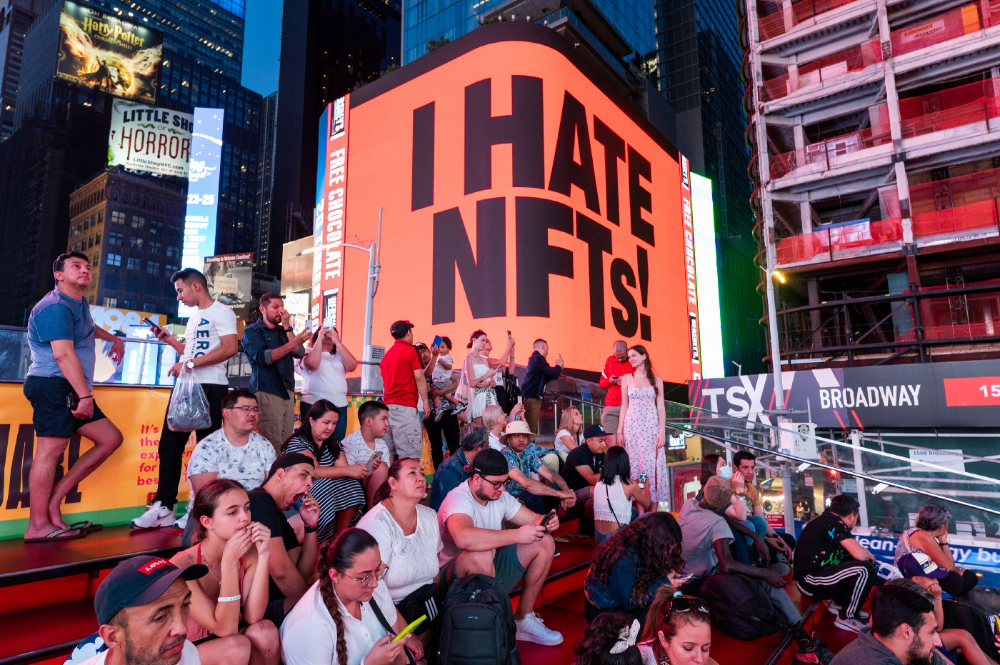
Hate NFTs? I must break some awful news to you...
If you think NFTs are awful, check out the art market.
The fervor around NFTs has subsided in recent months due to the crypto market crash and the media's short attention span. They were all anyone could talk about earlier this spring. Last semester, when passions were high and field luminaries were discussing "slurp juices," I asked my students and students from over 20 other universities what they thought of NFTs.
According to many, NFTs were either tasteless pyramid schemes or a new way for artists to make money. NFTs contributed to the climate crisis and harmed the environment, but so did air travel, fast fashion, and smartphones. Some students complained that NFTs were cheap, tasteless, algorithmically generated schlock, but others asked how this was different from other art.
I'm not sure what I expected, but the intensity of students' reactions surprised me. They had strong, emotional opinions about a technology I'd always considered administrative. NFTs address ownership and accounting, like most crypto/blockchain projects.
Art markets can be irrational, arbitrary, and subject to the same scams and schemes as any market. And maybe a few shenanigans that are unique to the art world.
The Fairness Question
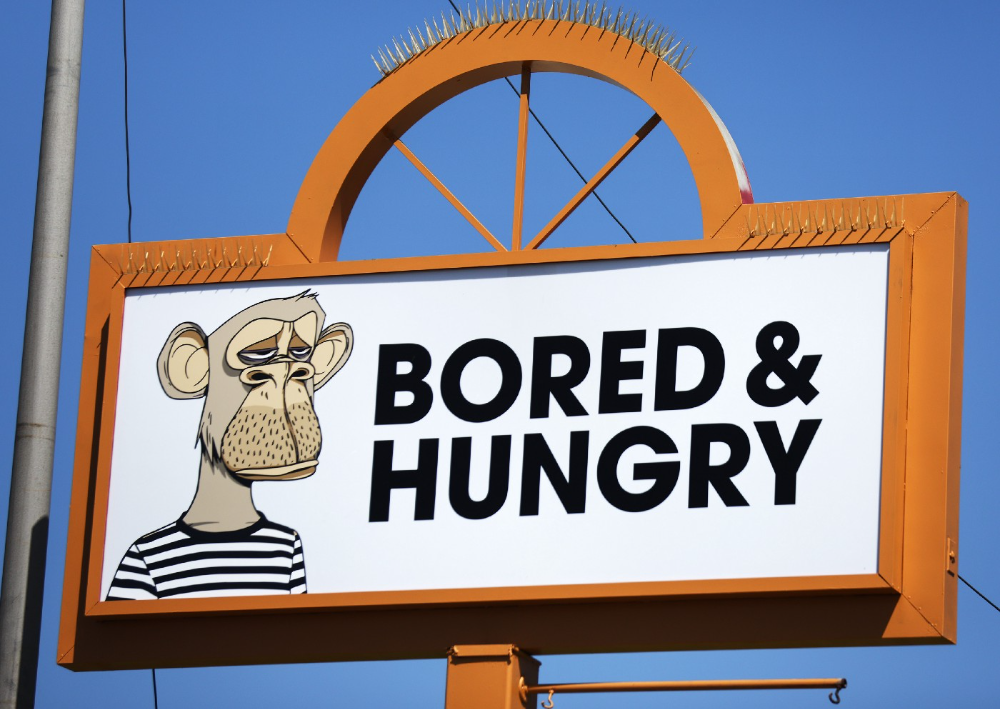
Fairness, a deflating moral currency, was the general sentiment (the less of it in circulation, the more ardently we clamor for it.) These students, almost all of whom are artists, complained to the mismatch between the quality of the work in some notable NFT collections and the excessive amounts these items were fetching on the market. They can sketch a Bored Ape or Lazy Lion in their sleep. Why should they buy ramen with school loans while certain swindlers get rich?
I understand students. Art markets are unjust. They can be irrational, arbitrary, and governed by chance and circumstance, like any market. And art-world shenanigans.
Almost every mainstream critique leveled against NFTs applies just as easily to art markets
Over 50% of artworks in circulation are fake, say experts. Sincere art collectors and institutions are upset by the prevalence of fake goods on the market. Not everyone. Wealthy people and companies use art as investments. They can use cultural institutions like museums and galleries to increase the value of inherited art collections. People sometimes buy artworks and use family ties or connections to museums or other cultural taste-makers to hype the work in their collection, driving up the price and allowing them to sell for a profit. Money launderers can disguise capital flows by using market whims, hype, and fluctuating asset prices.
Almost every mainstream critique leveled against NFTs applies just as easily to art markets.
Art has always been this way. Edward Kienholz's 1989 print series satirized art markets. He stamped 395 identical pieces of paper from $1 to $395. Each piece was initially priced as indicated. Kienholz was joking about a strange feature of art markets: once the last print in a series sells for $395, all previous works are worth at least that much. The entire series is valued at its highest auction price. I don't know what a Kienholz print sells for today (inquire with the gallery), but it's more than $395.
I love Lee Lozano's 1969 "Real Money Piece." Lozano put cash in various denominations in a jar in her apartment and gave it to visitors. She wrote, "Offer guests coffee, diet pepsi, bourbon, half-and-half, ice water, grass, and money." "Offer real money as candy."
Lee Lozano kept track of who she gave money to, how much they took, if any, and how they reacted to the offer of free money without explanation. Diverse reactions. Some found it funny, others found it strange, and others didn't care. Lozano rarely says:
Apr 17 Keith Sonnier refused, later screws lid very tightly back on. Apr 27 Kaltenbach takes all the money out of the jar when I offer it, examines all the money & puts it all back in jar. Says he doesn’t need money now. Apr 28 David Parson refused, laughing. May 1 Warren C. Ingersoll refused. He got very upset about my “attitude towards money.” May 4 Keith Sonnier refused, but said he would take money if he needed it which he might in the near future. May 7 Dick Anderson barely glances at the money when I stick it under his nose and says “Oh no thanks, I intend to earn it on my own.” May 8 Billy Bryant Copley didn’t take any but then it was sort of spoiled because I had told him about this piece on the phone & he had time to think about it he said.
Smart Contracts (smart as in fair, not smart as in Blockchain)
Cornell University's Cheryl Finley has done a lot of research on secondary art markets. I first learned about her research when I met her at the University of Florida's Harn Museum, where she spoke about smart contracts (smart as in fair, not smart as in Blockchain) and new protocols that could help artists who are often left out of the economic benefits of their own work, including women and women of color.

Her talk included findings from her ArtNet op-ed with Lauren van Haaften-Schick, Christian Reeder, and Amy Whitaker.
NFTs allow us to think about and hack on formal contractual relationships outside a system of laws that is currently not set up to service our community.
The ArtNet article The Recent Sale of Amy Sherald's ‘Welfare Queen' Symbolizes the Urgent Need for Resale Royalties and Economic Equity for Artists discussed Sherald's 2012 portrait of a regal woman in a purple dress wearing a sparkling crown and elegant set of pearls against a vibrant red background.
Amy Sherald sold "Welfare Queen" to Princeton professor Imani Perry. Sherald agreed to a payment plan to accommodate Perry's budget.
Amy Sherald rose to fame for her 2016 portrait of Michelle Obama and her full-length portrait of Breonna Taylor, one of the most famous works of the past decade.
As is common, Sherald's rising star drove up the price of her earlier works. Perry's "Welfare Queen" sold for $3.9 million in 2021.
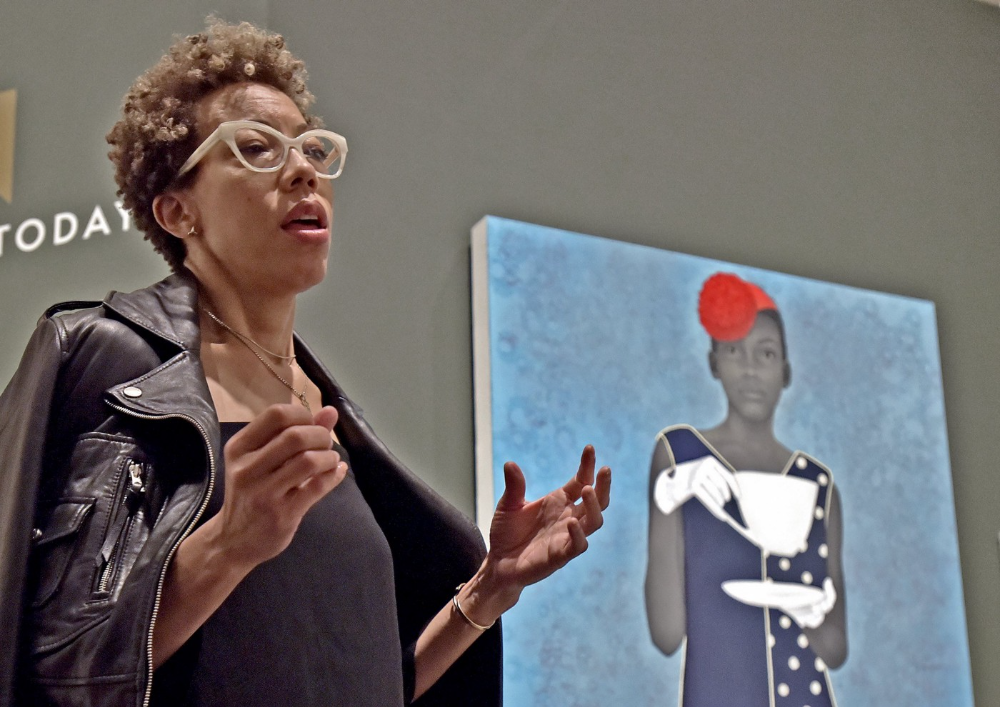
Imani Perry's early investment paid off big-time. Amy Sherald, whose work directly increased the painting's value and who was on an artist's shoestring budget when she agreed to sell "Welfare Queen" in 2012, did not see any of the 2021 auction money. Perry and the auction house got that money.
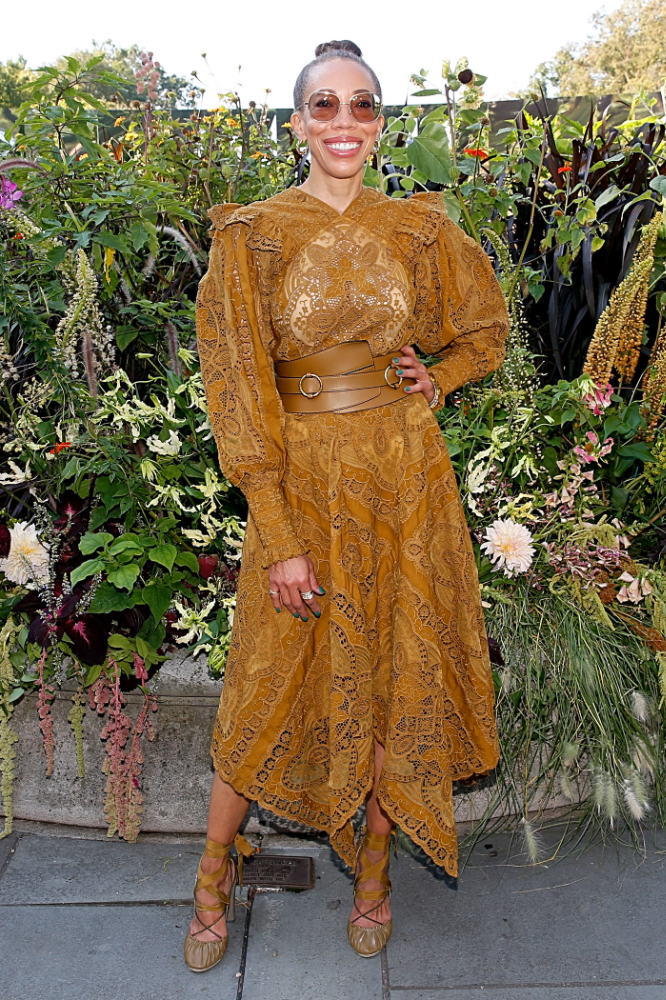
Sherald sold her Breonna Taylor portrait to the Smithsonian and Louisville's Speed Art Museum to fund a $1 million scholarship. This is a great example of what an artist can do for the community if they can amass wealth through their work.
NFTs haven't solved all of the art market's problems — fakes, money laundering, market manipulation — but they didn't create them. Blockchain and NFTs are credited with making these issues more transparent. More ideas emerge daily about what a smart contract should do for artists.
NFTs are a copyright solution. They allow us to hack formal contractual relationships outside a law system that doesn't serve our community.
Amy Sherald shows the good smart contracts can do (as in, well-considered, self-determined contracts, not necessarily blockchain contracts.) Giving back to our community, deciding where and how our work can be sold or displayed, and ensuring artists share in the equity of our work and the economy our labor creates.

The woman
3 years ago
The renowned and highest-paid Google software engineer
His story will inspire you.
“Google search went down for a few hours in 2002; Jeff Dean handled all the queries by hand and checked quality doubled.”- Jeff Dean Facts.
One of many Jeff Dean jokes, but you get the idea.
Google's top six engineers met in a war room in mid-2000. Google's crawling system, which indexed the Web, stopped working. Users could still enter queries, but results were five months old.
Google just signed a deal with Yahoo to power a ten-times-larger search engine. Tension rose. It was crucial. If they failed, the Yahoo agreement would likely fall through, risking bankruptcy for the firm. Their efforts could be lost.
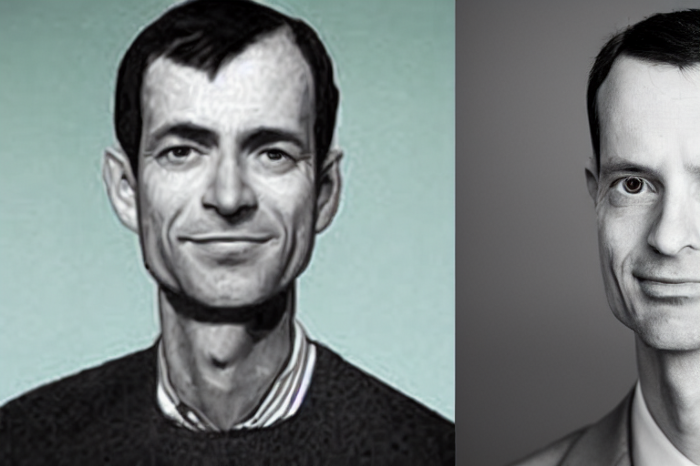
A rangy, tall, energetic thirty-one-year-old man named Jeff dean was among those six brilliant engineers in the makeshift room. He had just left D. E. C. a couple of months ago and started his career in a relatively new firm Google, which was about to change the world. He rolled his chair over his colleague Sanjay and sat right next to him, cajoling his code like a movie director. The history started from there.
When you think of people who shaped the World Wide Web, you probably picture founders and CEOs like Larry Page and Sergey Brin, Marc Andreesen, Tim Berners-Lee, Bill Gates, and Mark Zuckerberg. They’re undoubtedly the brightest people on earth.
Under these giants, legions of anonymous coders work at keyboards to create the systems and products we use. These computer workers are irreplaceable.
Let's get to know him better.
It's possible you've never heard of Jeff Dean. He's American. Dean created many behind-the-scenes Google products. Jeff, co-founder and head of Google's deep learning research engineering team, is a popular technology, innovation, and AI keynote speaker.
While earning an MS and Ph.D. in computer science at the University of Washington, he was a teaching assistant, instructor, and research assistant. Dean joined the Compaq Computer Corporation Western Research Laboratory research team after graduating.
Jeff co-created ProfileMe and the Continuous Profiling Infrastructure for Digital at Compaq. He co-designed and implemented Swift, one of the fastest Java implementations. He was a senior technical staff member at mySimon Inc., retrieving and caching electronic commerce content.
Dean, a top young computer scientist, joined Google in mid-1999. He was always trying to maximize a computer's potential as a child.
An expert
His high school program for processing massive epidemiological data was 26 times faster than professionals'. Epi Info, in 13 languages, is used by the CDC. He worked on compilers as a computer science Ph.D. These apps make source code computer-readable.
Dean never wanted to work on compilers forever. He left Academia for Google, which had less than 20 employees. Dean helped found Google News and AdSense, which transformed the internet economy. He then addressed Google's biggest issue, scaling.
Growing Google faced a huge computing challenge. They developed PageRank in the late 1990s to return the most relevant search results. Google's popularity slowed machine deployment.
Dean solved problems, his specialty. He and fellow great programmer Sanjay Ghemawat created the Google File System, which distributed large data over thousands of cheap machines.
These two also created MapReduce, which let programmers handle massive data quantities on parallel machines. They could also add calculations to the search algorithm. A 2004 research article explained MapReduce, which became an industry sensation.
Several revolutionary inventions
Dean's other initiatives were also game-changers. BigTable, a petabyte-capable distributed data storage system, was based on Google File. The first global database, Spanner, stores data on millions of servers in dozens of data centers worldwide.
It underpins Gmail and AdWords. Google Translate co-founder Jeff Dean is surprising. He contributes heavily to Google News. Dean is Senior Fellow of Google Research and Health and leads Google AI.
Recognitions
The National Academy of Engineering elected Dean in 2009. He received the 2009 Association for Computing Machinery fellowship and the 2016 American Academy of Arts and Science fellowship. He received the 2007 ACM-SIGOPS Mark Weiser Award and the 2012 ACM-Infosys Foundation Award. Lists could continue.
A sneaky question may arrive in your mind: How much does this big brain earn? Well, most believe he is one of the highest-paid employees at Google. According to a survey, he is paid $3 million a year.
He makes espresso and chats with a small group of Googlers most mornings. Dean steams milk, another grinds, and another brews espresso. They discuss families and technology while making coffee. He thinks this little collaboration and idea-sharing keeps Google going.
“Some of us have been working together for more than 15 years,” Dean said. “We estimate that we’ve collectively made more than 20,000 cappuccinos together.”
We all know great developers and software engineers. It may inspire many.

Greg Lim
3 years ago
How I made $160,000 from non-fiction books
I've sold over 40,000 non-fiction books on Amazon and made over $160,000 in six years while writing on the side.
I have a full-time job and three young sons; I can't spend 40 hours a week writing. This article describes my journey.
I write mainly tech books:
Thanks to my readers, many wrote positive evaluations. Several are bestsellers.
A few have been adopted by universities as textbooks:
My books' passive income allows me more time with my family.
Knowing I could quit my job and write full time gave me more confidence. And I find purpose in my work (i am in christian ministry).
I'm always eager to write. When work is a dread or something bad happens, writing gives me energy. Writing isn't scary. In fact, I can’t stop myself from writing!
Writing has also established my tech authority. Universities use my books, as I've said. Traditional publishers have asked me to write books.
These mindsets helped me become a successful nonfiction author:
1. You don’t have to be an Authority
Yes, I have computer science experience. But I'm no expert on my topics. Before authoring "Beginning Node.js, Express & MongoDB," my most profitable book, I had no experience with those topics. Node was a new server-side technology for me. Would that stop me from writing a book? It can. I liked learning a new technology. So I read the top three Node books, took the top online courses, and put them into my own book (which makes me know more than 90 percent of people already).
I didn't have to worry about using too much jargon because I was learning as I wrote. An expert forgets a beginner's hardship.
"The fellow learner can aid more than the master since he knows less," says C.S. Lewis. The problem he must explain is recent. The expert has forgotten.”
2. Solve a micro-problem (Niching down)
I didn't set out to write a definitive handbook. I found a market with several challenges and wrote one book. Ex:
- Instead of web development, what about web development using Angular?
- Instead of Blockchain, what about Blockchain using Solidity and React?
- Instead of cooking recipes, how about a recipe for a specific kind of diet?
- Instead of Learning math, what about Learning Singapore Math?
3. Piggy Backing Trends
The above topics may still be a competitive market. E.g. Angular, React. To stand out, include the latest technologies or trends in your book. Learn iOS 15 instead of iOS programming. Instead of personal finance, what about personal finance with NFTs.
Even though you're a newbie author, your topic is well-known.
4. Publish short books
My books are known for being direct. Many people like this:
Your reader will appreciate you cutting out the fluff and getting to the good stuff. A reader can finish and review your book.
Second, short books are easier to write. Instead of creating a 500-page book for $50 (which few will buy), write a 100-page book that answers a subset of the problem and sell it for less. (You make less, but that's another subject). At least it got published instead of languishing. Less time spent creating a book means less time wasted if it fails. Write a small-bets book portfolio like Daniel Vassallo!
Third, it's $2.99-$9.99 on Amazon (gets 70 percent royalties for ebooks). Anything less receives 35% royalties. $9.99 books have 20,000–30,000 words. If you write more and charge more over $9.99, you get 35% royalties. Why not make it a $9.99 book?
(This is the ebook version.) Paperbacks cost more. Higher royalties allow for higher prices.
5. Validate book idea
Amazon will tell you if your book concept, title, and related phrases are popular. See? Check its best-sellers list.
150,000 is preferable. It sells 2–3 copies daily. Consider your rivals. Profitable niches have high demand and low competition.
Don't be afraid of competitive niches. First, it shows high demand. Secondly, what are the ways you can undercut the completion? Better book? Or cheaper option? There was lots of competition in my NodeJS book's area. None received 4.5 stars or more. I wrote a NodeJS book. Today, it's a best-selling Node book.
What’s Next
So long. Part II follows. Meanwhile, I will continue to write more books!
Follow my journey on Twitter.
This post is a summary. Read full article here