


Pixelmon NFTs are so bad, they are almost good!
Bored Apes prices continue to rise, HAPEBEAST launches, Invisible Friends hype continues to grow. Sadly, not all projects are as successful.
Of course, there are many factors to consider when buying an NFT. Is the project a scam? Will the reveal derail the project? Possibly, but when Pixelmon first teased its launch, it generated a lot of buzz.
With a primary sale mint price of 3 ETH ($8,100 USD), it started as an expensive project, with plenty of fans willing to invest in what was sold as a game. After it was revealed, it fell rapidly.
Why? It was overpromised and under delivered.
According to the project's creator[^1], the funds generated will be used to develop the artwork. "The Pixelmon reveal was wrong. This is what our Pixelmon look like in-game. "Despite the fud, I will not go anywhere," he wrote on Twitter. The goal remains. The funds will still be used to build our game. I will finish this project."
The project raised $70 million USD, but the NFTs buyers received were not the project's original teasers. Some call it "the worst NFT project ever," while others call it a complete scam.
But there's hope for some buyers. Kevin emerged from the ashes as the project was roasted over the fire.
A Minecraft character meets Salad Fingers - that's Kevin. He's a frog-like creature whose reveal was such a terrible NFT that it became part of history – and a meme.
If you're laughing at people paying $8K for a silly pixelated image, you might need to take it back. Precisely because of this, lucky holders who minted Kevin have been able to sell the now-memed NFT for over 8 ETH (around $24,000 USD), with some currently listed for 100 ETH.
Of course, Twitter has been awash in memes mocking those who invested in the project, because what else can you do when so many people lose money?
It's still unclear if the NFT project is a scam, but the team behind it was hired on Upwork. There's still hope for redemption, but Kevin's rise to fame appears to be the only positive outcome so far.
[^1] This is not the first time the creator (A 20-yo New Zealanders) has sought money via an online platform and had people claiming he under-delivered. He raised $74,000 on Kickstarter for a card game called Psycho Chicken. There are hundreds of comments on the Kickstarter project saying they haven't received the product and pleading for a refund or an update.
More on NFTs & Art

Ezra Reguerra
3 years ago
Yuga Labs’ Otherdeeds NFT mint triggers backlash from community
Unhappy community members accuse Yuga Labs of fraud, manipulation, and favoritism over Otherdeeds NFT mint.
Following the Otherdeeds NFT mint, disgruntled community members took to Twitter to criticize Yuga Labs' handling of the event.
Otherdeeds NFTs were a huge hit with the community, selling out almost instantly. Due to high demand, the launch increased Ethereum gas fees from 2.6 ETH to 5 ETH.
But the event displeased many people. Several users speculated that the mint was “planned to fail” so the group could advertise launching its own blockchain, as the team mentioned a chain migration in one tweet.
Others like Mark Beylin tweeted that he had "sold out" on all Ape-related NFT investments after Yuga Labs "revealed their true colors." Beylin also advised others to assume Yuga Labs' owners are “bad actors.”
Some users who failed to complete transactions claim they lost ETH. However, Yuga Labs promised to refund lost gas fees.
CryptoFinally, a Twitter user, claimed Yuga Labs gave BAYC members better land than non-members. Others who wanted to participate paid for shittier land, while BAYCS got the only worthwhile land.
The Otherdeed NFT drop also increased Ethereum's burn rate. Glassnode and Data Always reported nearly 70,000 ETH burned on mint day.

Jayden Levitt
3 years ago
How to Explain NFTs to Your Grandmother, in Simple Terms

In simple terms, you probably don’t.
But try. Grandma didn't grow up with Facebook, but she eventually joined.
Perhaps the fear of being isolated outweighed the discomfort of learning the technology.
Grandmas are Facebook likers, sharers, and commenters.
There’s no stopping her.
Not even NFTs. Web3 is currently very complex.
It's difficult to explain what NFTs are, how they work, and why we might use them.
Three explanations.
1. Everything will be ours to own, both physically and digitally.
Why own something you can't touch? What's the point?
Blockchain technology proves digital ownership.
Untouchables need ownership proof. What?
Digital assets reduce friction, save time, and are better for the environment than physical goods.
Many valuable things are intangible. Feeling like your favorite brands. You'll pay obscene prices for clothing that costs pennies.
Secondly, NFTs Are Contracts. Agreements Have Value.
Blockchain technology will replace all contracts and intermediaries.
Every insurance contract, deed, marriage certificate, work contract, plane ticket, concert ticket, or sports event is likely an NFT.
We all have public wallets, like Grandma's Facebook page.
3. Your NFT Purchases Will Be Visible To Everyone.
Everyone can see your public wallet. What you buy says more about you than what you post online.
NFTs issued double as marketing collateral when seen on social media.
While I doubt Grandma knows who Snoop Dog is, imagine him or another famous person holding your NFT in his public wallet and the attention that could bring to you, your company, or brand.
This Technical Section Is For You
The NFT is a contract; its founders can add value through access, events, tuition, and possibly royalties.
Imagine Elon Musk releasing an NFT to his network. Or yearly business consultations for three years.
Christ-alive.
It's worth millions.
These determine their value.
No unsuspecting schmuck willing to buy your hot potato at zero. That's the trend, though.
Overpriced NFTs for low-effort projects created a bubble that has burst.
During a market bubble, you can make money by buying overvalued assets and selling them later for a profit, according to the Greater Fool Theory.
People are struggling. Some are ruined by collateralized loans and the gold rush.
Finances are ruined.
It's uncomfortable.
The same happened in 2018, during the ICO crash or in 1999/2000 when the dot com bubble burst. But the underlying technology hasn’t gone away.

shivsak
3 years ago
A visual exploration of the REAL use cases for NFTs in the Future
In this essay, I studied REAL NFT use examples and their potential uses.
Knowledge of the Hype Cycle
Gartner's Hype Cycle.
It proposes 5 phases for disruptive technology.
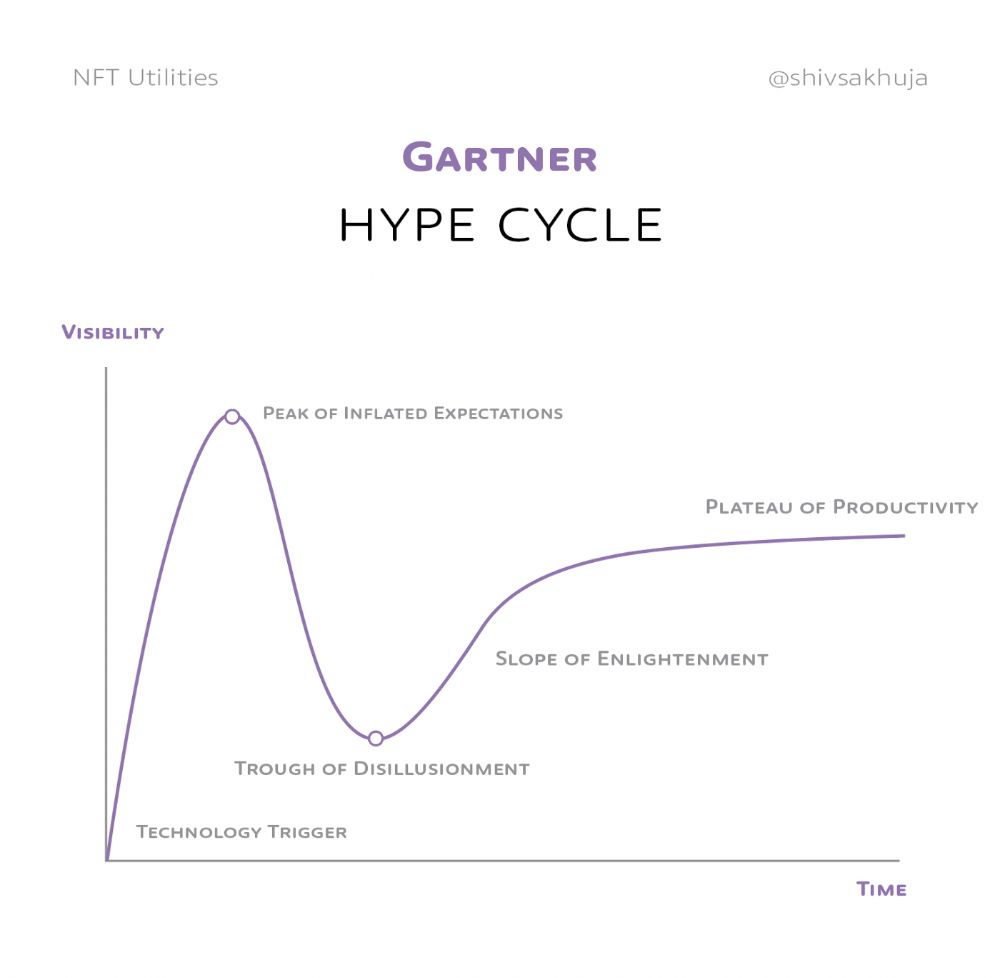
1. Technology Trigger: the emergence of potentially disruptive technology.
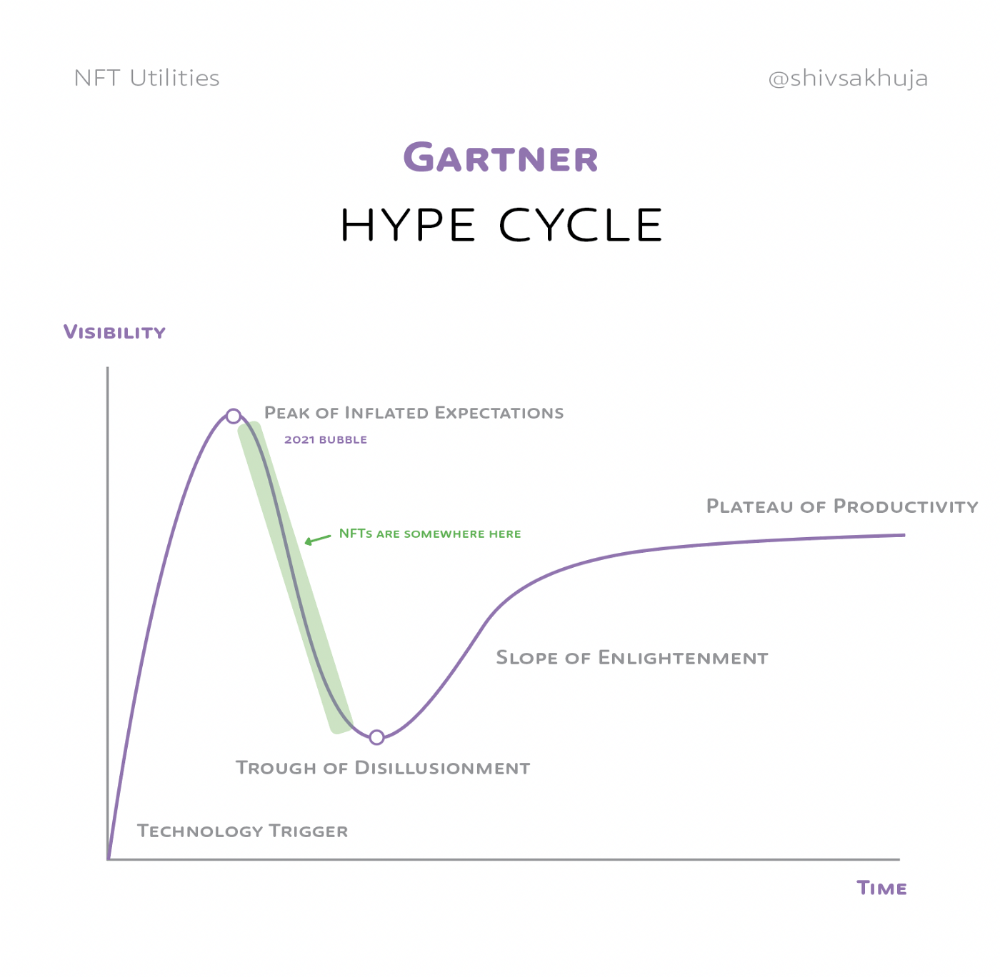
2. Peak of Inflated Expectations: Early publicity creates hype. (Ex: 2021 Bubble)
3. Trough of Disillusionment: Early projects fail to deliver on promises and the public loses interest. I suspect NFTs are somewhere around this trough of disillusionment now.
4. Enlightenment slope: The tech shows successful use cases.
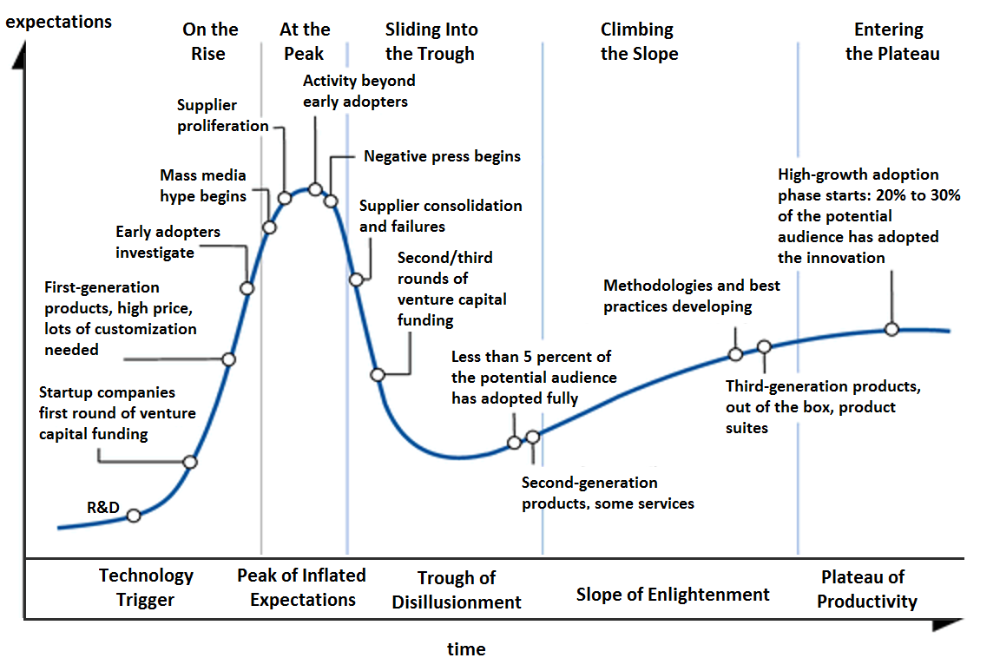
5. Plateau of Productivity: Mainstream adoption has arrived and broader market applications have proven themselves. Here’s a more detailed visual of the Gartner Hype Cycle from Wikipedia.
In the speculative NFT bubble of 2021, @beeple sold Everydays: the First 5000 Days for $69 MILLION in 2021's NFT bubble.
@nbatopshot sold millions in video collectibles.
This is when expectations peaked.
Let's examine NFTs' real-world applications.
Watch this video if you're unfamiliar with NFTs.
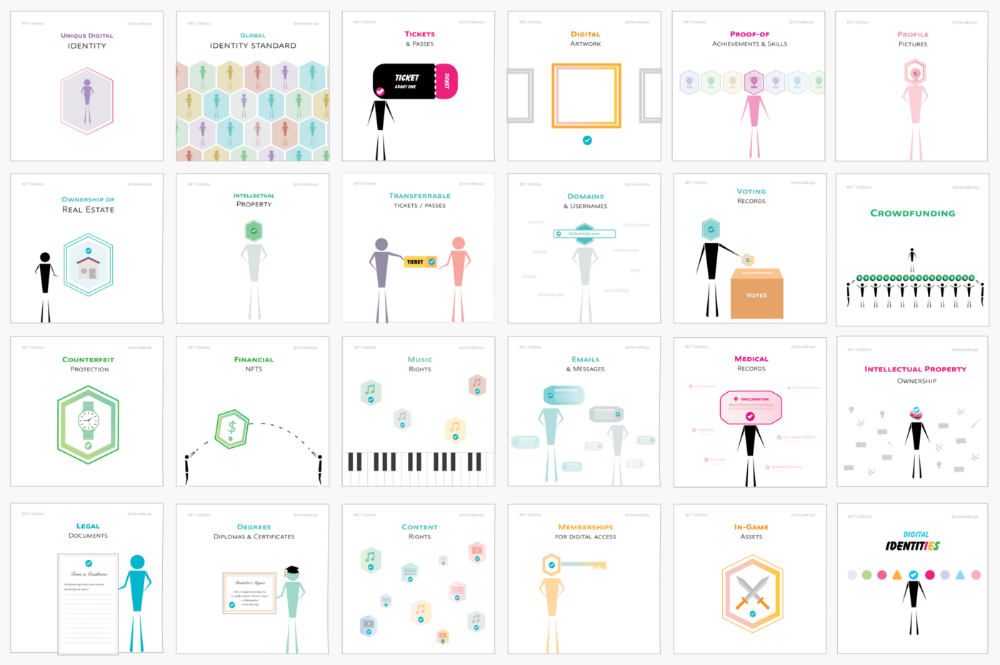
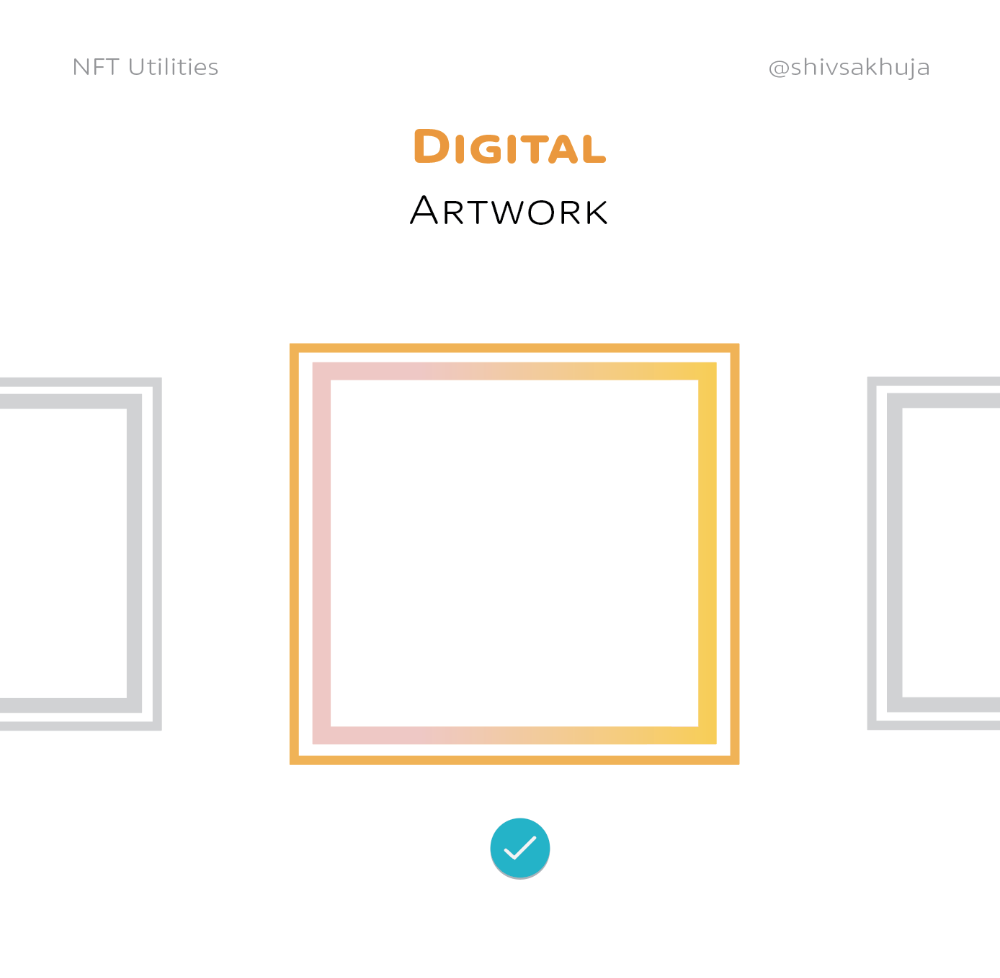
Online Art
Most people think NFTs are rich people buying worthless JPEGs and MP4s.
Digital artwork and collectibles are revolutionary for creators and enthusiasts.
NFT Profile Pictures
You might also have seen NFT profile pictures on Twitter.
My profile picture is an NFT I coined with @skogards factoria app, which helps me avoid bogus accounts.
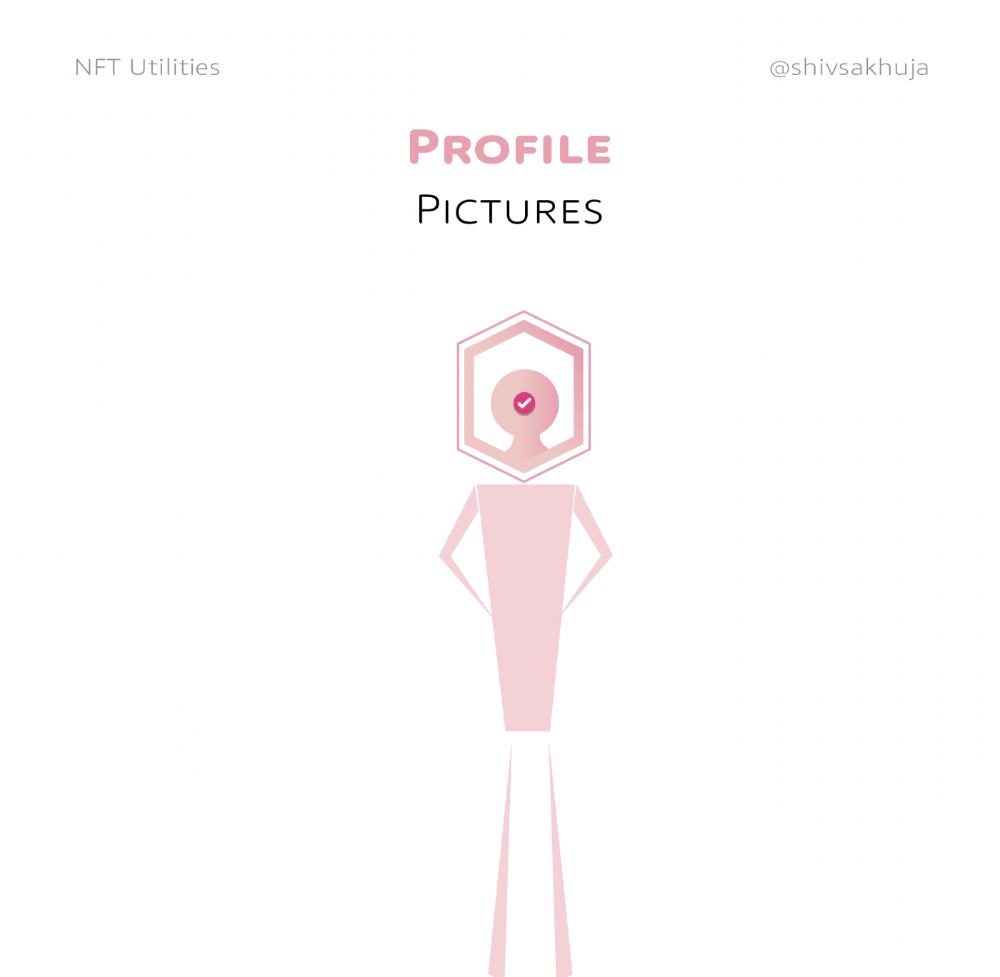
Profile pictures are a good beginning point because they're unique and clearly yours.
NFTs are a way to represent proof-of-ownership. It’s easier to prove ownership of digital assets than physical assets, which is why artwork and pfps are the first use cases.
They can do much more.
NFTs can represent anything with a unique owner and digital ownership certificate. Domains and usernames.
Usernames & Domains
@unstoppableweb, @ensdomains, @rarible sell NFT domains.
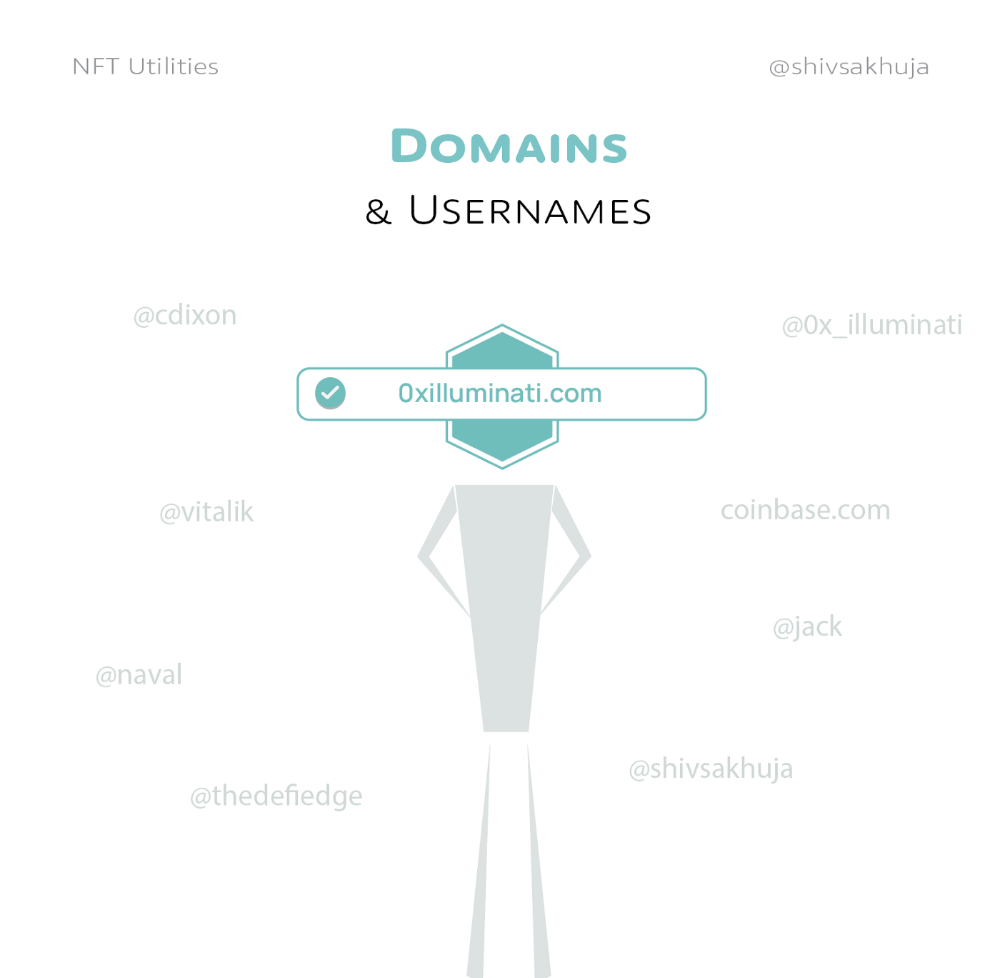
NFT domains are transferable, which is a benefit.
Godaddy and other web2 providers have difficult-to-transfer domains. Domains are often leased instead of purchased.
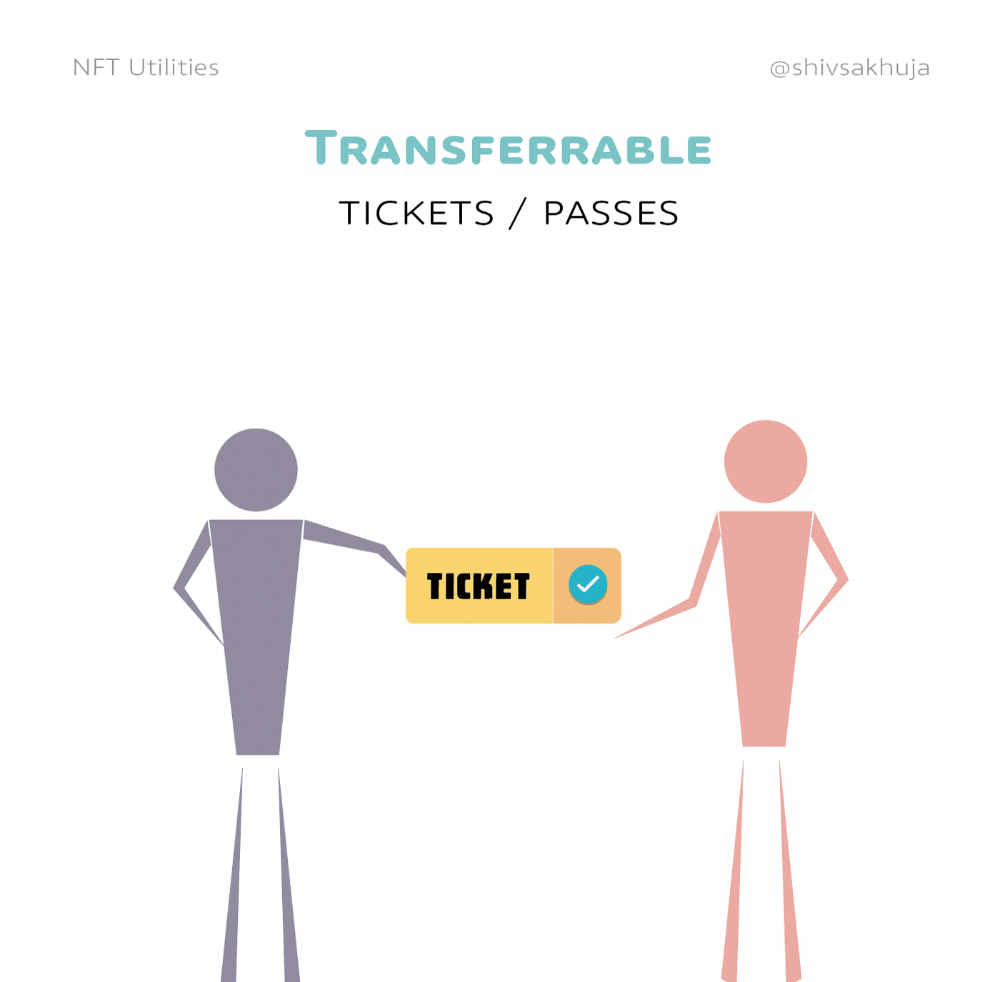
Tickets
NFTs can also represent concert tickets and event passes.
There's a limited number, and entry requires proof.
NFTs can eliminate the problem of forgery and make it easy to verify authenticity and ownership.
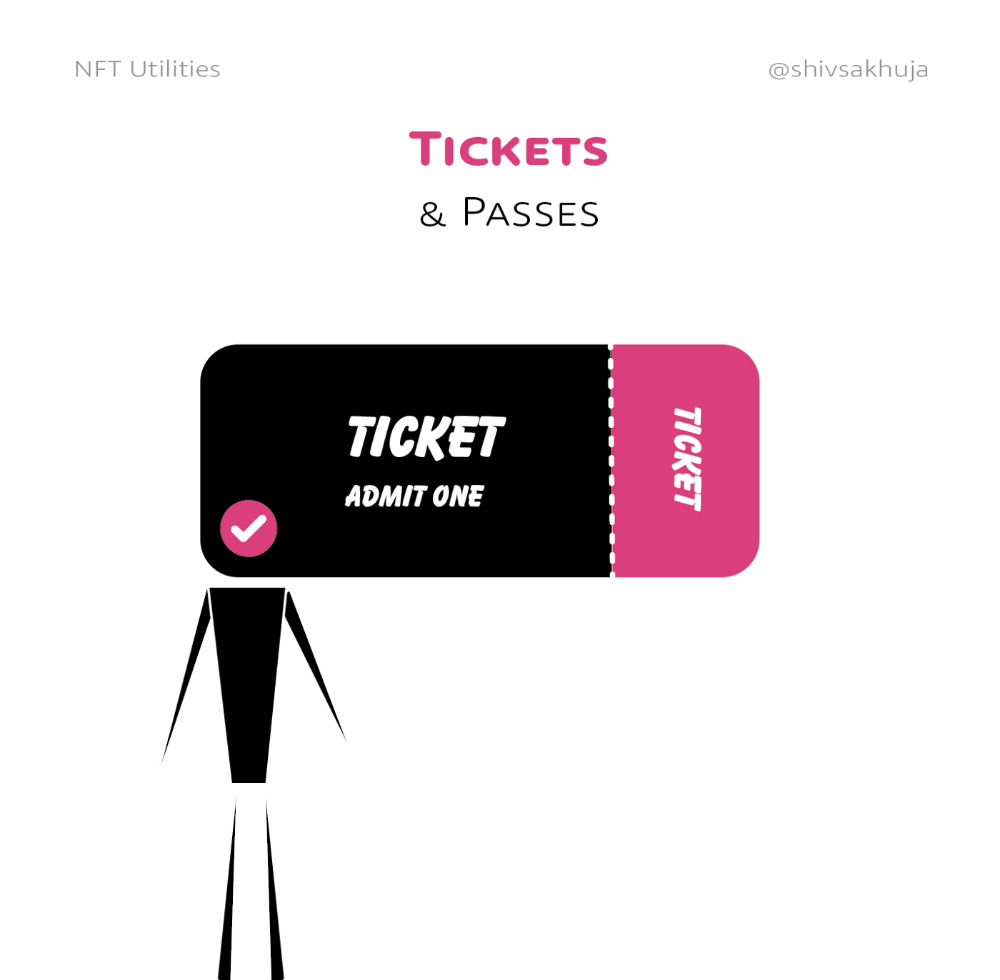
NFT tickets can be traded on the secondary market, which allows for:
marketplaces that are uniform and offer the seller and buyer security (currently, tickets are traded on inefficient markets like FB & craigslist)
unbiased pricing
Payment of royalties to the creator
4. Historical ticket ownership data implies performers can airdrop future passes, discounts, etc.
5. NFT passes can be a fandom badge.
The $30B+ online tickets business is increasing fast.
NFT-based ticketing projects:
Gaming Assets
NFTs also help in-game assets.
Imagine someone spending five years collecting a rare in-game blade, then outgrowing or quitting the game. Gamers value that collectible.
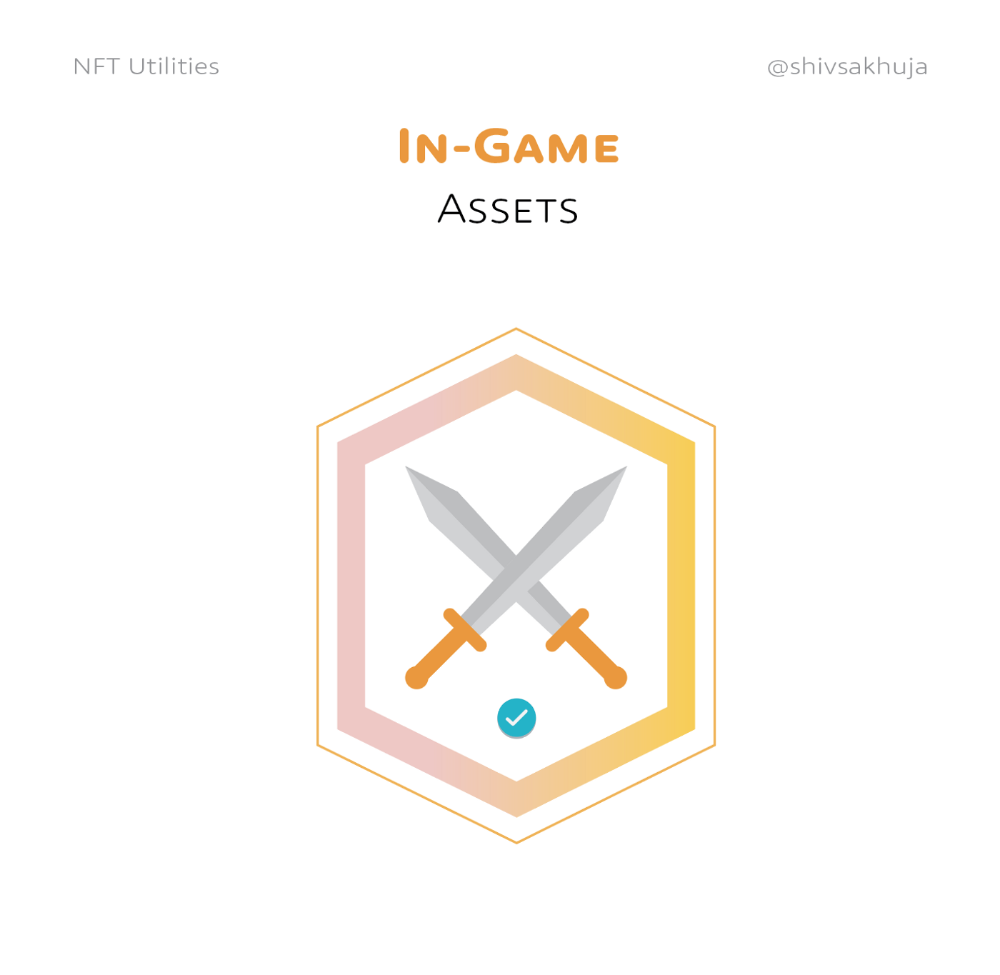
The gaming industry is expected to make $200 BILLION in revenue this year, a significant portion of which comes from in-game purchases.
Royalties on secondary market trading of gaming assets encourage gaming businesses to develop NFT-based ecosystems.
Digital assets are the start. On-chain NFTs can represent real-world assets effectively.
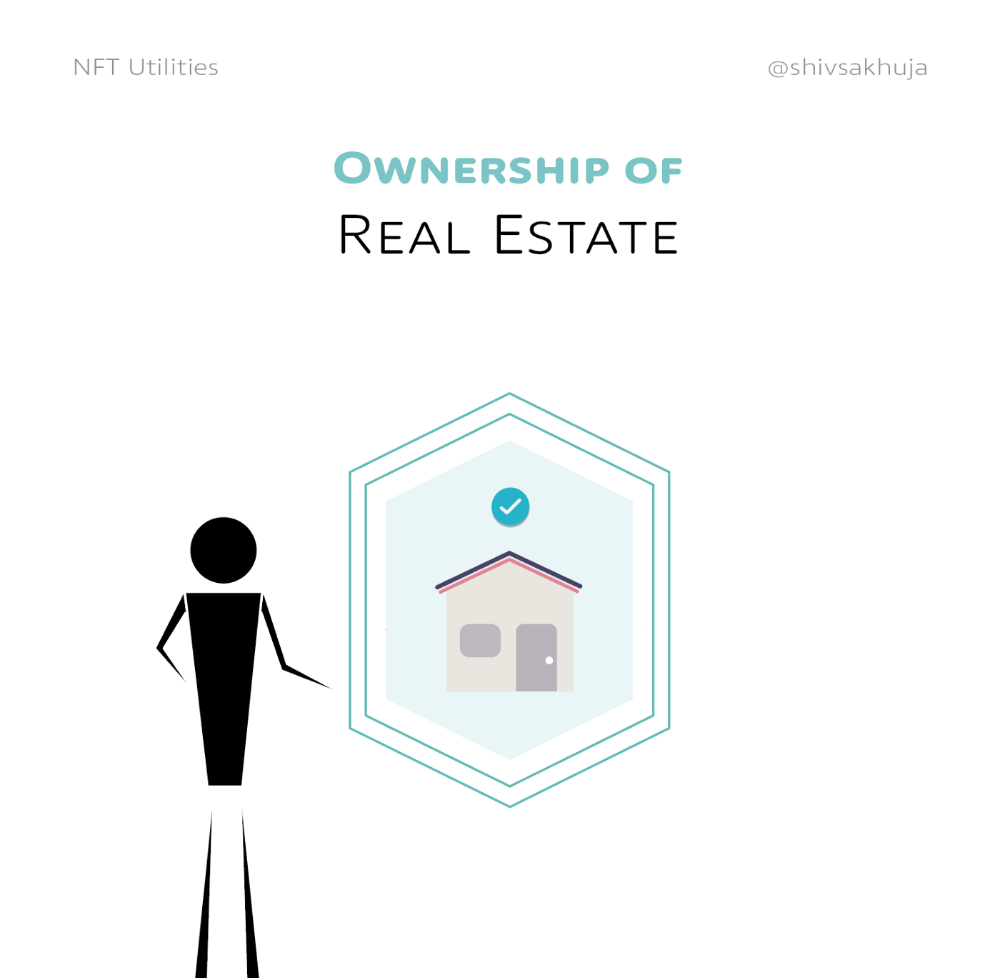
Real estate has a unique owner and requires ownership confirmation.
Real Estate
Tokenizing property has many benefits.
1. Can be fractionalized to increase access, liquidity
2. Can be collateralized to increase capital efficiency and access to loans backed by an on-chain asset
3. Allows investors to diversify or make bets on specific neighborhoods, towns or cities +++
I've written about this thought exercise before.
I made an animated video explaining this.
We've just explored NFTs for transferable assets. But what about non-transferrable NFTs?
SBTs are Soul-Bound Tokens. Vitalik Buterin (Ethereum co-founder) blogged about this.
NFTs are basically verifiable digital certificates.
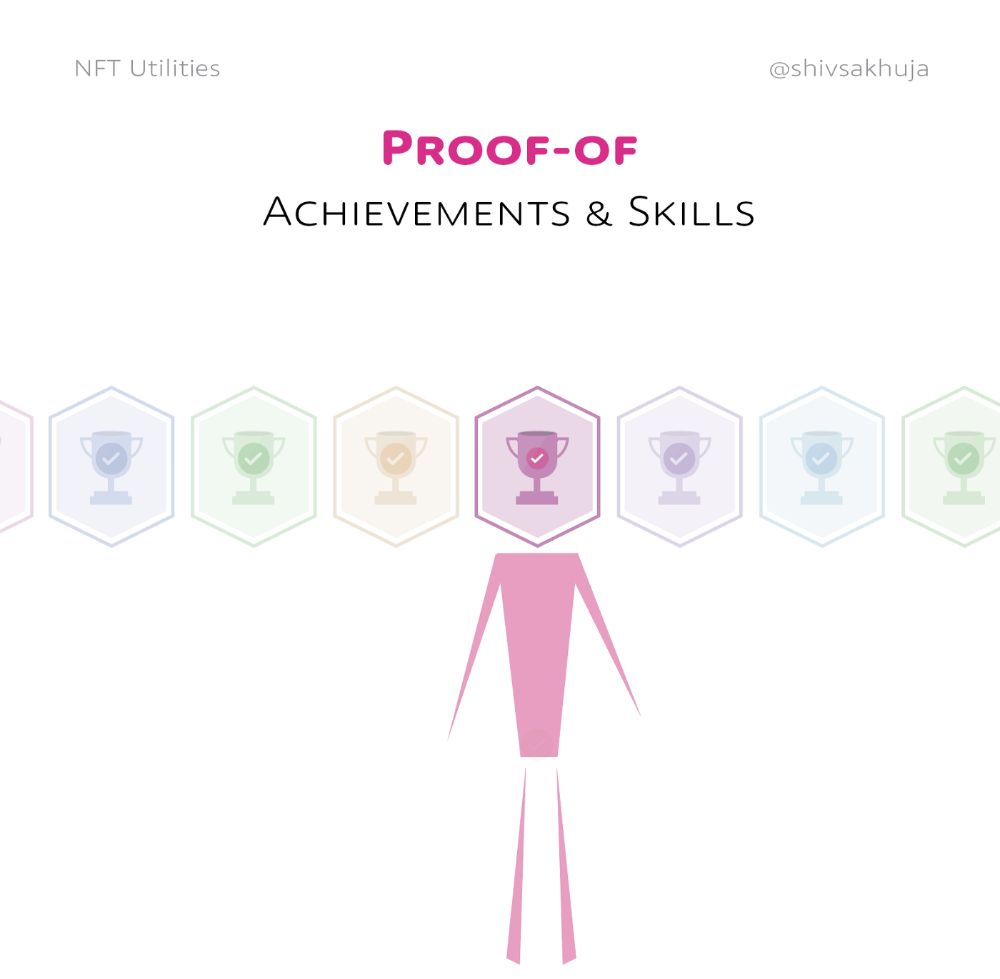
Diplomas & Degrees
That fits Degrees & Diplomas. These shouldn't be marketable, thus they can be non-transferable SBTs.

Anyone can verify the legitimacy of on-chain credentials, degrees, abilities, and achievements.
The same goes for other awards.
For example, LinkedIn could give you a verified checkmark for your degree or skills.
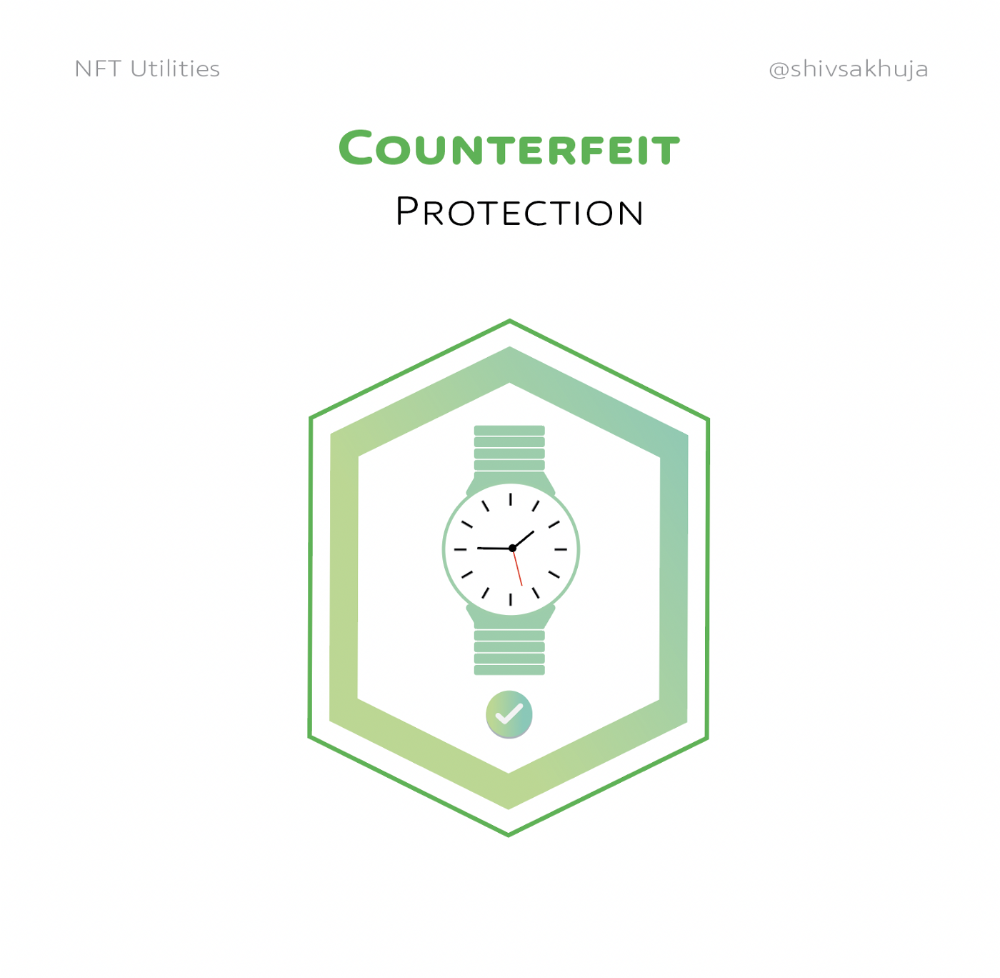
Authenticity Protection
NFTs can also safeguard against counterfeiting.
Counterfeiting is the largest criminal enterprise in the world, estimated to be $2 TRILLION a year and growing.
Anti-counterfeit tech is valuable.
This is one of @ORIGYNTech's projects.
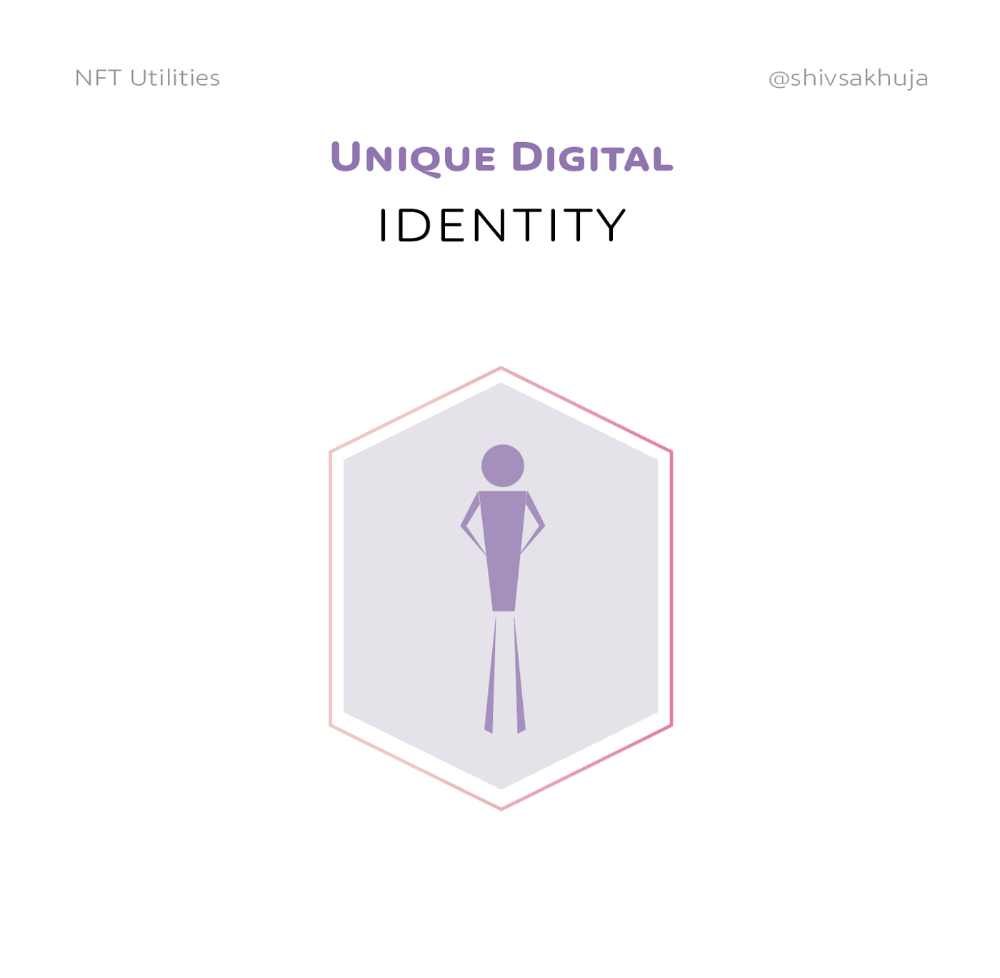
Identity
Identity theft/verification is another real-world problem NFTs can handle.
In the US, 15 million+ citizens face identity theft every year, suffering damages of over $50 billion a year.
This isn't surprising considering all you need for US identity theft is a 9-digit number handed around in emails, documents, on the phone, etc.
Identity NFTs can fix this.
NFTs are one-of-a-kind and unforgeable.
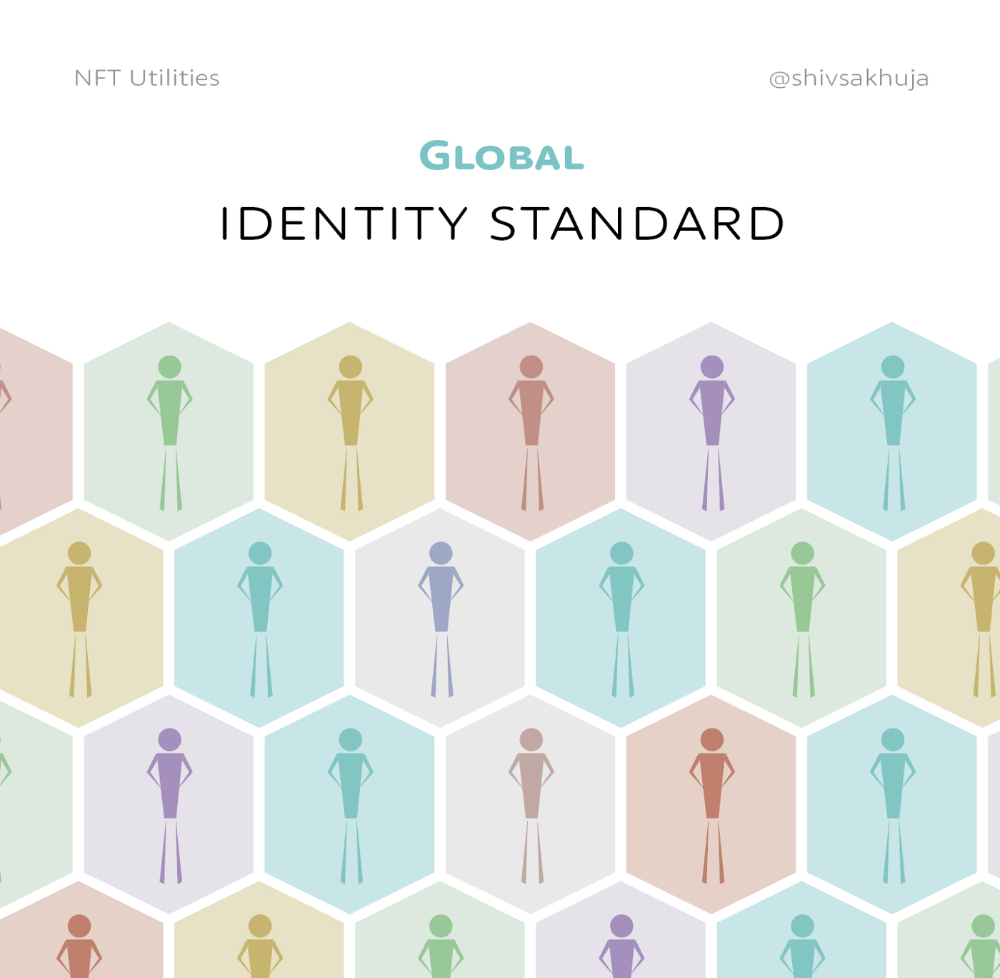
NFTs offer a universal standard.
NFTs are simple to verify.
SBTs, or non-transferrable NFTs, are tied to a particular wallet.
In the event of wallet loss or theft, NFTs may be revoked.
This could be one of the biggest use cases for NFTs.
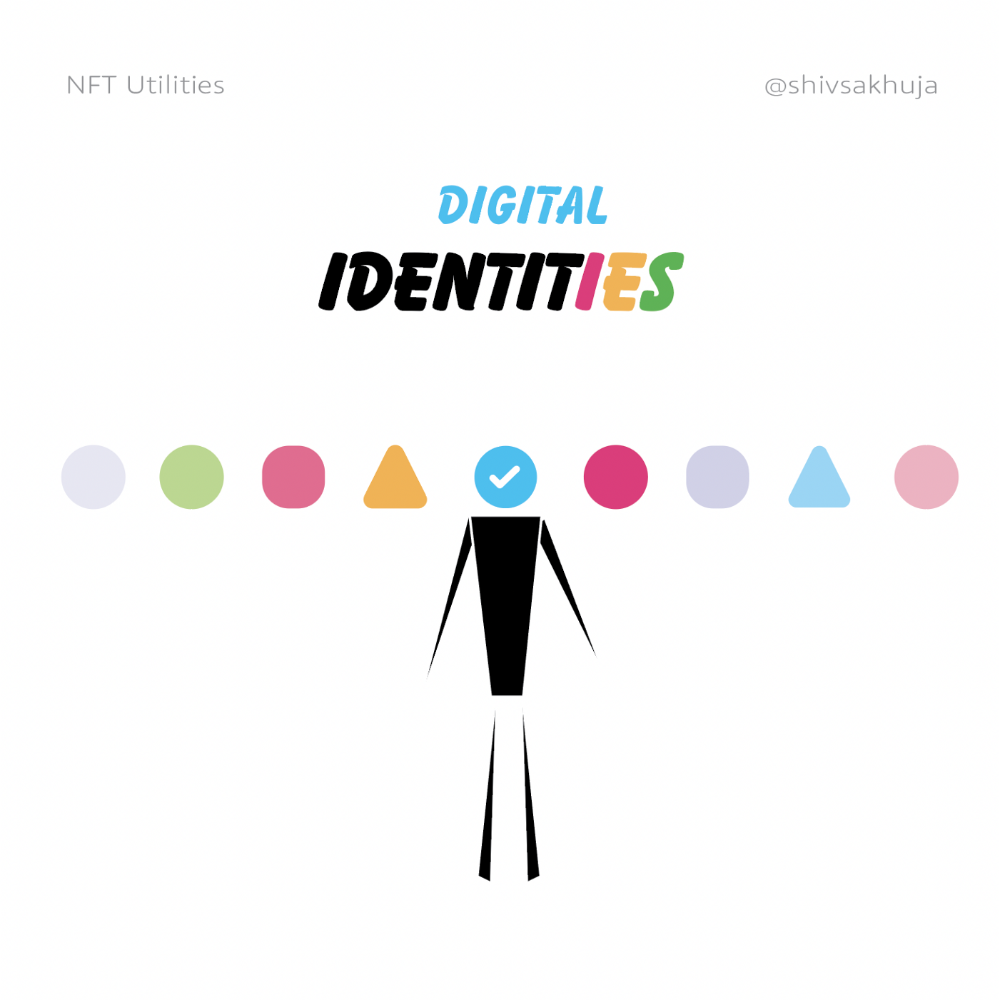
Imagine a global identity standard that is standardized across countries, cannot be forged or stolen, is digital, easy to verify, and protects your private details.
Since your identity is more than your government ID, you may have many NFTs.
@0xPolygon and @civickey are developing on-chain identity.
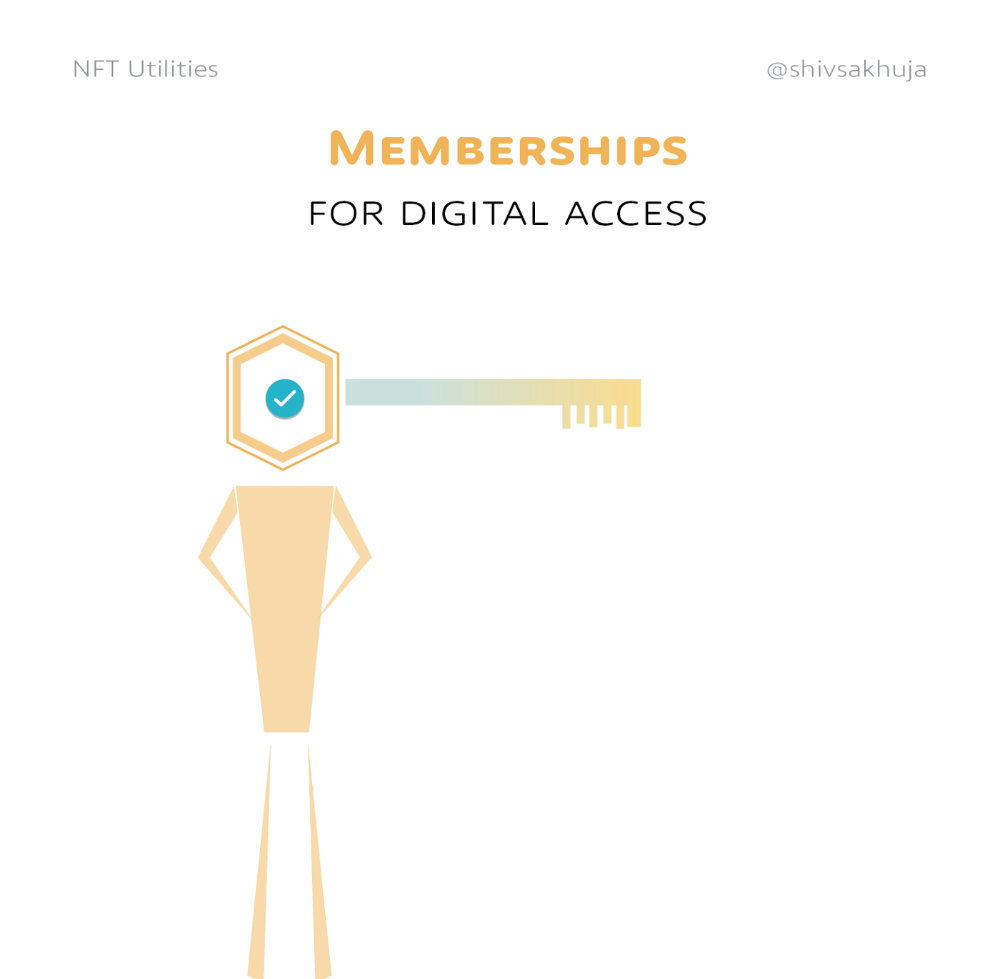
Memberships
NFTs can authenticate digital and physical memberships.
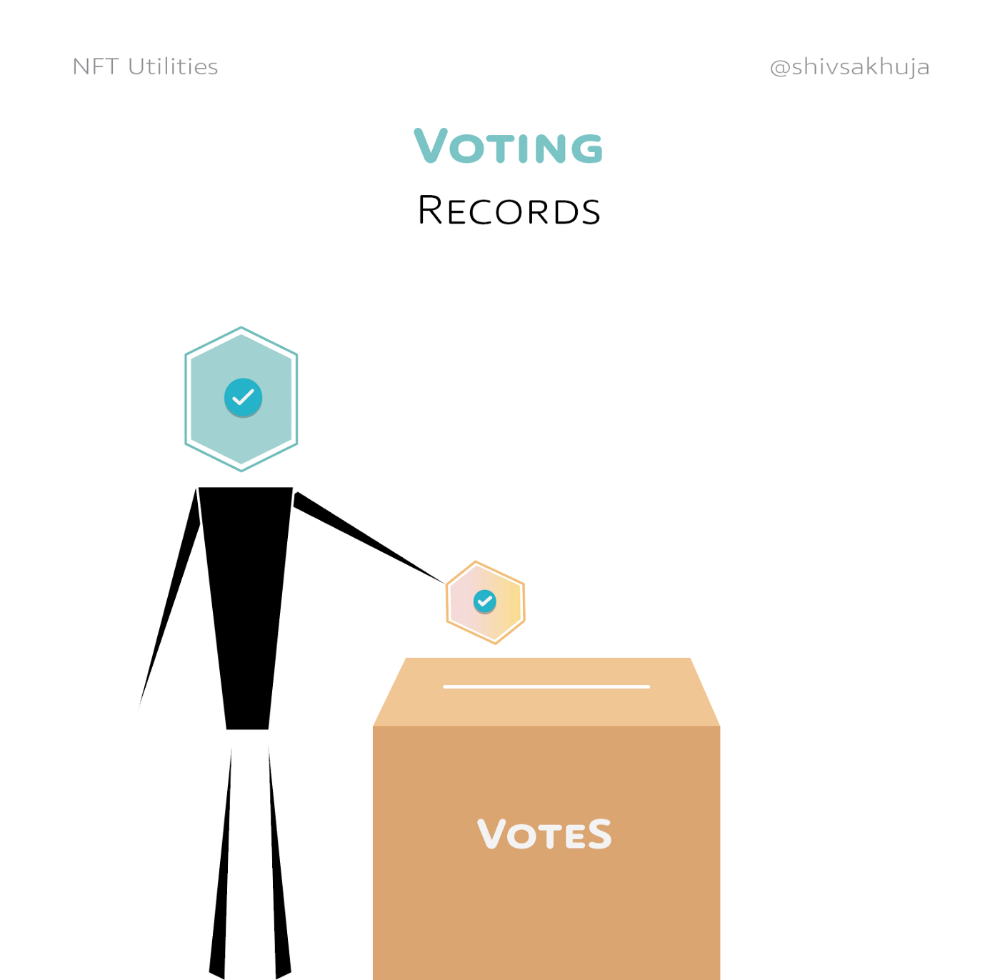
Voting
NFT IDs can verify votes.
If you remember 2020, you'll know why this is an issue.
Online voting's ease can boost turnout.
Informational property
NFTs can protect IP.
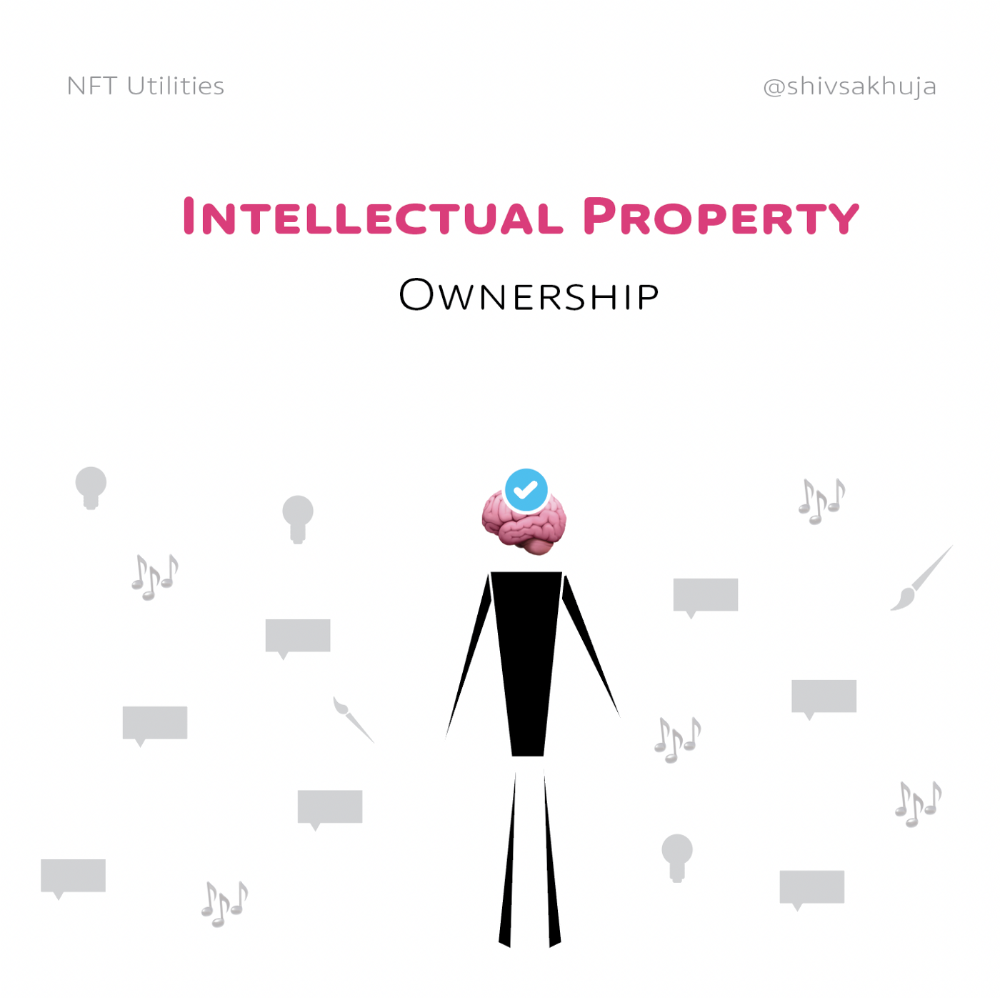
This can earn creators royalties.
NFTs have 2 important properties:
Verifiability IP ownership is unambiguously stated and publicly verified.
Platforms that enable authors to receive royalties on their IP can enter the market thanks to standardization.
Content Rights
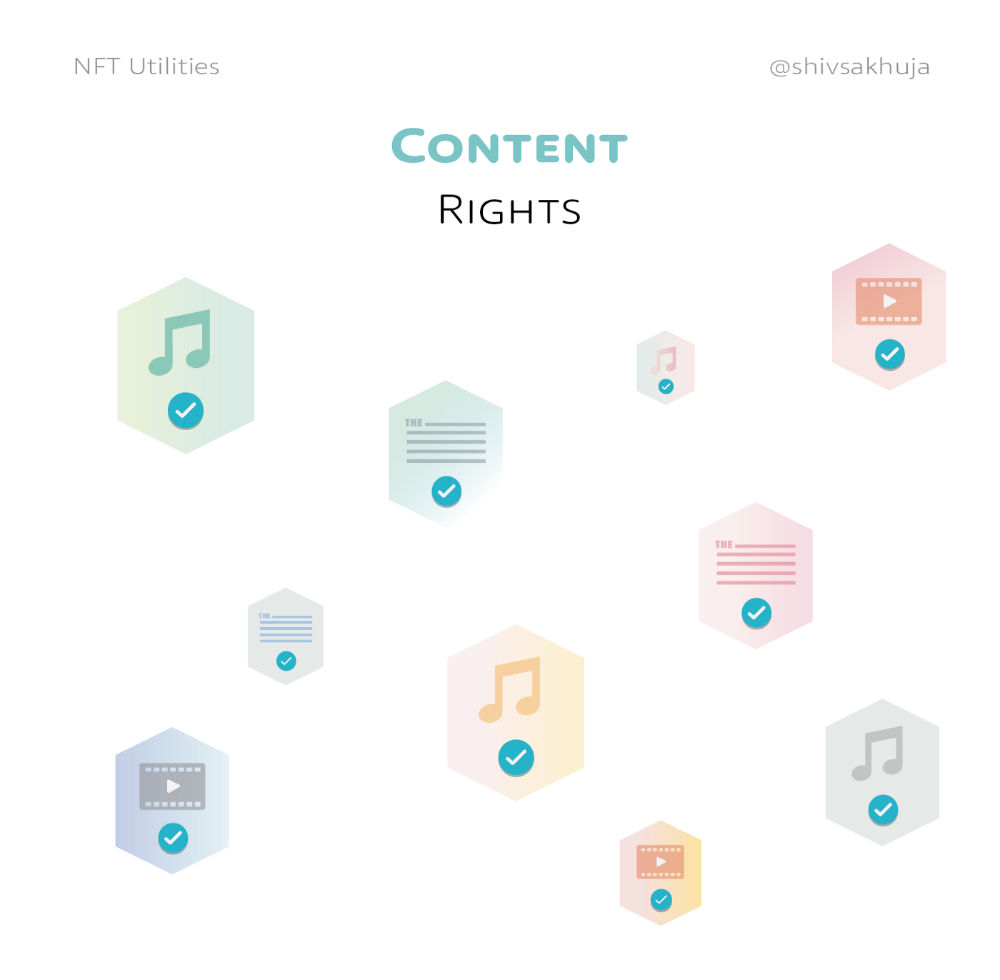
Monetization without copyrighting = more opportunities for everyone.
This works well with the music.
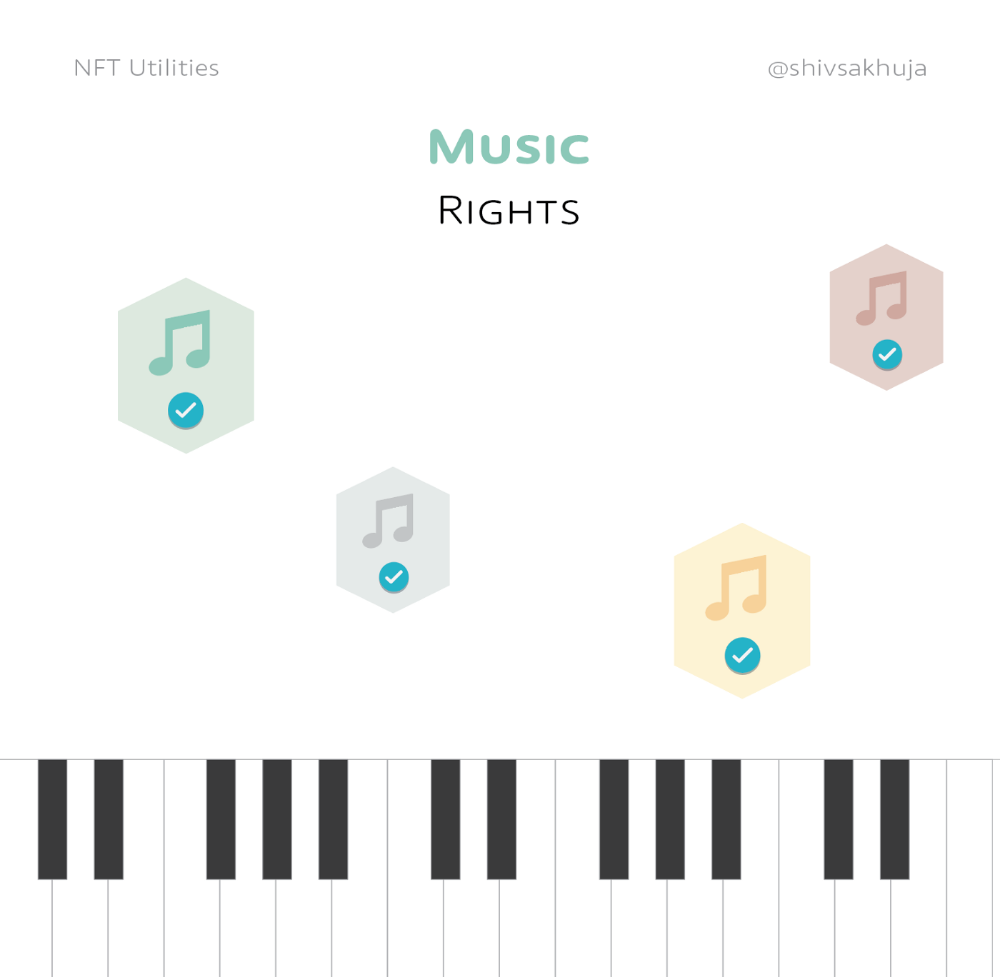
Spotify and Apple Music pay creators very little.
Crowdfunding
Creators can crowdfund with NFTs.
NFTs can represent future royalties for investors.
This is particularly useful for fields where people who are not in the top 1% can’t make money. (Example: Professional sports players)
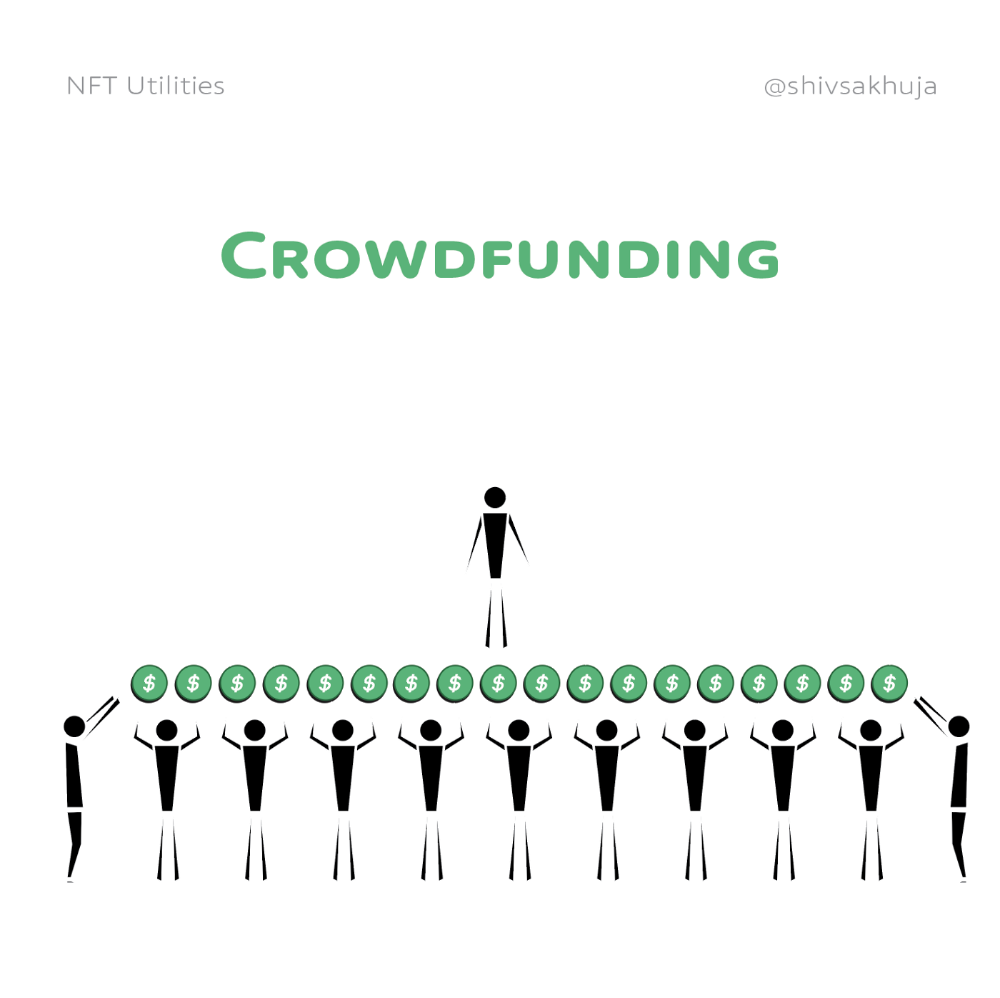
Mirror.xyz allows blog-based crowdfunding.
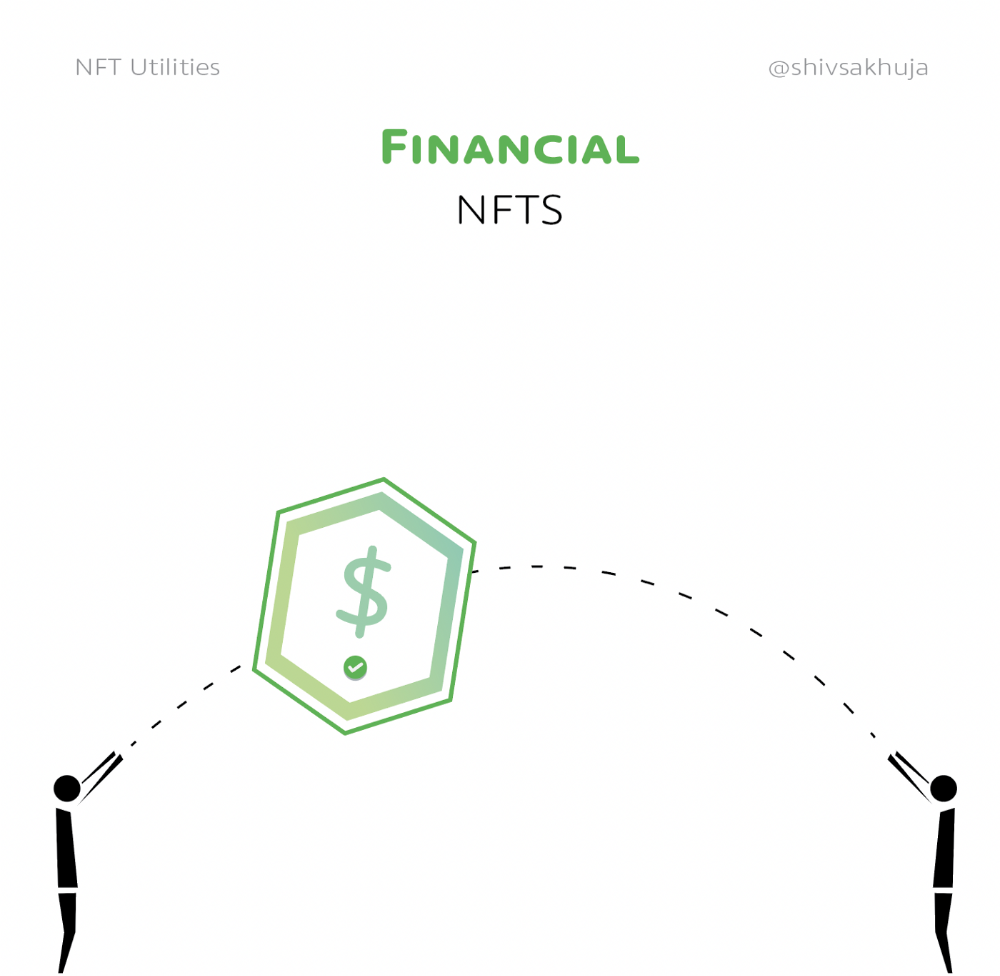
Financial NFTs
This introduces Financial NFTs (fNFTs). Unique financial contracts abound.
Examples:
a person's collection of assets (unique portfolio)
A loan contract that has been partially repaid with a lender
temporal tokens (ex: veCRV)
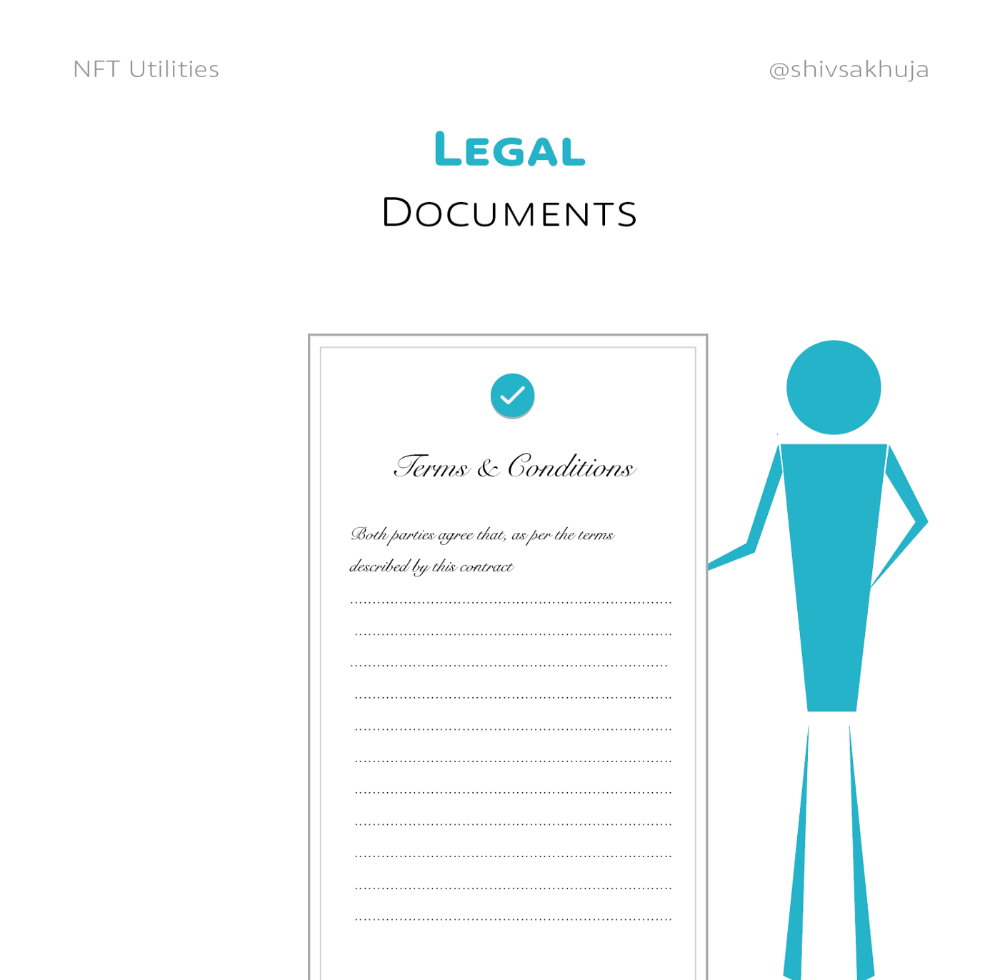
Legal Agreements
Not just financial contracts.
NFT can represent any legal contract or document.
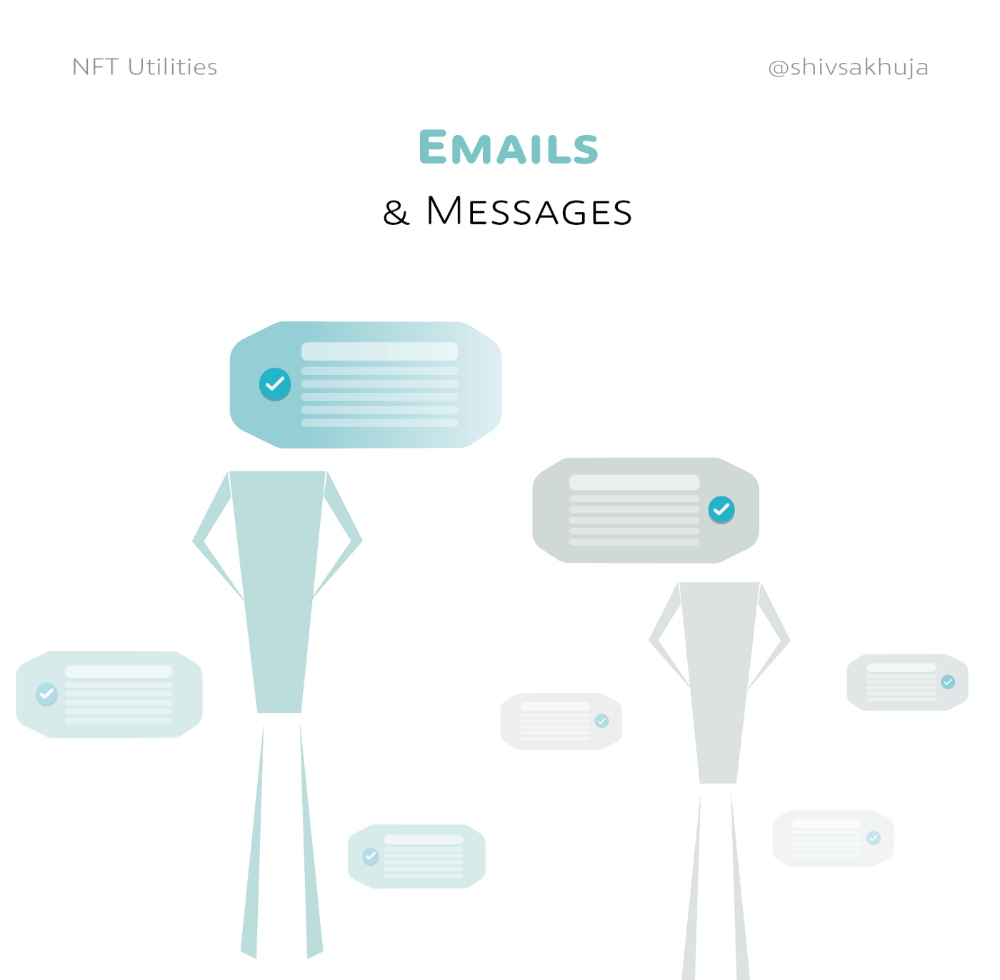
Messages & Emails
What about other agreements? Verbal agreements through emails and messages are likewise unique, but they're easily lost and fabricated.
Health Records
Medical records or prescriptions are another types of documentation that has to be verified but isn't.
Medical NFT examples:
Immunization records
Covid test outcomes
Prescriptions
health issues that may affect one's identity
Observations made via health sensors

Existing systems of proof by paper / PDF have photoshop-risk.
I tried to include most use scenarios, but this is just the beginning.
NFTs have many innovative uses.
For example: @ShaanVP minted an NFT called “5 Minutes of Fame” 👇
Here are 2 Twitter threads about NFTs:
This piece of gold by @chriscantino
2. This conversation between @punk6529 and @RaoulGMI on @RealVision“The World According to @punk6529”
If you're wondering why NFTs are better than web2 databases for these use scenarios, see this Twitter thread I wrote:
If you liked this, please share it.
You might also like
Tom Connor
3 years ago
12 mental models that I use frequently
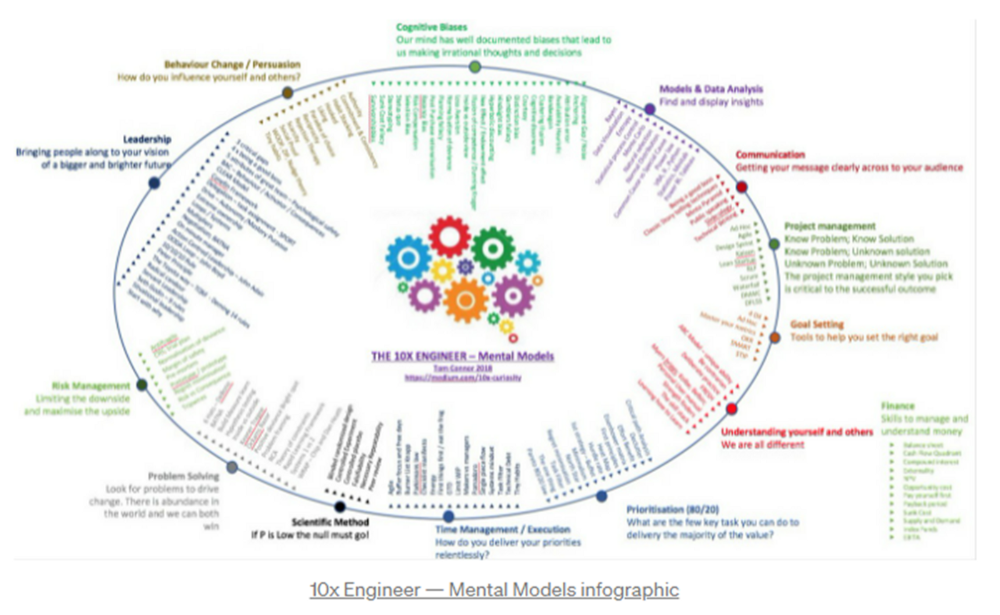
https://tomconnor.me/wp-content/uploads/2021/08/10x-Engineer-Mental-Models.pdf
I keep returning to the same mental models and tricks after writing and reading about a wide range of topics.
Top 12 mental models
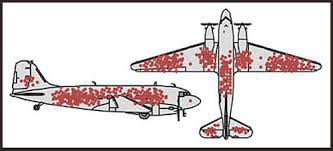
12.
Survival bias - We perceive the surviving population as remarkable, yet they may have gotten there through sheer grit.
Survivorship bias affects us in many situations. Our retirement fund; the unicorn business; the winning team. We often study and imitate the last one standing. This can lead to genuine insights and performance improvements, but it can also lead us astray because the leader may just be lucky.
11.
The Helsinki Bus Theory - How to persevere Buss up!
Always display new work, and always be compared to others. Why? Easy. Keep riding. Stay on the fucking bus.
10.
Until it sticks… Turning up every day… — Artists teach engineers plenty. Quality work over a career comes from showing up every day and starting.
9.
WRAP decision making process (Heath Brothers)
Decision-making WRAP Model:
W — Widen your Options
R — Reality test your assumptions
A — Attain Distance
P — Prepare to be wrong or Right
8.
Systems for knowledge worker excellence - Todd Henry and Cal Newport write about techniques knowledge workers can employ to build a creative rhythm and do better work.
Todd Henry's FRESH framework:
Focus: Keep the start in mind as you wrap up.
Relationships: close a loop that's open.
Pruning is an energy.
Set aside time to be inspired by stimuli.
Hours: Spend time thinking.
7.
BBT is learning from mistakes. Science has transformed the world because it constantly updates its theories in light of failures. Complexity guarantees failure. Do we learn or self-justify?
6.
The OODA Loop - Competitive advantage
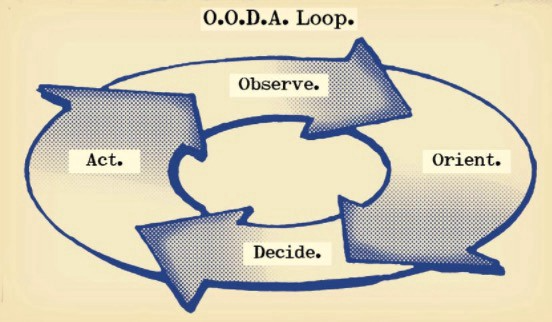
O: Observe: collect the data. Figure out exactly where you are, what’s happening.
O: Orient: analyze/synthesize the data to form an accurate picture.
D: Decide: select an action from possible options
A: Action: execute the action, and return to step (1)
Boyd's approach indicates that speed and agility are about information processing, not physical reactions. They form feedback loops. More OODA loops improve speed.
5.
Leaders who try to impose order in a complex situation fail; those who set the stage, step back, and allow patterns to develop win.
https://vimeo.com/640941172?embedded=true&source=vimeo_logo&owner=11999906
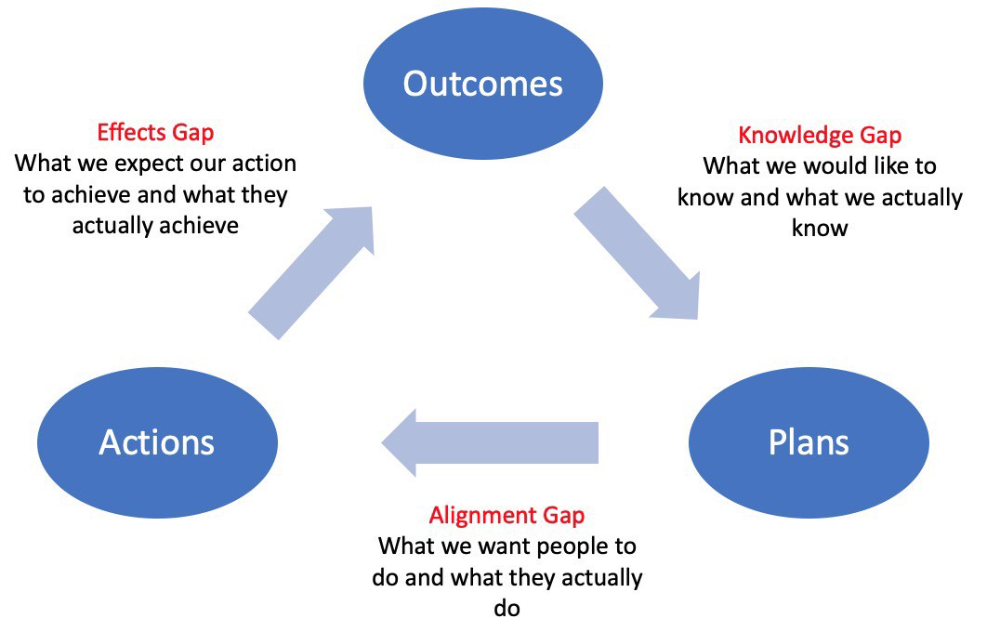
4.
Information Gap - The discrepancy between what we know and what we would like to know
Gap in Alignment - What individuals actually do as opposed to what we wish them to do
Effects Gap - the discrepancy between our expectations and the results of our actions
3.
Theory of Constraints — The Goal - To maximize system production, maximize bottleneck throughput.
Goldratt creates a five-step procedure:
Determine the restriction
Improve the restriction.
Everything else should be based on the limitation.
Increase the restriction
Go back to step 1 Avoid letting inertia become a limitation.
Any non-constraint improvement is an illusion.
2.
Serendipity and the Adjacent Possible - Why do several amazing ideas emerge at once? How can you foster serendipity in your work?
You need specialized abilities to reach to the edge of possibilities, where you can pursue exciting tasks that will change the world. Few people do it since it takes a lot of hard work. You'll stand out if you do.
Most people simply lack the comfort with discomfort required to tackle really hard things. At some point, in other words, there’s no way getting around the necessity to clear your calendar, shut down your phone, and spend several hard days trying to make sense of the damn proof.
1.
Boundaries of failure - Rasmussen's accident model.
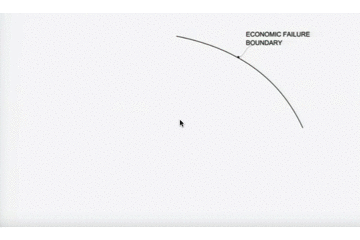
Rasmussen modeled this. It has economic, workload, and performance boundaries.
The economic boundary is a company's profit zone. If the lights are on, you're within the economic boundaries, but there's pressure to cut costs and do more.
Performance limit reflects system capacity. Taking shortcuts is a human desire to minimize work. This is often necessary to survive because there's always more labor.
Both push operating points toward acceptable performance. Personal or process safety, or equipment performance.
If you exceed acceptable performance, you'll push back, typically forcefully.

Alex Mathers
25 years ago
400 articles later, nobody bothered to read them.
Writing for readers:
14 years of daily writing.
I post practically everything on social media. I authored hundreds of articles, thousands of tweets, and numerous volumes to almost no one.
Tens of thousands of readers regularly praise me.
I despised writing. I'm stuck now.
I've learned what readers like and what doesn't.
Here are some essential guidelines for writing with impact:
Readers won't understand your work if you can't.
Though obvious, this slipped me up. Share your truths.
Stories engage human brains.
Showing the journey of a person from worm to butterfly inspires the human spirit.
Overthinking hinders powerful writing.
The best ideas come from inner understanding in between thoughts.
Avoid writing to find it. Write.
Writing a masterpiece isn't motivating.
Write for five minutes to simplify. Step-by-step, entertaining, easy steps.
Good writing requires a willingness to make mistakes.
So write loads of garbage that you can edit into a good piece.
Courageous writing.
A courageous story will move readers. Personal experience is best.
Go where few dare.
Templates, outlines, and boundaries help.
Limitations enhance writing.
Excellent writing is straightforward and readable, removing all the unnecessary fat.
Use five words instead of nine.
Use ordinary words instead of uncommon ones.
Readers desire relatability.
Too much perfection will turn it off.
Write to solve an issue if you can't think of anything to write.
Instead, read to inspire. Best authors read.
Every tweet, thread, and novel must have a central idea.
What's its point?
This can make writing confusing.
️ Don't direct your reader.
Readers quit reading. Demonstrate, describe, and relate.
Even if no one responds, have fun. If you hate writing it, the reader will too.

Eve Arnold
3 years ago
Your Ideal Position As a Part-Time Creator
Inspired by someone I never met
Inspiration is good and bad.
Paul Jarvis inspires me. He's a web person and writer who created his own category by being himself.
Paul said no thank you when everyone else was developing, building, and assuming greater responsibilities. This isn't success. He rewrote the rules. Working for himself, expanding at his own speed, and doing what he loves were his definitions of success.
Play with a problem that you have
The biggest problem can be not recognizing a problem.
Acceptance without question is deception. When you don't push limits, you forget how. You start thinking everything must be as it is.
For example: working. Paul worked a 9-5 agency work with little autonomy. He questioned whether the 9-5 was a way to live, not the way.
Another option existed. So he chipped away at how to live in this new environment.
Don't simply jump
Internet writers tell people considering quitting 9-5 to just quit. To throw in the towel. To do what you like.
The advice is harmful, despite the good intentions. People think quitting is hard. Like courage is the issue. Like handing your boss a resignation letter.
Nope. The tough part comes after. It’s easy to jump. Landing is difficult.
The landing
Paul didn't quit. Intelligent individuals don't. Smart folks focus on landing. They imagine life after 9-5.
Paul had been a web developer for a long time, had solid clients, and was respected. Hence if he pushed the limits and discovered another route, he had the potential to execute.
Working on the side
Society loves polarization. It’s left or right. Either way. Or chaos. It's 9-5 or entrepreneurship.
But like Paul, you can stretch polarization's limits. In-between exists.
You can work a 9-5 and side jobs (as I do). A mix of your favorites. The 9-5's stability and creativity. Fire and routine.
Remember you can't have everything but anything. You can create and work part-time.
My hybrid lifestyle
Not selling books doesn't destroy my world. My globe keeps spinning if my new business fails or if people don't like my Tweets. Unhappy algorithm? Cool. I'm not bothered (okay maybe a little).
The mix gives me the best of both worlds. To create, hone my skill, and grasp big-business basics. I like routine, but I also appreciate spending 4 hours on Saturdays writing.
Some days I adore leaving work at 5 pm and disconnecting. Other days, I adore having a place to write if inspiration strikes during a run or a discussion.
I’m a part-time creator
I’m a part-time creator. No, I'm not trying to quit. I don't work 5 pm - 2 am on the side. No, I'm not at $10,000 MRR.
I work part-time but enjoy my 9-5. My 9-5 has goodies. My side job as well.
It combines both to meet my lifestyle. I'm satisfied.
Join the Part-time Creators Club for free here. I’ll send you tips to enhance your creative game.